Methodology note: The efficient frontier is the set of portfolios with the highest expected return for each modeled risk level—or lowest modeled risk for each expected return—under stated inputs and constraints. It does not simultaneously maximize return and minimize risk, and it does not identify one best portfolio for everyone. Expected returns, covariances, constraints, estimation error, taxes, costs, non-normal returns, and investor liabilities can materially change the result. CFA Institute summarizes the portfolio-risk and efficient-frontier framework.
The Efficient Frontier: Expected Return for a Given Level of Risk
The efficient frontier is the curve on a risk-return chart that shows the set of portfolios offering the highest expected return for each level of risk. Any portfolio below the curve leaves return on the table; nothing…
8 min read
Practice investing with Finelo
Build practical investing skills with guided lessons, simulator practice, and structured challenges.
Want to learn more?
Build practical investing skills with guided lessons, simulator practice, and structured challenges.
Explore FineloExplore Finelo's 28-day challenges
Turn learning into a daily habit with guided challenge paths.
The efficient frontier is the curve on a risk-return chart that shows the set of portfolios offering the highest expected return for each level of risk. Any portfolio below the curve leaves return on the table; nothing above it is achievable with the assets you selected. This page is for investors and finance learners who want a plain-English understanding of how the efficient frontier works, how to build one, and where it breaks down. Read the sections below, then practice the idea with a portfolio simulator before applying it to real money.
The sections below separate the model's definition, inputs, constraints, and practical limitations.
What the efficient frontier is and why it matters
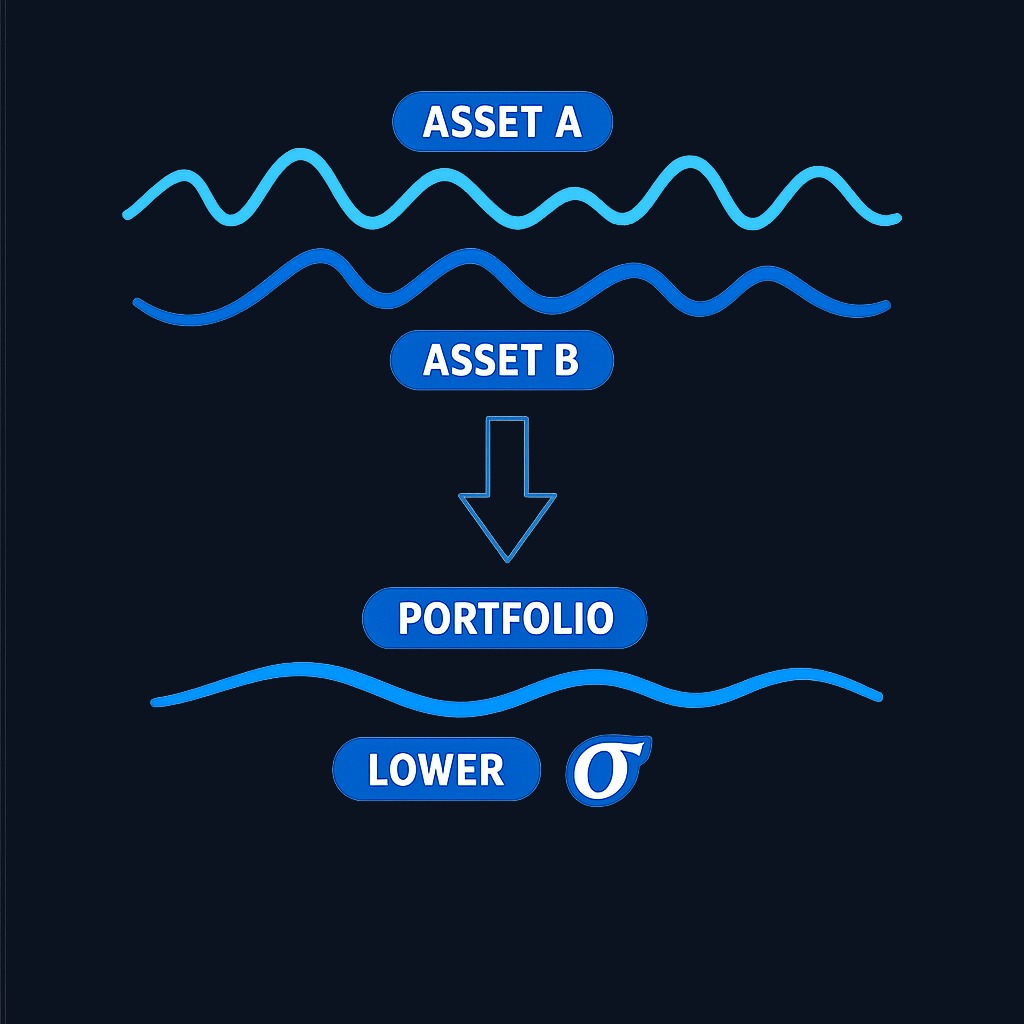
The concept comes from modern portfolio theory, the framework Harry Markowitz introduced in the 1950s. The core insight is that a portfolio's risk depends not only on each asset's individual volatility but also on how the assets move together. Combining assets whose returns do not move in lockstep can lower total portfolio risk without an equal sacrifice in expected return.
Plotted on a chart, every possible mix of your chosen assets forms a cloud of points. The horizontal axis measures risk, usually the standard deviation of returns. The vertical axis measures expected return. The upper-left edge of that cloud is the efficient frontier. Portfolios that sit on this edge are called efficient because no other combination of the same assets delivers more expected return at the same risk, or the same return at lower risk.
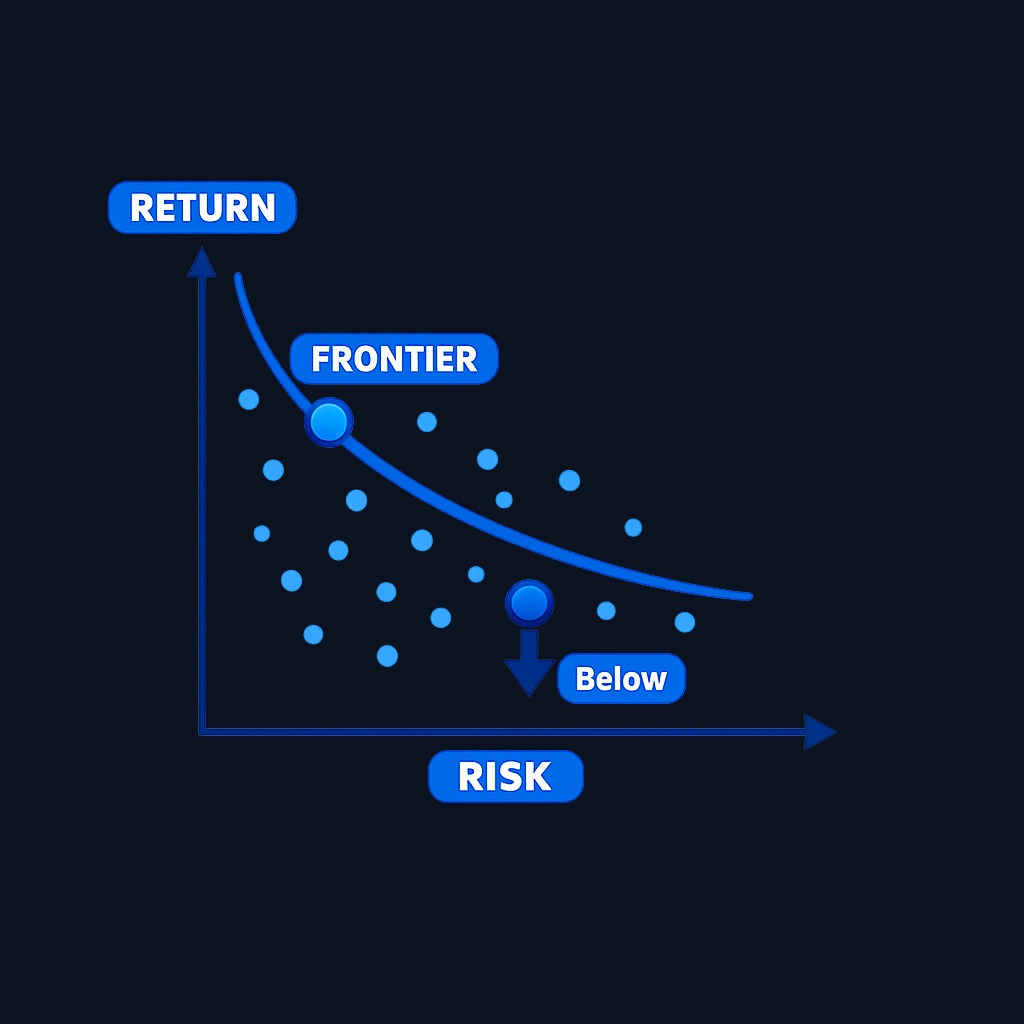
Why it matters is practical: the frontier turns a vague goal like "balance risk and reward" into a concrete target. Instead of asking whether a single stock is good, you ask whether adding it moves your whole portfolio closer to the efficient edge.
Risk and return: the building blocks
Three inputs drive the entire model, and each is an estimate rather than a fact:
- Expected return for each asset, often based on historical averages or analyst forecasts.
- Volatility for each asset, measured as the standard deviation of past returns.
- Correlation between every pair of assets, describing how they move relative to each other.
Covariance is central to modeled portfolio variance. Combining imperfectly correlated assets can reduce modeled volatility for given weights and volatilities, but the result depends on estimates and does not imply that the market rewards the combination or that future stress correlations will match history.
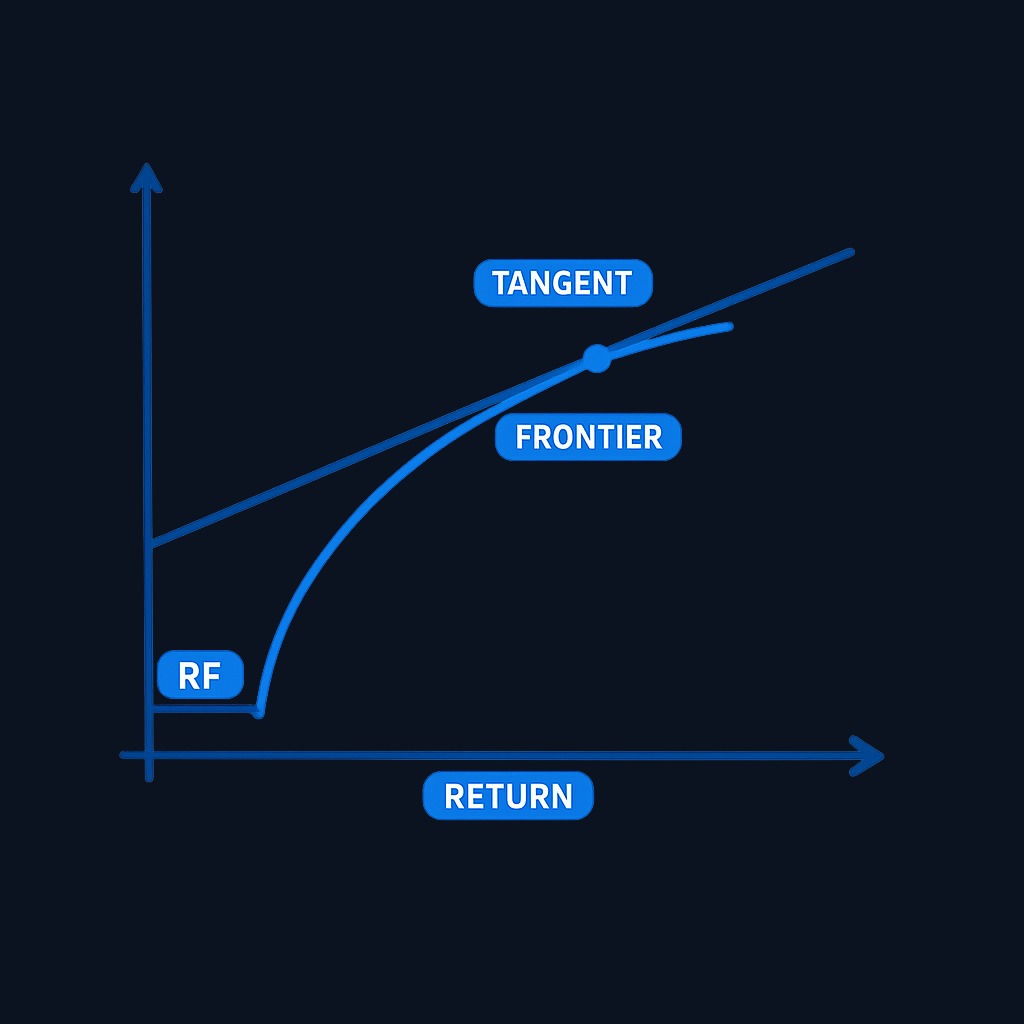
A model may add a risk-free asset, commonly proxied in the chosen currency and horizon by an appropriate government rate. Under the model's assumptions, the line tangent to the risky-asset frontier identifies the portfolio with the highest modeled Sharpe ratio. Borrowing and lending rates, taxes, constraints, and estimation error can change or eliminate that result.
How to construct an efficient frontier
You can build a simple frontier yourself with spreadsheet software or a portfolio tool:
- Pick your asset universe. Start small: a stock index fund, a bond fund, and perhaps an international fund. You can review a fund's official filings and holdings through the SEC's EDGAR database before including it.
- Gather return history. Collect monthly returns for each asset over a meaningful window, commonly five to ten years.
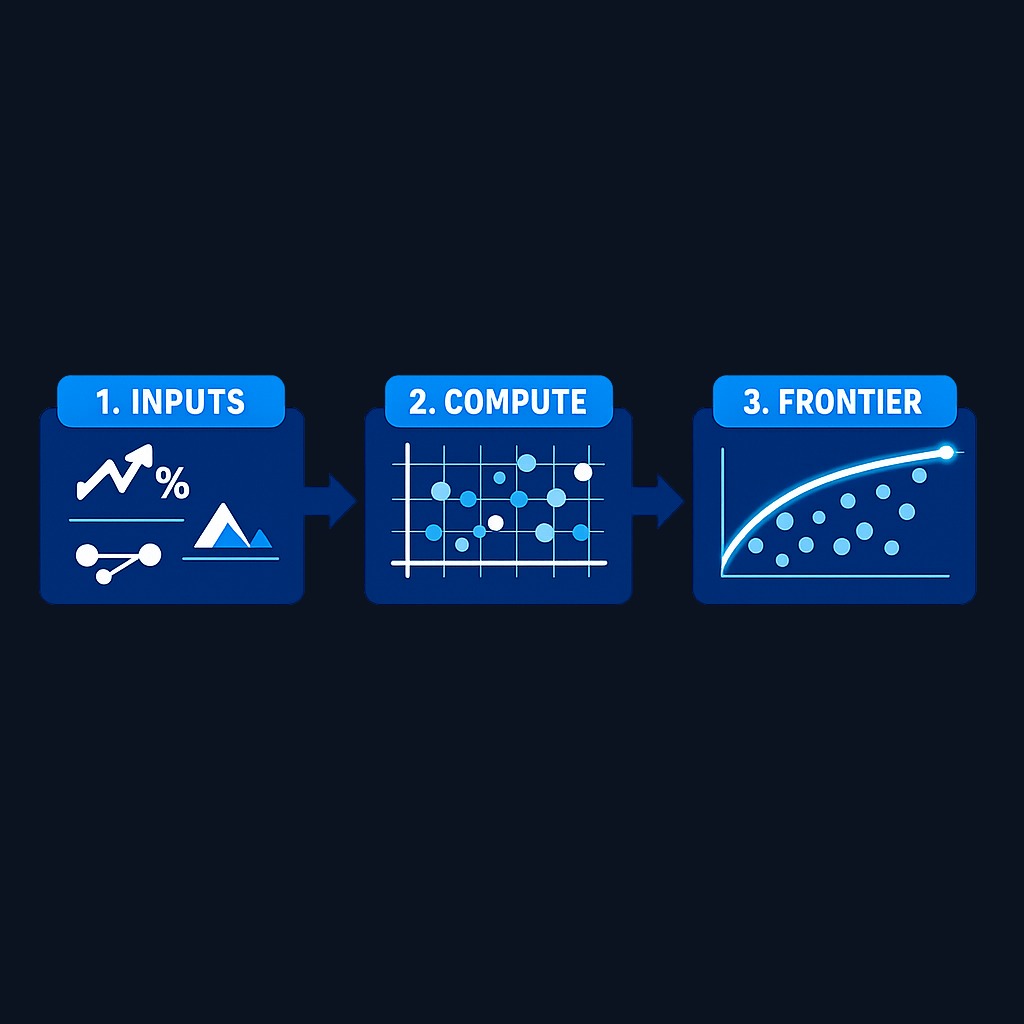
- Estimate the inputs. Compute each asset's average return and standard deviation, plus the correlation between each pair.
- Generate portfolio combinations. Vary the weights of each asset in small steps, calculating expected return and volatility for every mix.
- Plot and trace the edge. Chart every combination and mark the upper-left boundary. That boundary is your efficient frontier.
- Stress-test the result. Shift your estimates slightly and watch how much the frontier moves. Large swings from small input changes are a warning about overconfidence.
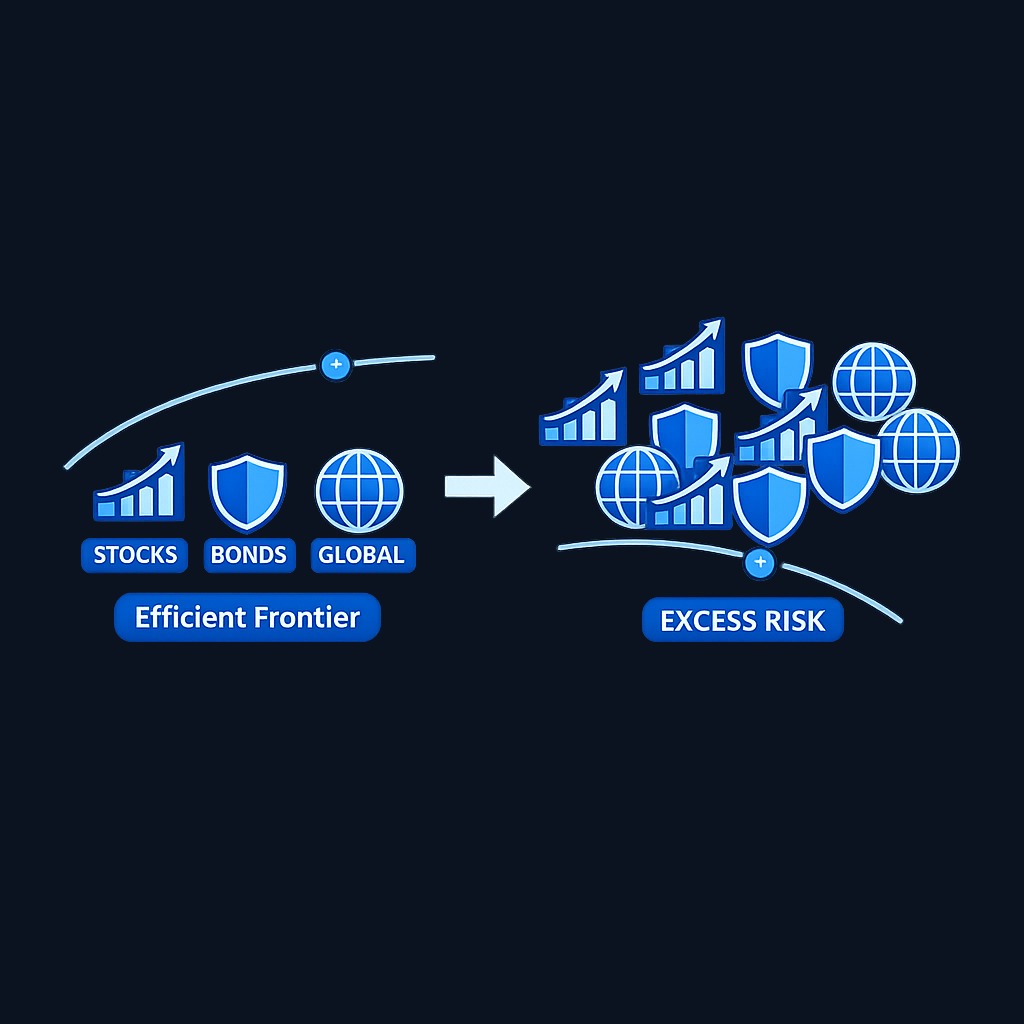
The exercise teaches more than the output. Most people discover that a handful of broad, low-correlation funds gets them close to the efficient edge, while piling on similar assets adds risk without adding return.
Limitations and criticisms of the efficient frontier
The model is elegant, but its assumptions deserve skepticism:
- Inputs are estimates. Expected returns and correlations are drawn from the past, and the future routinely disagrees with the past.
- Correlations shift in a crisis. Assets that looked independent can fall together during market stress, exactly when diversification matters most.
- Risk is more than volatility. Standard deviation treats upside and downside swings the same, while real investors care mostly about losses.
- Markets are not always calm. Return distributions have fat tails, meaning extreme moves happen more often than the standard model predicts.
- Costs and taxes are ignored. Rebalancing toward the frontier triggers trading costs and potentially taxable events that the chart never shows.
None of this makes the frontier useless. It makes it a map drawn from old survey data: directionally helpful, precisely wrong.
Practice investing with Finelo
Build practical investing skills with guided lessons, simulator practice, and structured challenges.
What to know before deciding
Before you reorganize a portfolio around an efficient frontier analysis, keep these points in view. First, the frontier you compute is only as current as its inputs, so refresh estimates periodically rather than treating one chart as permanent truth. Second, your personal risk tolerance sets which point on the frontier fits you; the math ranks portfolios by efficiency, not by how well you will sleep. Third, a simple mix you maintain consistently usually beats an optimized mix you abandon in a drawdown. Finally, education platforms and simulators let you test frontier-style thinking with virtual money, which is a cheaper way to learn the model's behavior than live trading.
Decision framework: putting the efficient frontier to work
| Your situation | How to use the frontier |
|---|---|
| New investor with one or two funds | Use the concept, not the math: add a low-correlation asset class before adding more of the same |
| DIY investor with spreadsheet skills | Build a basic frontier from index funds and check whether your current mix sits far below the edge |
| Investor evaluating an advisor or robo tool | Ask how the tool estimates returns and correlations, and how often it re-optimizes |
| Trader focused on short-term moves | Treat the frontier as background; it is a long-horizon allocation tool, not a timing signal |
A sensible default process: define your risk level first, diversify across asset classes second, and only then fine-tune weights with frontier-style analysis. Used in that order, the model informs the decision instead of dictating it.
FAQ
What is the efficient frontier in simple terms?
It is the line on a risk-versus-return chart showing the best portfolios you can build from a set of assets. Each point on the line gives the most expected return available for that amount of risk.
How is the efficient frontier calculated?
By estimating each asset's expected return, volatility, and correlation with every other asset, then computing risk and return for many weight combinations. The combinations with the highest return at each risk level form the frontier.
Who actually uses the efficient frontier?
Portfolio managers, robo-advisors, and financial planners use frontier-style optimization when setting asset allocations. Individual investors use it more loosely, as a reason to hold diversified, low-correlation assets rather than concentrated bets.
What is the main weakness of the efficient frontier?
It depends on estimated inputs. Small errors in expected returns or correlations can move the "optimal" portfolio a lot, and correlations tend to rise during market crashes, weakening the diversification the model promises.
Conclusion and next steps
The efficient frontier gives you a disciplined way to think about the trade-off every portfolio makes between risk and return. Use it to check whether your asset mix earns enough expected return for the volatility you accept, respect its limits, and revisit the analysis as markets and your goals change. A practical next step is to rehearse these allocation decisions in a learning environment: the Finelo app teaches portfolio concepts like diversification and risk-return trade-offs through short interactive lessons, so you can build the intuition before committing real capital.
InvestingFundamental AnalysisBeginner
Practice investing with Finelo
Build practical investing skills with guided lessons, simulator practice, and structured challenges.
About the author
Finelo Team
The Finelo Team creates practical investing and trading education designed to help beginners learn faster with structured challenges, simulator practice, and bite-sized lessons.
Keep reading — Related articles

Investing
Tax-gain harvesting vs. tax-loss harvesting
Compare realizing investment gains with realizing losses, including holding periods, wash sales, offsets, and portfolio tradeoffs.
Finelo Team

Investing
Stable value fund vs. money market fund
Compare investment structure, contract protections, transfer restrictions, net yields, and access inside a retirement account.
Finelo Team

Investing
Single-life vs. joint-life annuity
Compare income for one lifetime with continued payments to a survivor, using equal premiums and matching guarantee terms.
Finelo Team


