Methodology note: DSO ideally uses average trade receivables divided by net credit sales per day. Because net credit sales are often not disclosed, total revenue is a proxy and should be labeled as such. Use average receivables from consistent period dates, account for seasonality, and compare with stated terms, close peers, and the company's own history rather than universal thresholds.
Understanding Days Sales Outstanding (DSO)

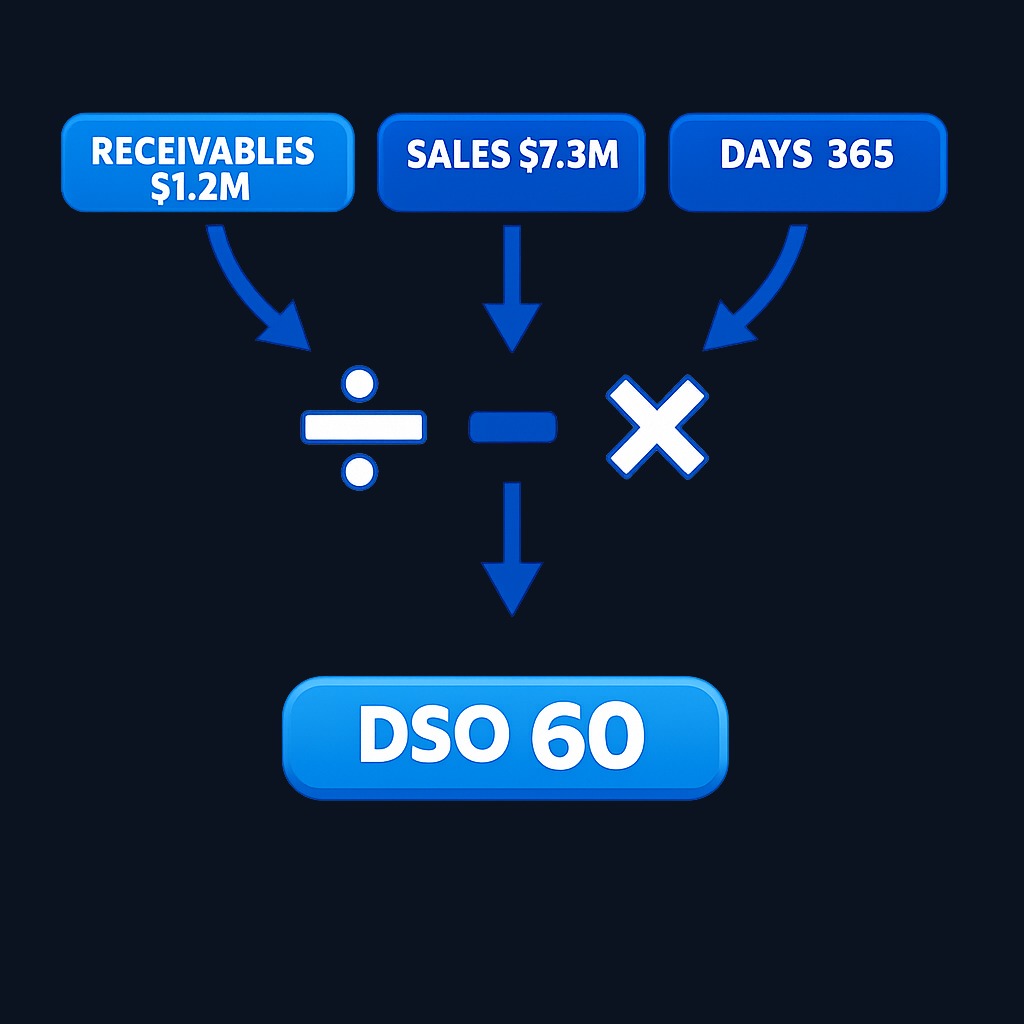
Days sales outstanding (DSO) measures how many days, on average, a company takes to collect cash after making a credit sale: (accounts receivable ÷ total credit sales) × number of days in the period. A company with $1.2…
8 min read
Practice investing with Finelo
Build practical investing skills with guided lessons, simulator practice, and structured challenges.
Want to learn more?
Build practical investing skills with guided lessons, simulator practice, and structured challenges.
Explore FineloExplore Finelo's 28-day challenges
Turn learning into a daily habit with guided challenge paths.
Days sales outstanding (DSO) measures how many days, on average, a company takes to collect cash after making a credit sale: (accounts receivable ÷ total credit sales) × number of days in the period. A company with $1.2 million in receivables and $7.3 million of credit sales over a 365-day year has a DSO of 60 days. Lower is generally better, because cash collected sooner funds operations without borrowing. This page is for investing students, analysts, and business owners who want to read collection efficiency from real financial statements. You will get the formula, benchmarks, a worked trend example, and a decision framework, plus guided practice on real filings through the Finelo app.
What is days sales outstanding (DSO)?
When a business sells on credit, revenue is booked immediately but the cash arrives later, sitting in accounts receivable until customers pay. Days sales outstanding converts that receivable balance into time: the average number of days between invoicing a customer and receiving the money. It is one of the three working-capital dials analysts watch, alongside inventory days and payable days, and it feeds directly into the cash conversion cycle. DSO matters because revenue is an opinion until it is collected. A company can report impressive sales growth while its cash languishes in overdue invoices, and DSO is the ratio that exposes the gap.
How to calculate days sales outstanding
DSO = (Accounts receivable ÷ Credit sales) × Days in period
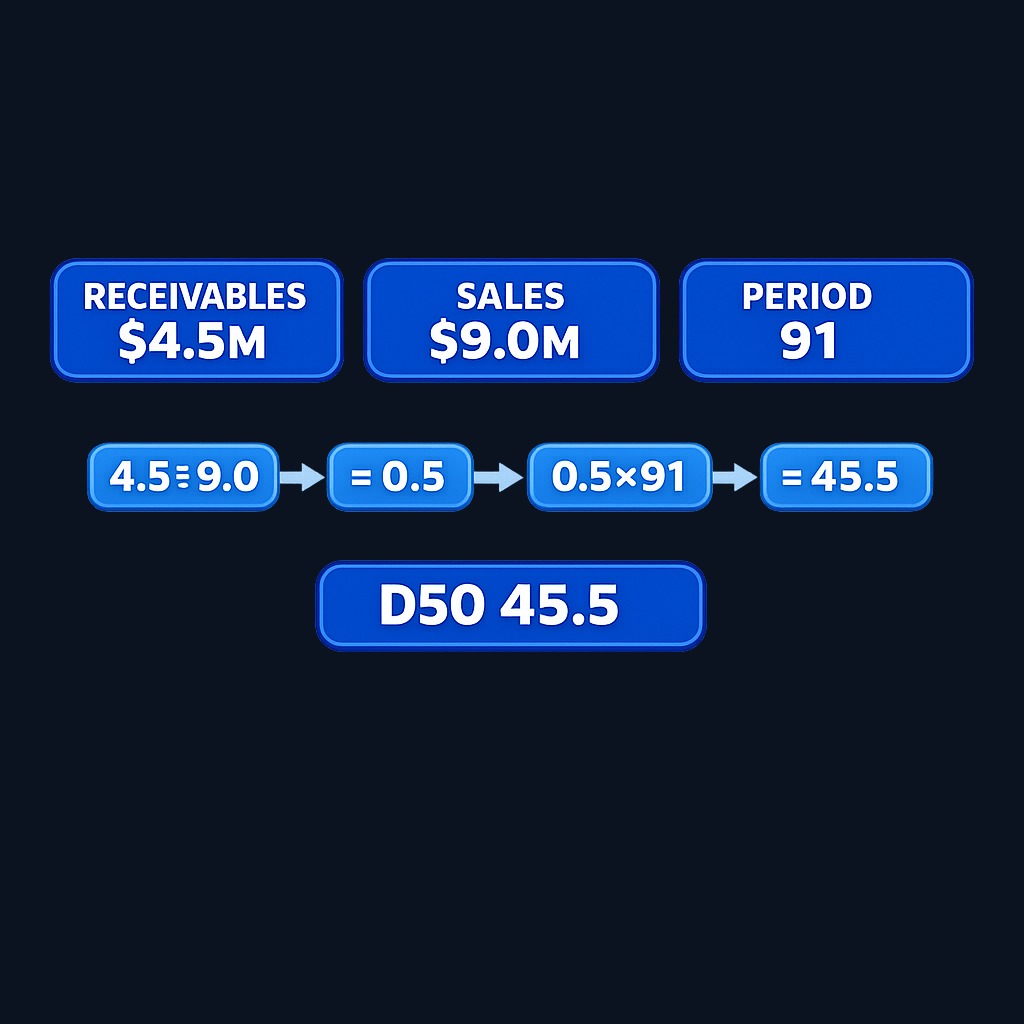
Worked example for a quarter: Meridian Software ends Q2 with $4.5 million of accounts receivable and booked $9.0 million of credit sales over the 91-day quarter. DSO = (4.5 ÷ 9.0) × 91 = 45.5 days. On average, each invoice waits about six and a half weeks before turning into cash.
Two practical notes. First, use credit sales if disclosed; many public companies report only total revenue, so analysts approximate with it, which understates DSO for businesses with heavy cash sales. Second, receivables and revenue figures come straight from the balance sheet and income statement, which for US-listed companies are freely available through the SEC's EDGAR database. Some analysts average beginning and ending receivables to smooth seasonal spikes.
Why monitoring DSO matters
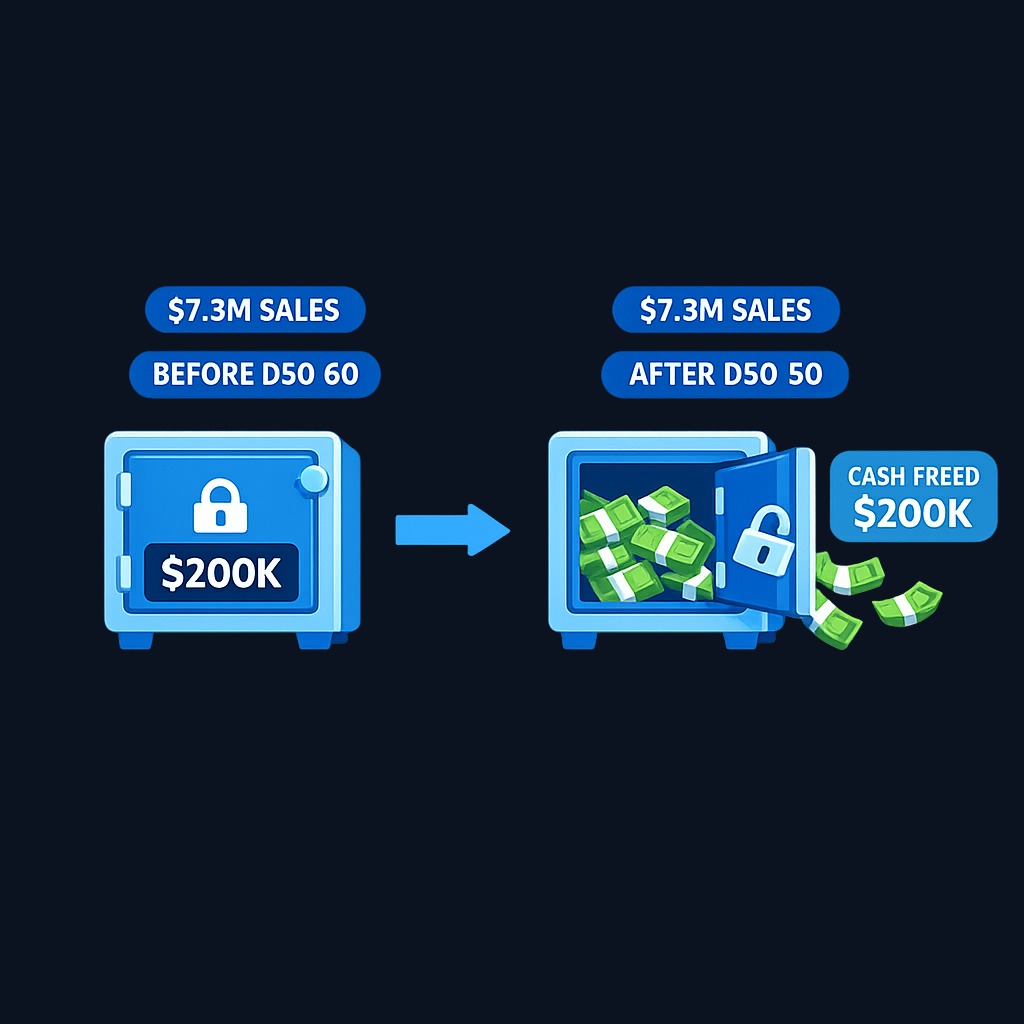
- Cash flow timing. Every day of DSO is roughly a day of revenue trapped on the balance sheet. Cutting DSO from 60 to 50 days at $7.3 million of annual credit sales frees about $200,000 of cash permanently, with no new sales at all.
- Credit quality signal. A rising DSO often means customers are struggling to pay or that the company loosened credit terms to buy growth, both early warnings for investors.
- Earnings quality check. When receivables grow much faster than revenue, reported earnings are outrunning cash collection, a classic red flag in fundamental analysis.
- Financing costs. Slow collection forces companies to bridge the gap with credit lines, so high DSO quietly converts into interest expense.
What counts as a good DSO?
Payment terms and revenue mix differ across companies, so there is no reliable 30–45, 60–75, or “one-third above terms” rule. Compare a consistently calculated DSO with contract terms, the same seasonal period in prior years, close peers, aging schedules if available, write-offs, and allowance changes.
Factors that influence DSO
Payment terms are the anchor: longer terms mean structurally higher DSO regardless of discipline. Customer mix matters, since large enterprise buyers routinely stretch payments while small customers pay faster. Billing quality is underrated: invoice errors and slow invoicing add days before the clock even starts. Seasonality inflates quarter-end receivables in businesses that back-load sales. Economic stress lengthens payment behavior across entire industries at once. Finally, incentives shape everything: sales teams paid on bookings alone tend to sell to slow payers, while collection teams with clear escalation paths pull the number back down.
Worked example: reading a DSO trend
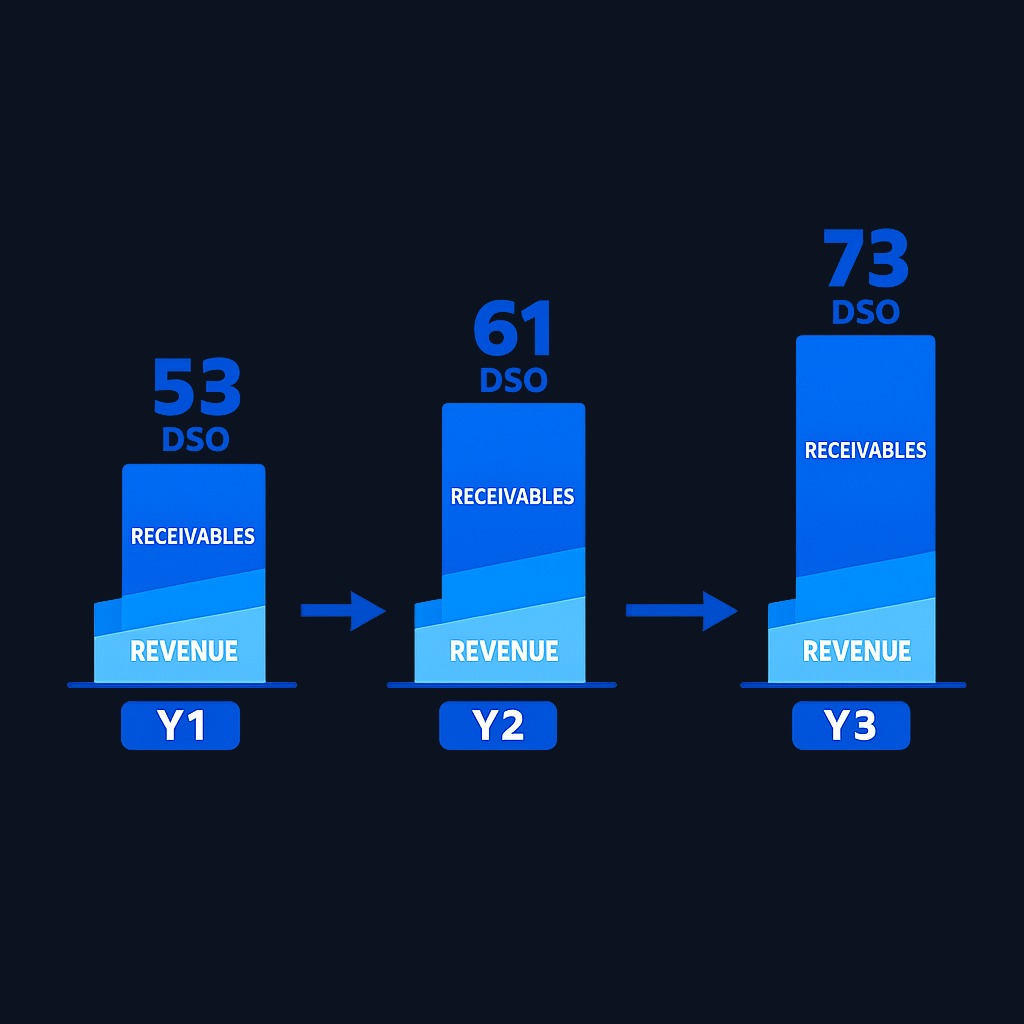
Pull three years of figures for Meridian Industrial:
| Year | Revenue | Receivables | DSO |
|---|---|---|---|
| Year 1 | $20.0M | $2.5M | 45.6 days |
| Year 2 | $24.0M | $3.4M | 51.7 days |
| Year 3 | $28.8M | $5.2M | 65.9 days |
Revenue grew 20% both years, an apparently healthy story. But receivables grew 36% and then 53%, and DSO climbed twenty days. Interpretation: an increasing share of each year's sales exists only on paper. Perhaps management extended terms to hit targets, or a big customer is quietly failing to pay. Either way, cash conversion is deteriorating while the income statement smiles, and the balance sheet is where the truth surfaced first. This is exactly the kind of divergence that separates earnings quality analysis from headline reading.
Practice investing with Finelo
Build practical investing skills with guided lessons, simulator practice, and structured challenges.
Strategies companies use to improve DSO
Firms attack DSO at every stage of the invoice lifecycle: tightening credit checks before extending terms, invoicing immediately and accurately, offering small early-payment discounts, accepting faster payment methods, automating reminders before due dates, and escalating consistently on overdue accounts. Structural fixes include renegotiating terms with chronically slow payers and, where economics justify it, factoring receivables to convert them to cash at a discount. For investors, the interesting question is durability: process-driven improvements persist, while one-time quarter-end collection pushes reverse the next period.
DSO and the cash conversion cycle
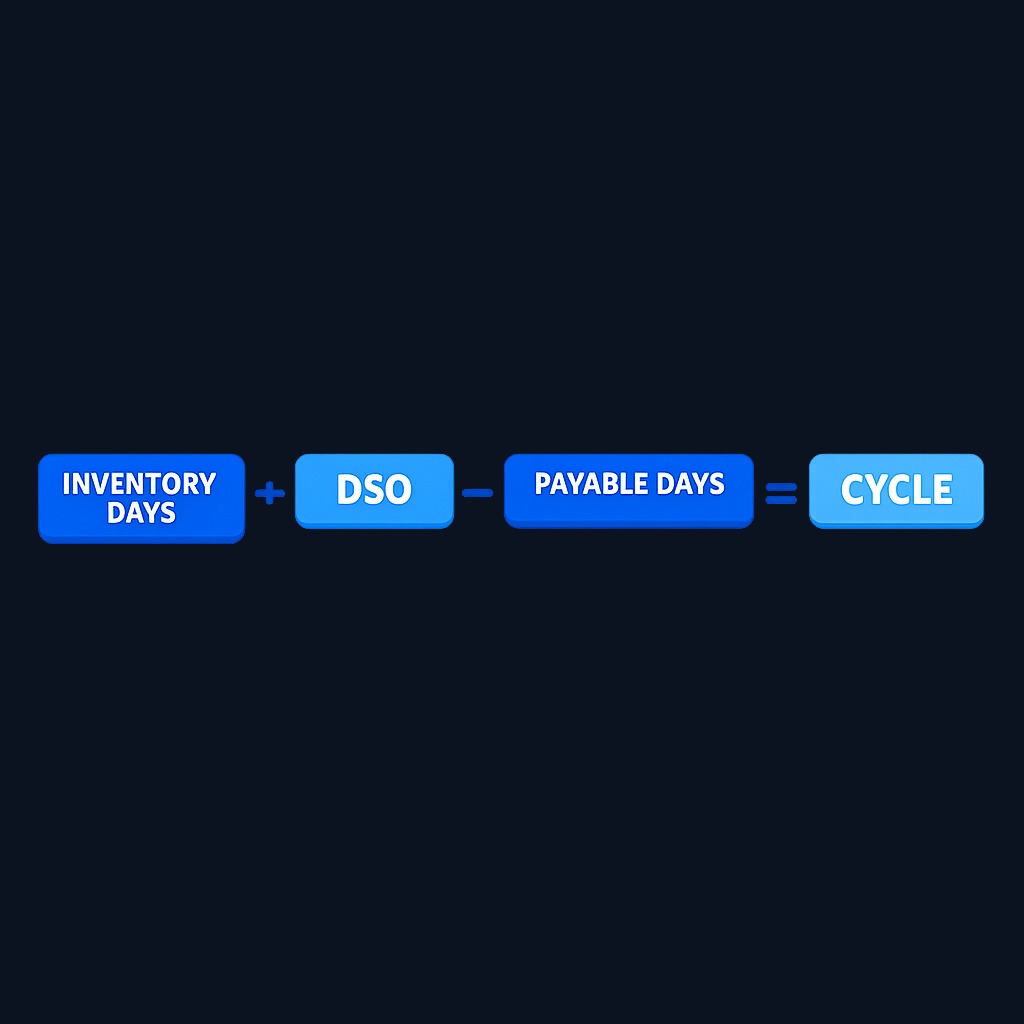
DSO is one leg of the cash conversion cycle: days inventory outstanding plus DSO minus days payables outstanding. The full cycle measures how long a dollar stays trapped in operations between paying suppliers and collecting from customers. A company can offset slow collections with slower supplier payments, or squander fast collections by hoarding inventory. Reading DSO inside the full cycle prevents crediting or blaming one dial for the whole machine, and pairs naturally with liquidity checks on the balance sheet, from the current ratio to available liquidity lines.
What to know before deciding
DSO has sharp edges worth respecting.
Using total revenue overstates precision
If cash sales are significant and undisclosed, a total-revenue DSO runs artificially low. Compare companies on a like-for-like basis and note the approximation.
Quarter-end snapshots mislead
A single balance-sheet date can catch an unusually high or low receivable balance. Averaging periods, or tracking the trend across many quarters, beats any single reading.
Low is not always good
An aggressively low DSO can mean credit terms so tight they repel customers, or heavy reliance on discounts that quietly erode margins. Judge DSO alongside revenue growth and gross margin, not in isolation.
Decision framework: using DSO in analysis
- Compute DSO for at least eight quarters. Trends carry the signal; single readings carry noise.
- Compare receivables growth with revenue growth. Receivables persistently outgrowing sales is the clearest earnings-quality warning DSO offers.
- Benchmark against direct peers and stated terms. Sixty days is fine on net-60 terms and alarming on net-30.
- Check the cash conversion cycle. Confirm whether a DSO move is offset or amplified by inventory and payables.
- Read the footnotes. Allowances for doubtful accounts and concentration disclosures reveal whether slow payers are becoming non-payers.
FAQ
What is a good days sales outstanding number?
There is no universal target. Compare DSO with the issuer's stated terms, customer mix, seasonality, direct peers, aging data, and its own trend using the same sales proxy and averaging method.
What does a high DSO indicate?
Customers are taking longer to pay. Causes range from loosened credit terms and billing problems to deteriorating customer finances. For investors, a rising DSO alongside fast revenue growth is a warning that reported sales may be outrunning real cash collection.
How is DSO different from accounts receivable turnover?
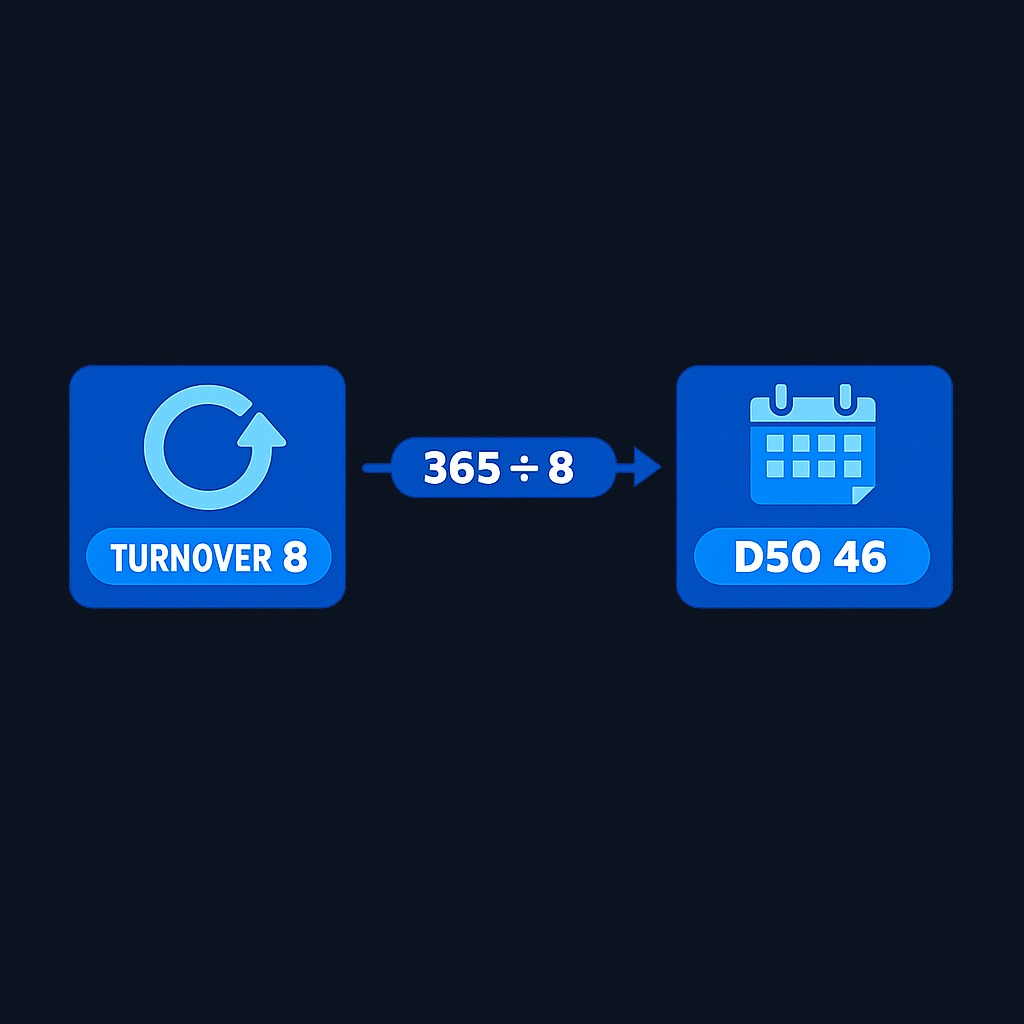
They express the same relationship in different units. Receivable turnover counts how many times per year receivables convert to cash; DSO converts that into days, as 365 divided by the turnover ratio. A turnover of 8 equals a DSO of about 46 days.
Can DSO be too low?
Yes. Extremely tight credit terms can drive customers to competitors, and heavy early-payment discounts trade margin for speed. The goal is collection efficiency that supports growth, not the lowest possible number.
Conclusion and next steps
Days sales outstanding turns a static receivable balance into the metric that matters: how long revenue takes to become cash. Track its trend, compare it with revenue growth, benchmark it against terms and peers, and read it inside the full cash conversion cycle. Do that consistently and you will spot deteriorating earnings quality quarters before it reaches the headlines. Make it concrete now: pick one company you follow, pull two years of statements from EDGAR, and build the three-line DSO table from the example above.
InvestingFundamental AnalysisFinancial StatementsBeginner
Practice investing with Finelo
Build practical investing skills with guided lessons, simulator practice, and structured challenges.
About the author
Finelo Team
The Finelo Team creates practical investing and trading education designed to help beginners learn faster with structured challenges, simulator practice, and bite-sized lessons.
Keep reading — Related articles

Investing
Tax-gain harvesting vs. tax-loss harvesting
Compare realizing investment gains with realizing losses, including holding periods, wash sales, offsets, and portfolio tradeoffs.
Finelo Team

Investing
Stable value fund vs. money market fund
Compare investment structure, contract protections, transfer restrictions, net yields, and access inside a retirement account.
Finelo Team

Investing
Single-life vs. joint-life annuity
Compare income for one lifetime with continued payments to a survivor, using equal premiums and matching guarantee terms.
Finelo Team


