Methodology note: CCC = DSO + days inventory outstanding − days payables outstanding. DSO ideally uses credit sales; DPO ideally uses purchases. Revenue and COGS are common proxies when the preferred inputs are unavailable and must be labeled. Average balance-sheet amounts should match the flow period. A negative CCC can reflect favorable customer/supplier timing, but it is not automatically healthy if it comes from distress, delayed payments, shrinking inventory, or unsustainable terms. CFA Institute provides a worked cash-conversion-cycle methodology.
Understanding the Cash Conversion Cycle: Importance and Strategies
The cash conversion cycle (CCC) measures how many days a company takes to turn the cash it spends on inventory back into cash from sales. The formula is simple: days inventory outstanding plus days sales outstanding…
9 min read
Practice investing with Finelo
Build practical investing skills with guided lessons, simulator practice, and structured challenges.
Want to learn more?
Build practical investing skills with guided lessons, simulator practice, and structured challenges.
Explore FineloExplore Finelo's 28-day challenges
Turn learning into a daily habit with guided challenge paths.
The cash conversion cycle (CCC) measures how many days a company takes to turn the cash it spends on inventory back into cash from sales. The formula is simple: days inventory outstanding plus days sales outstanding minus days payables outstanding. A shorter cycle means cash comes back faster; a negative cycle means the company collects from customers before it pays suppliers. This page is for investors and students learning fundamental analysis who want to read working-capital efficiency from real financial statements. Read the definition and calculation below, then practice spotting strong and weak cycles in the guided lessons inside the Finelo app.
What is the cash conversion cycle?
The cash conversion cycle is a working-capital metric. It tracks the time between paying for inventory and collecting cash from the sale of that inventory. Analysts express it in days.
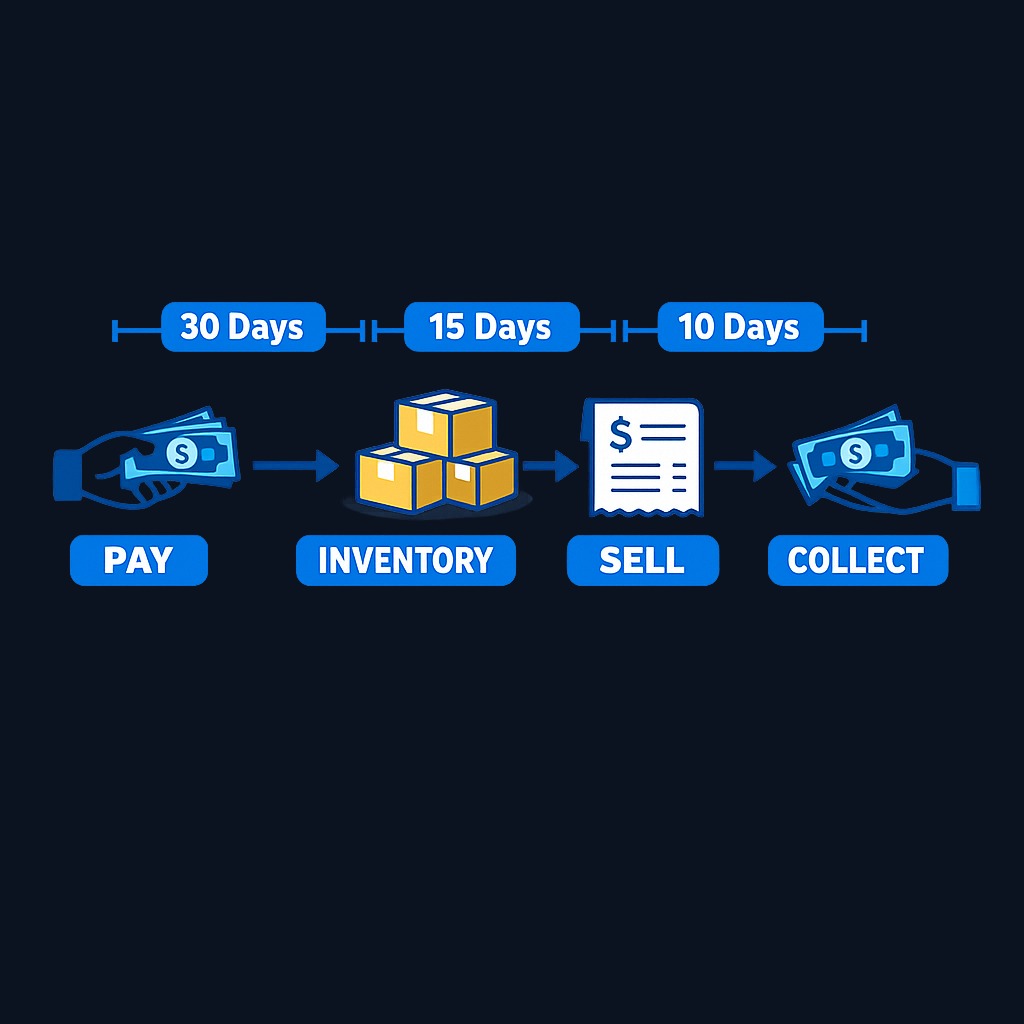
The cycle has three components, and each one describes a different account on the balance sheet:
- Days inventory outstanding (DIO). How long inventory sits before the company can sell it. It starts with the purchase of raw materials or stock and ends at the sale.
- Days sales outstanding (DSO). How long customers take to pay after a sale. Companies that sell on credit accumulate accounts receivable, and DSO measures how slowly that receivable turns into cash.
- Days payables outstanding (DPO). How long the company takes to pay its own suppliers. A higher DPO means the business holds onto its cash longer.
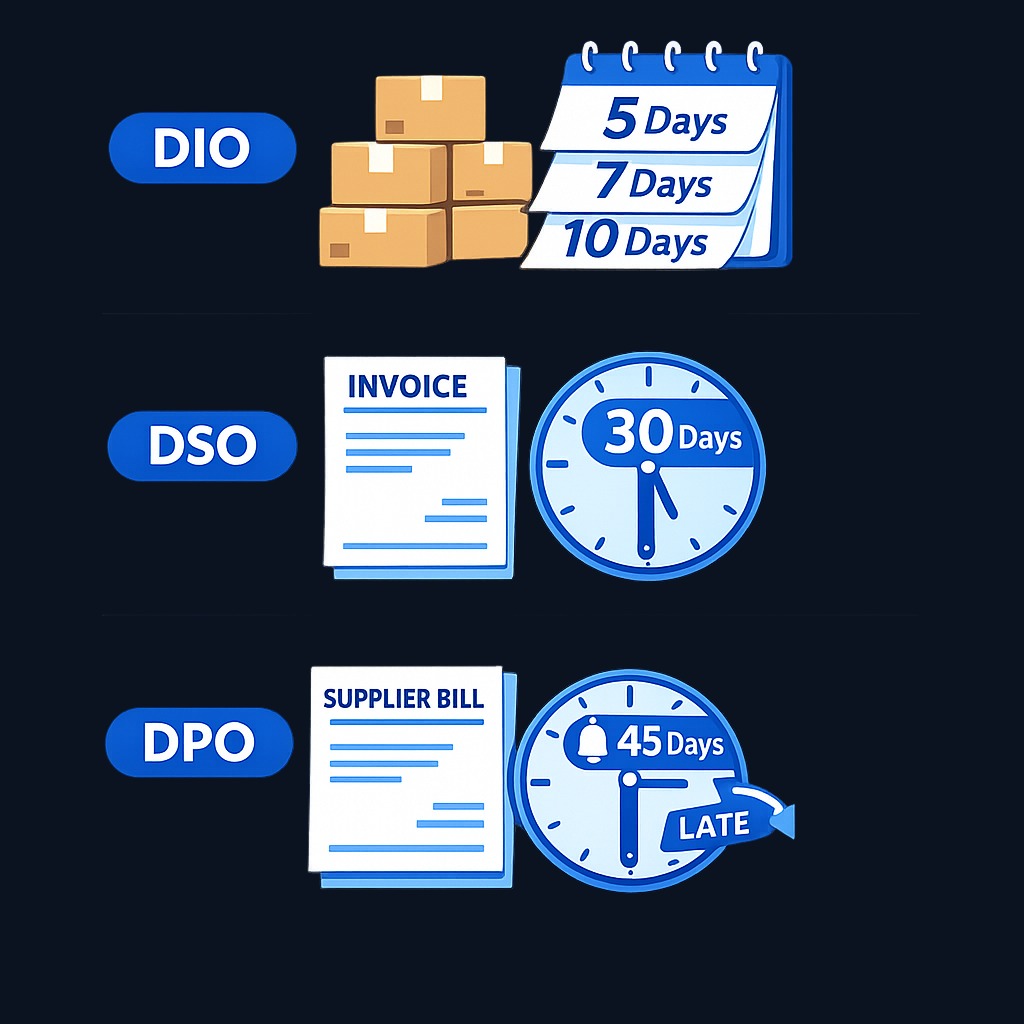
Put together, the cycle shows how much time cash spends locked up in operations. A company that sells inventory quickly, collects fast, and pays suppliers slowly keeps cash free for other uses. A company that stockpiles inventory and waits months for payment ties up cash it may need elsewhere.
Why is the cash conversion cycle important?
The CCC matters because a company can report healthy profit and still run out of cash. Net income counts a credit sale as revenue the day it happens. The cash from that sale may arrive sixty days later. In the gap, the company still has to pay employees, rent, and suppliers.
A shorter cycle generally signals operational efficiency. It suggests the business manages inventory well, collects from customers on time, and negotiates sensible payment terms. A lengthening cycle can be an early warning sign. Rising DIO may mean products are not selling. Rising DSO may mean customers are struggling to pay or the company loosened credit terms to chase growth.
For investors, the CCC also reveals bargaining power. Some large retailers run a negative cycle: they sell goods to shoppers for cash before their supplier invoices come due. In effect, suppliers finance the company's operations. That position is hard for smaller competitors to copy and often reflects durable scale advantages.
Comparing the cycle across companies in the same industry helps separate well-run operators from weaker ones. Comparing it across different industries is less useful, because business models differ so much.
How to calculate the cash conversion cycle
The formula is:
CCC = DIO + DSO − DPO
Each component comes from figures on the income statement and balance sheet.
| Component | Formula | What it uses |
|---|---|---|
| DIO | (Average inventory ÷ Cost of goods sold) × 365 | Inventory and COGS |
| DSO | (Average accounts receivable ÷ Revenue) × 365 | Receivables and sales |
| DPO | (Average accounts payable ÷ Cost of goods sold) × 365 | Payables and COGS |
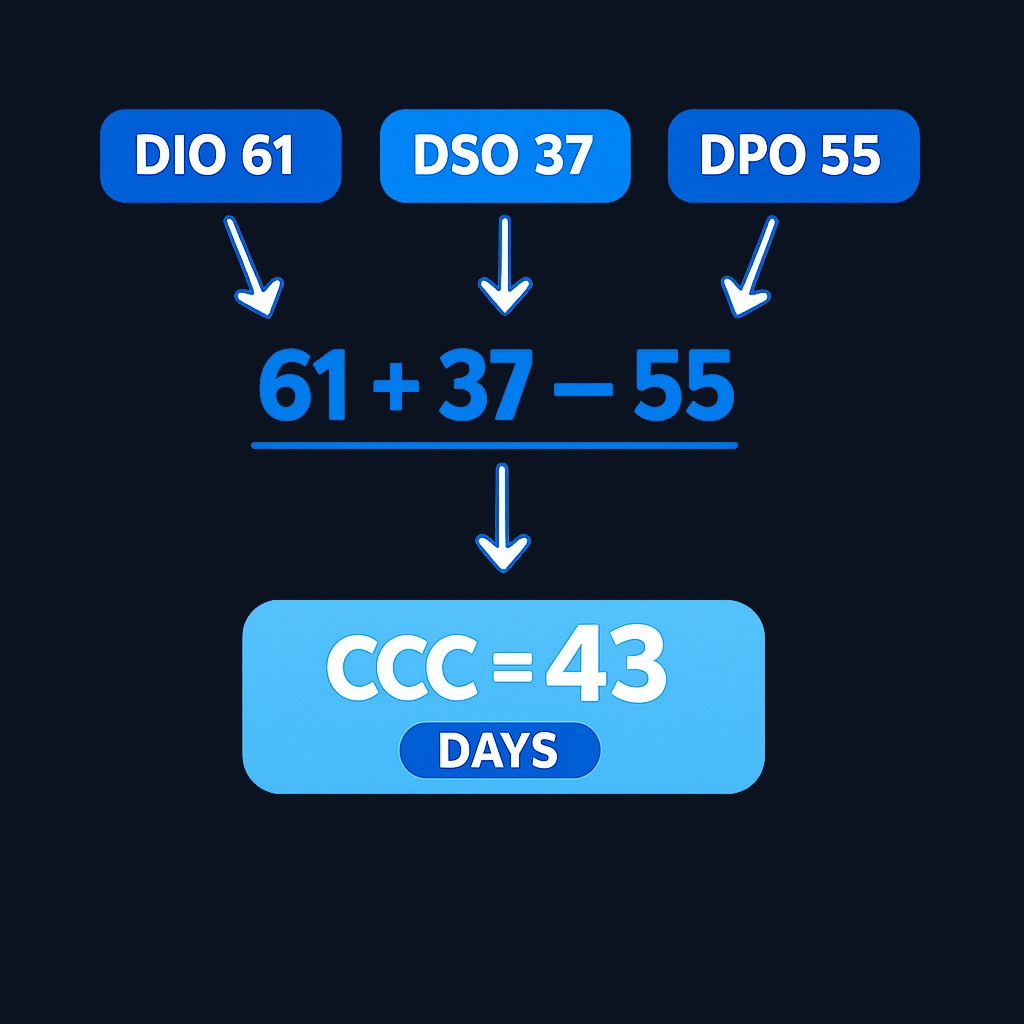
A worked example makes the arithmetic concrete. Suppose a company holds average inventory of $500,000 against annual cost of goods sold of $3,000,000. DIO is about 61 days. Average receivables of $400,000 against revenue of $4,000,000 give a DSO of about 37 days. Average payables of $450,000 against the same COGS give a DPO of about 55 days. The cash conversion cycle is 61 + 37 − 55, or roughly 43 days. Cash spends about six weeks tied up in operations per cycle.
You can pull the inputs for any US public company from its annual and quarterly reports. The SEC's EDGAR database provides these filings for free, and the balance sheet and income statement contain every number the formula needs. Use average balances (beginning plus ending, divided by two) to smooth out seasonal swings.
Factors that affect the cycle, and how industries differ
Several factors move the three components:
- Business model. Subscription software firms carry little or no physical inventory, so DIO barely applies. Manufacturers and retailers live and die by it.
- Credit policy. Selling to consumers for cash keeps DSO near zero. Selling to business customers on 30, 60, or 90-day terms stretches it.
- Supplier bargaining power. Big buyers can negotiate long payment terms, raising DPO. Small companies often must pay quickly.
- Seasonality. Retailers build inventory ahead of peak season, which temporarily inflates DIO.
- Demand shifts. Slowing sales show up as swelling inventory days before they show up in reported revenue declines.
Because of these differences, benchmarks only make sense within an industry. Grocery chains typically run short cycles, since food sells fast and shoppers pay at the register. Heavy-equipment makers run long cycles, since machines take months to build and business buyers pay on invoice. The practical rule: compare a company's cycle to its own history and to direct competitors, not to an economy-wide average.
Practice investing with Finelo
Build practical investing skills with guided lessons, simulator practice, and structured challenges.
Strategies companies use to optimize the cycle
Management teams work all three levers:
Reducing inventory days
Better demand forecasting, just-in-time ordering, and discounting slow-moving stock all shorten DIO. The trade-off is stockout risk: cut inventory too hard and the company loses sales when demand spikes.
Collecting receivables faster
Companies tighten credit checks, invoice promptly, offer small early-payment discounts, and automate collection reminders. Factoring receivables converts them to cash immediately, at a cost.
Extending payables carefully
Negotiating longer supplier terms raises DPO and frees cash. Pushed too far, it strains supplier relationships and can cost the company early-payment discounts worth more than the float.
Common pitfalls to avoid
Optimizing one component in isolation can damage the others. Slashing inventory may hurt product availability. Aggressive collections can drive customers to competitors. Stretching payables can prompt suppliers to raise prices or demand cash up front. Strong operators treat the cycle as a system, not three separate numbers.
What to know before deciding
Before you use the cash conversion cycle in an investment decision, keep its limits in view. The metric is backward-looking: it summarizes the last reporting period, not the next one. It can be distorted by one-off events, such as a bulk inventory purchase ahead of a price increase. A single quarter's spike is a question to investigate, not a verdict. Some companies also time payments around reporting dates to flatter the number. Finally, a negative cycle is powerful but not automatically good; it depends on sustainable supplier terms rather than financial distress being pushed down the chain. Always read the cycle alongside margins, cash flow from operations, and debt levels.
Decision framework: how to use the ccc in your analysis
A simple sequence keeps the metric useful:
- Compute three years of history. One number tells you little; the trend tells you a lot.
- Compare against two or three direct competitors. Use the same fiscal periods for a fair match.
- Investigate divergence. If the company's cycle lengthens while competitors hold steady, dig into which component moved and why.
- Check the cash flow statement. Confirm that reported profits actually convert into operating cash.
- Weigh it in context. Treat the CCC as one input beside valuation, growth, and balance-sheet strength, never a standalone buy or sell signal.
Investors who take time to practice this workflow on real companies build intuition quickly, and simulated exercises make the learning safe.
FAQ
What is a good cash conversion cycle?
Lower is not automatically better. A negative or falling CCC can reflect bargaining power, but it can also reflect delayed supplier payments, inventory shortages, revenue contraction, or timing effects. Compare the components and business context, not only the total.
Can the cash conversion cycle be negative?
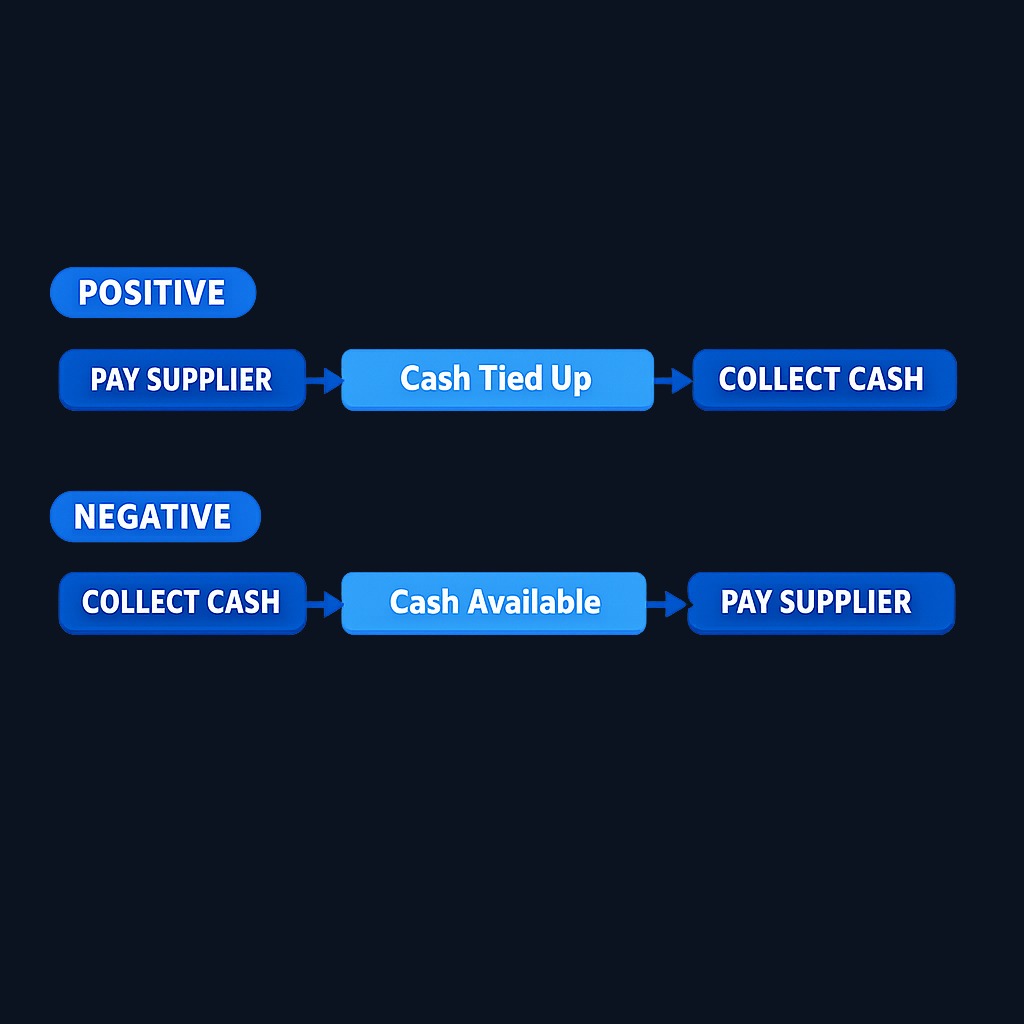
Yes. A negative cycle means the company collects cash from customers before paying its suppliers. Some large cash-and-carry retailers and marketplaces operate this way, effectively using supplier financing to fund operations.
How often should I check a company's cash conversion cycle?
Quarterly and annual reports are the natural checkpoints, since they refresh every input in the formula. Watching the year-over-year trend matters more than reacting to any single quarter.
Where do I find the numbers to calculate the ccc?
All inputs come from the income statement and balance sheet: inventory, accounts receivable, accounts payable, revenue, and cost of goods sold. For US-listed companies, these filings are available through the SEC's EDGAR system.
Conclusion and next steps
The cash conversion cycle turns three dry balance-sheet accounts into one readable number: how long cash stays trapped inside the business. Learn to compute DIO, DSO, and DPO, track the trend over several years, and compare against close competitors. Used with margins and cash flow, the cycle helps you spot efficient operators and flag deteriorating ones before the income statement admits it. If you want structured practice, Finelo's bite-sized lessons and simulations walk you through real-statement analysis step by step.
InvestingFundamental AnalysisFinancial StatementsBeginner
Practice investing with Finelo
Build practical investing skills with guided lessons, simulator practice, and structured challenges.
About the author
Finelo Team
The Finelo Team creates practical investing and trading education designed to help beginners learn faster with structured challenges, simulator practice, and bite-sized lessons.
Keep reading — Related articles

Investing
Tax-gain harvesting vs. tax-loss harvesting
Compare realizing investment gains with realizing losses, including holding periods, wash sales, offsets, and portfolio tradeoffs.
Finelo Team

Investing
Stable value fund vs. money market fund
Compare investment structure, contract protections, transfer restrictions, net yields, and access inside a retirement account.
Finelo Team

Investing
Single-life vs. joint-life annuity
Compare income for one lifetime with continued payments to a survivor, using equal premiums and matching guarantee terms.
Finelo Team


