The debt-to-equity ratio compares a company's interest-bearing debt with shareholders' equity. A ratio of 1.0 means one dollar of debt for each dollar of book equity. Some data providers instead show total liabilities divided by equity; that broader measure is better labeled liabilities-to-equity, and it can produce a very different result. This page is for investors learning to read balance sheets and compare financial risk.
Understanding the Debt to Equity Ratio: Formula, Meaning, and Use
The debt-to-equity ratio compares a company's interest-bearing debt with shareholders' equity. A ratio of 1.0 means one dollar of debt for each dollar of book equity. Some data providers instead show total liabilities…
7 min read
Practice investing with Finelo
Build practical investing skills with guided lessons, simulator practice, and structured challenges.
Want to learn more?
Build practical investing skills with guided lessons, simulator practice, and structured challenges.
Explore FineloExplore Finelo's 28-day challenges
Turn learning into a daily habit with guided challenge paths.
What is the debt to equity ratio?
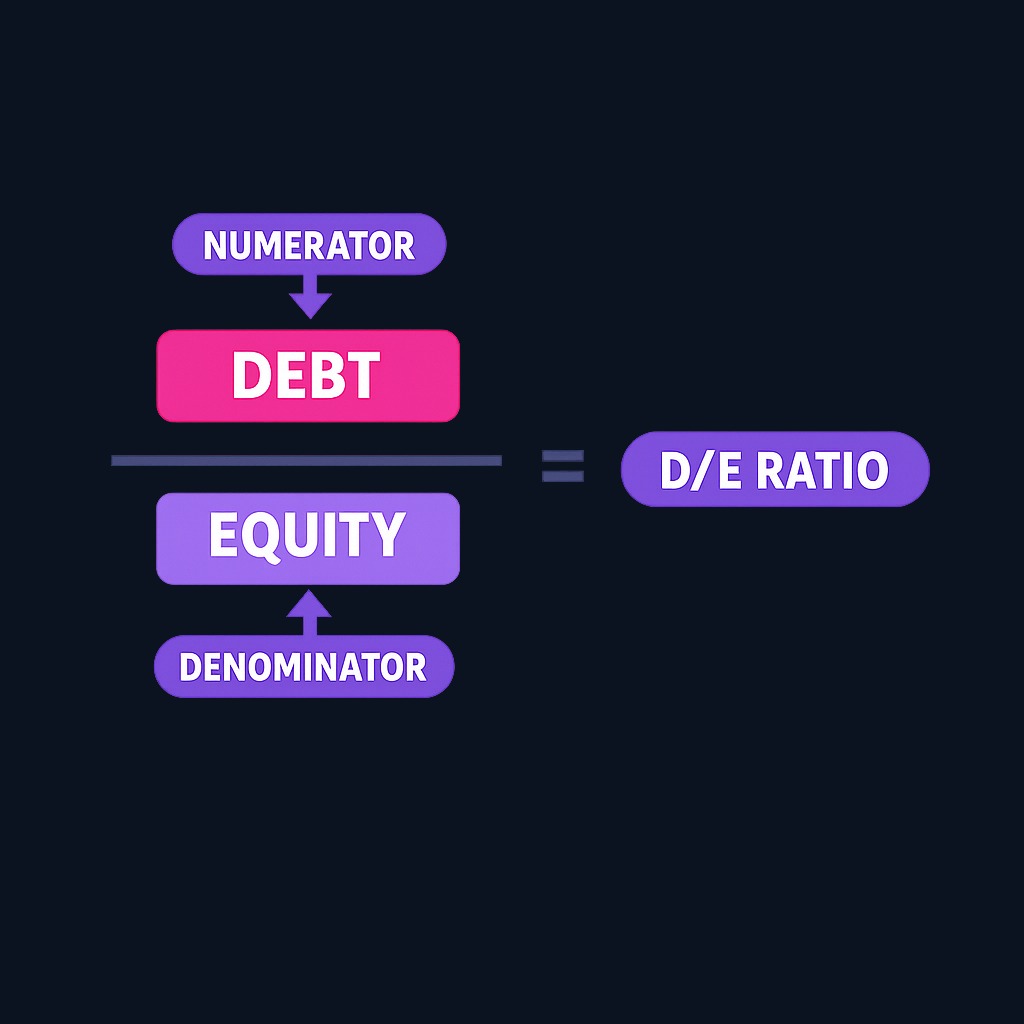
The debt-to-equity ratio (often written D/E) is a leverage metric. In its standard corporate-finance form, the numerator is interest-bearing short- and long-term debt; the denominator is shareholders' equity. Both are balance-sheet amounts.
The ratio answers a risk question rather than a performance question. Debt magnifies outcomes in both directions. A company financed heavily with borrowed money can grow equity returns faster in good times, but the same leverage turns downturns dangerous, because interest and principal payments do not shrink when revenue does.
Some websites use total liabilities in the numerator. That calculation includes operating obligations such as accounts payable and deferred revenue and should not be mixed with debt-only D/E. Always read the provider's definition and use the same numerator across every company and period you compare.
How to calculate the debt to equity ratio
Debt-to-equity ratio = Interest-bearing debt / Shareholders' equity
A worked example:
| Balance sheet item | Value |
|---|---|
| Short-term debt | $400 million |
| Long-term debt | $1,100 million |
| Other liabilities | $250 million |
| Total liabilities | $1,750 million |
| Shareholders' equity | $1,250 million |
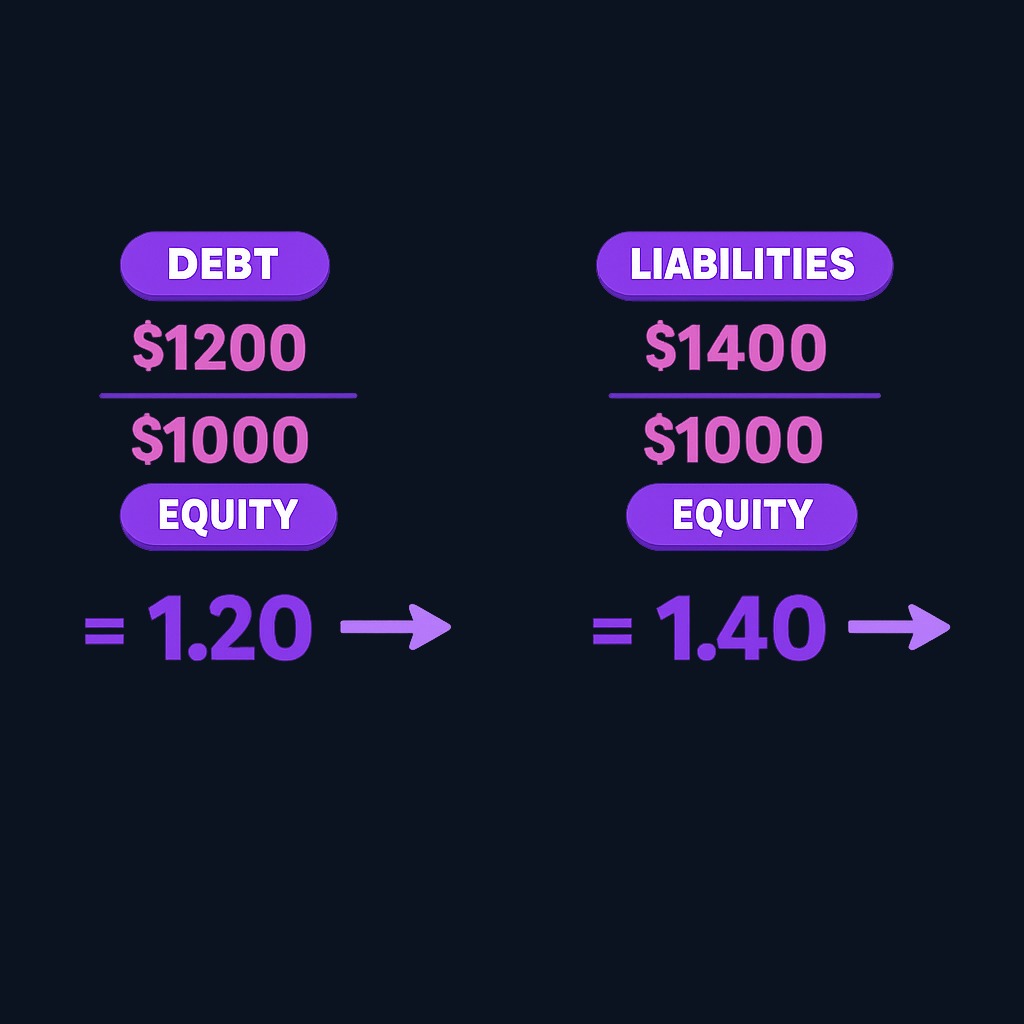
| Debt-to-equity ratio | 1.2 |
| Liabilities-to-equity ratio | 1.4 |
The company carries $1.20 of interest-bearing debt for each $1.00 of equity. Its broader liabilities-to-equity ratio is $1.40. Both inputs come from published financial statements. For U.S.-listed companies you can pull the balance sheet from annual and quarterly reports in the SEC's EDGAR filing system and compute both ratios yourself.
Three calculation notes:
- Use the same reporting date for both numbers; mixing quarters distorts the result.
- Watch for negative equity. Buybacks or accumulated losses can push equity below zero, which makes the ratio meaningless.
- Check whether your data source uses total liabilities or only financial debt, because the two produce very different numbers for the same firm.
Interpreting the debt to equity ratio
There is no universal "good" range. The same D/E can be ordinary for a regulated utility and aggressive for a cyclical or early-stage company. Interpret it against close peers, the company's own history, cash-flow stability, interest coverage, debt maturities, and covenant terms.
Direction matters as much as level. A ratio drifting upward across several years tells a story: the business is funding itself with progressively more debt. Pair the level with interest coverage (operating profit versus interest expense) to judge whether the debt load is comfortable or straining.
Industry standards for debt to equity ratios
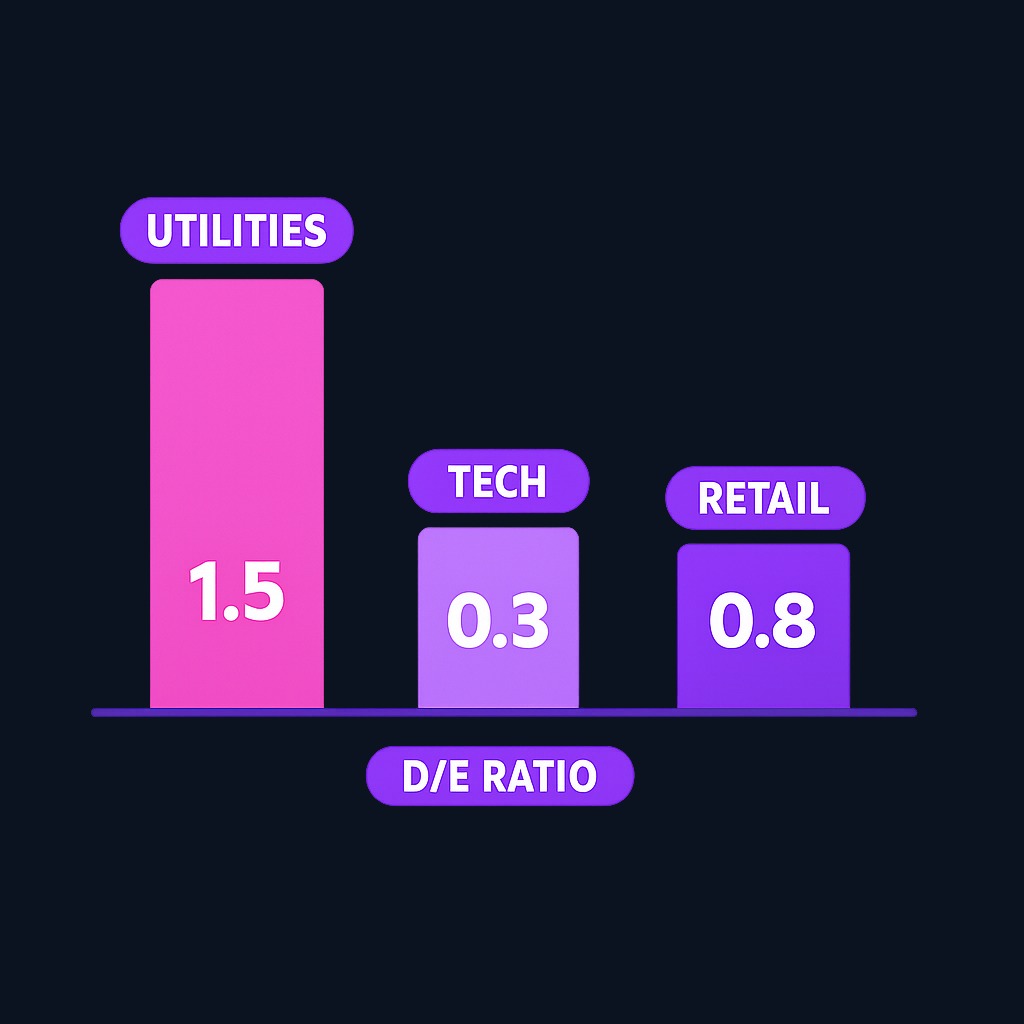
Capital intensity drives normal leverage levels, so cross-industry comparisons mislead:
| Sector type | Typical leverage character |
|---|---|
| Utilities and telecom | High ratios are routine; stable regulated cash flows support heavy borrowing |
| Manufacturing and industrials | Moderate ratios; equipment financing is common |
| Software and services | Low ratios; few hard assets to borrow against and volatile growth spending |
| Banks and insurers | Structurally high; liabilities are the raw material of the business model, so D/E is judged by regulatory capital measures instead |
The practical rule from fundamental analysis: compare a company against its sector peers and its own history, never against the market-wide average.
Practice investing with Finelo
Build practical investing skills with guided lessons, simulator practice, and structured challenges.
Implications of a high or low ratio
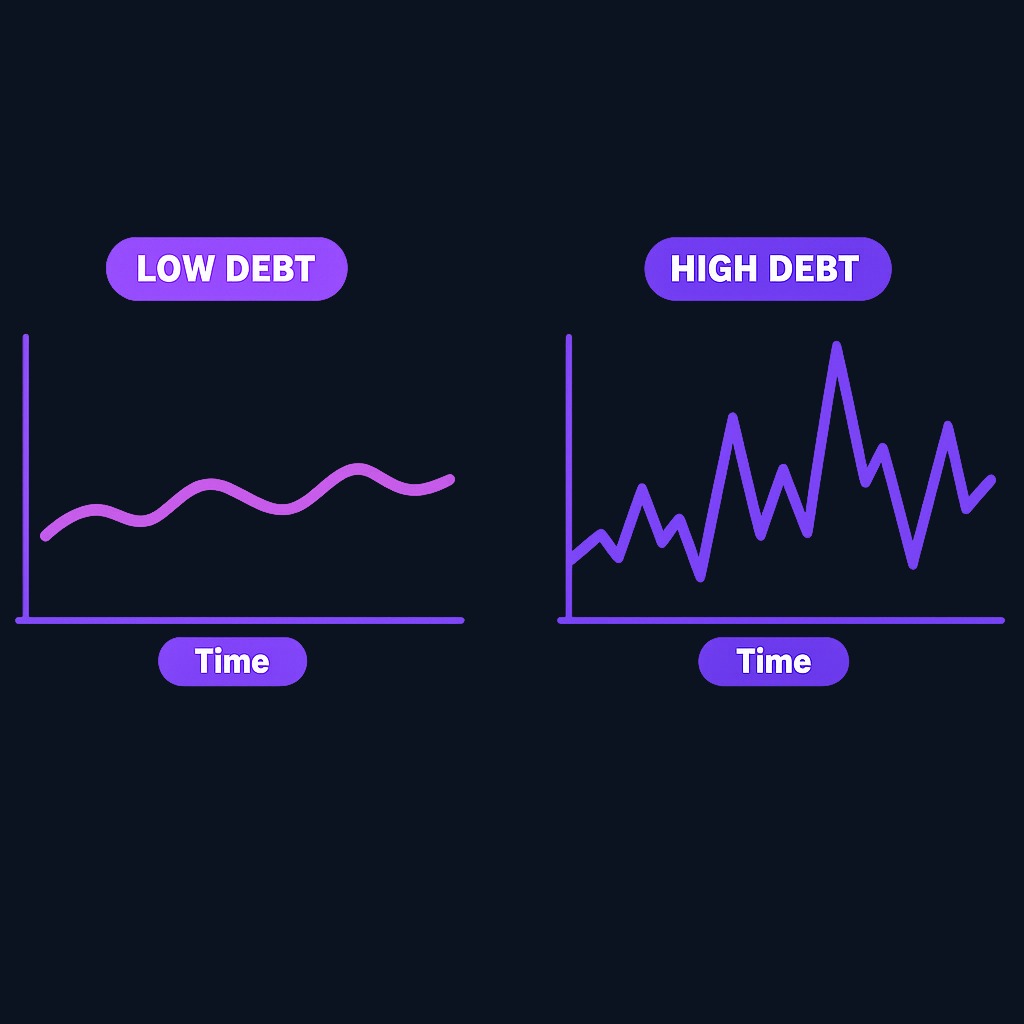
A high debt to equity ratio concentrates risk. More cash flow is pre-committed to lenders, refinancing needs recur, and rising interest rates raise costs at each rollover. In a downturn, leveraged companies cut investment, dilute shareholders, or restructure, and equity holders stand last in line.
A low ratio buys resilience and options. The company can survive shocks, borrow opportunistically when asset prices fall, and fund growth without dilution. The cost is potential inefficiency: equity capital is expensive, and refusing sensible debt can depress returns on equity.
For shareholders, the ratio also shapes return character. Two companies with identical operations but different leverage will deliver different equity experiences: the leveraged one swings harder in both directions. Neither profile is universally better; the question is which risk you are being paid to hold and whether the balance sheet matches the stability of the underlying business.
What to know before deciding
The debt to equity ratio is a snapshot built on accounting values, not market values, and book equity can be distorted by buybacks, write-downs, and intangibles. It also says nothing about the terms of the debt: maturity dates, interest rates, and covenants determine how dangerous a given load really is. Off-balance-sheet obligations such as leases may or may not be included depending on accounting standards and the data provider.
Treat the ratio as a screening question, not a verdict. When it flags a company as unusually leveraged for its sector, the next step is reading the debt footnote in the filings, not selling or buying on the number alone. This is educational context for analysis, and no single ratio decides an investment.
Decision framework: using D/E in your analysis
- Comparing two peers? Prefer the one whose leverage matches its cash-flow stability, not simply the lower number.
- Screening for safety? Combine a moderate D/E with strong interest coverage and positive free cash flow.
- Evaluating a bank or insurer? Skip D/E; use the sector's regulatory capital metrics instead.
- Watching a holding's ratio climb? Read the filings to learn what the new debt funds and when it matures.
- Seeing negative equity? Ignore the ratio entirely and investigate why equity is negative before anything else.
FAQ
What is a good debt to equity ratio?
There is no reliable market-wide cutoff. Judge the debt-only ratio against close peers and the company's history, then check interest coverage, maturities, covenants, and free cash flow.
What does a debt to equity ratio of 1.5 mean?
Under the debt-only definition, the company carries $1.50 of interest-bearing debt for every $1.00 of shareholders' equity. If the source uses total liabilities, it is reporting liabilities-to-equity instead. Whether the leverage is risky depends on cash-flow stability and the debt's cost, terms, and maturity schedule.
Is a negative debt to equity ratio bad?
A negative ratio means shareholders' equity is negative, which usually reflects accumulated losses or aggressive buybacks. The ratio itself stops being meaningful, and the balance sheet deserves a closer look before investing.
What is the difference between debt to equity and debt to assets?
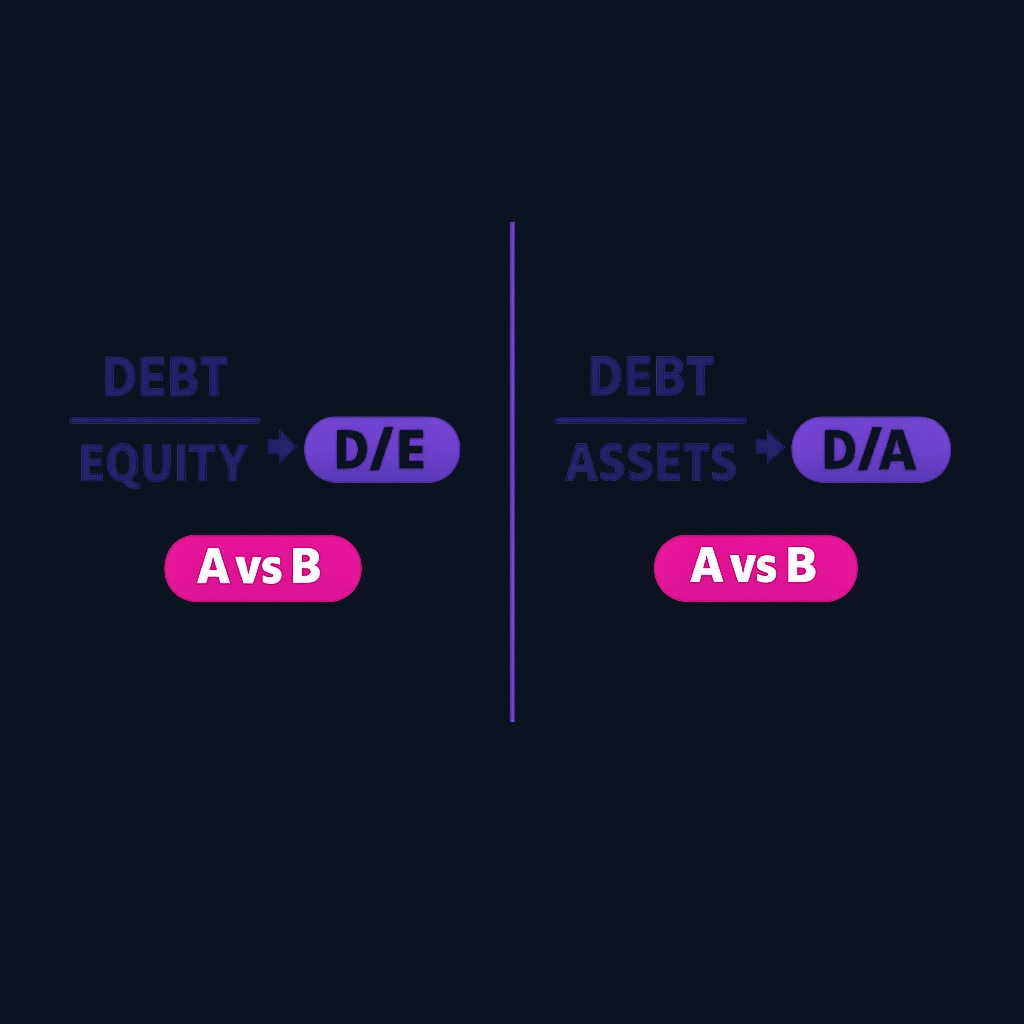
Debt to equity compares interest-bearing debt with owners' capital, while debt to assets compares debt with total assets. Ratios that use total liabilities are broader leverage measures and should be labeled accordingly.
Conclusion and next steps
The debt to equity ratio compresses a company's financing philosophy into one number: how much of the business is built on borrowed money. Calculate it consistently, read it against sector norms and the company's own trend, and confirm what the debt actually funds before judging it. Pick one company you follow, pull its balance sheet from the latest filing, and work the ratio out yourself; the number means more when you have traced where it comes from.
InvestingFundamental AnalysisFinancial StatementsBeginner
Practice investing with Finelo
Build practical investing skills with guided lessons, simulator practice, and structured challenges.
About the author
Finelo Team
The Finelo Team creates practical investing and trading education designed to help beginners learn faster with structured challenges, simulator practice, and bite-sized lessons.
Keep reading — Related articles

Investing
Tax-gain harvesting vs. tax-loss harvesting
Compare realizing investment gains with realizing losses, including holding periods, wash sales, offsets, and portfolio tradeoffs.
Finelo Team

Investing
Stable value fund vs. money market fund
Compare investment structure, contract protections, transfer restrictions, net yields, and access inside a retirement account.
Finelo Team

Investing
Single-life vs. joint-life annuity
Compare income for one lifetime with continued payments to a survivor, using equal premiums and matching guarantee terms.
Finelo Team


