Definition note: A common enterprise-value definition is market value of common equity + debt + preferred equity + noncontrolling interests − cash and non-operating investments, adjusted for the comparison. CFA Institute's enterprise-multiple guide explains that EBITDA is not cash flow and that EV/EBITDA facilitates—but does not make neutral—comparisons across capital structures. The multiple is not “years to buy the business.” Define reported versus adjusted EBITDA and reconcile every adjustment.
Understanding the EV to EBITDA Ratio: What It Tells Investors
The EV to EBITDA ratio compares a company's enterprise value with its earnings before interest, taxes, depreciation, and amortization. Enterprise value means market capitalization plus debt, minus cash. The ratio answers…
9 min read
Practice investing with Finelo
Build practical investing skills with guided lessons, simulator practice, and structured challenges.
Want to learn more?
Build practical investing skills with guided lessons, simulator practice, and structured challenges.
Explore FineloExplore Finelo's 28-day challenges
Turn learning into a daily habit with guided challenge paths.
The EV to EBITDA ratio compares a company's enterprise value with its earnings before interest, taxes, depreciation, and amortization. Enterprise value means market capitalization plus debt, minus cash. The ratio answers a simple question: how many years of core operating earnings would it take to buy the whole business, debt included? This page is for investors learning fundamental valuation. It suits anyone who wants a metric that works across companies with different debt loads and tax situations. Below you will find the formula, a worked example, and comparisons with other multiples. You will also see where the ratio misleads. Read it, then practice on a few real companies before using the multiple in any decision.
People researching the ev to ebitda ratio usually meet it in stock screeners and analyst reports, where it is often written EV/EBITDA and called the enterprise multiple.
What is the EV to EBITDA ratio?
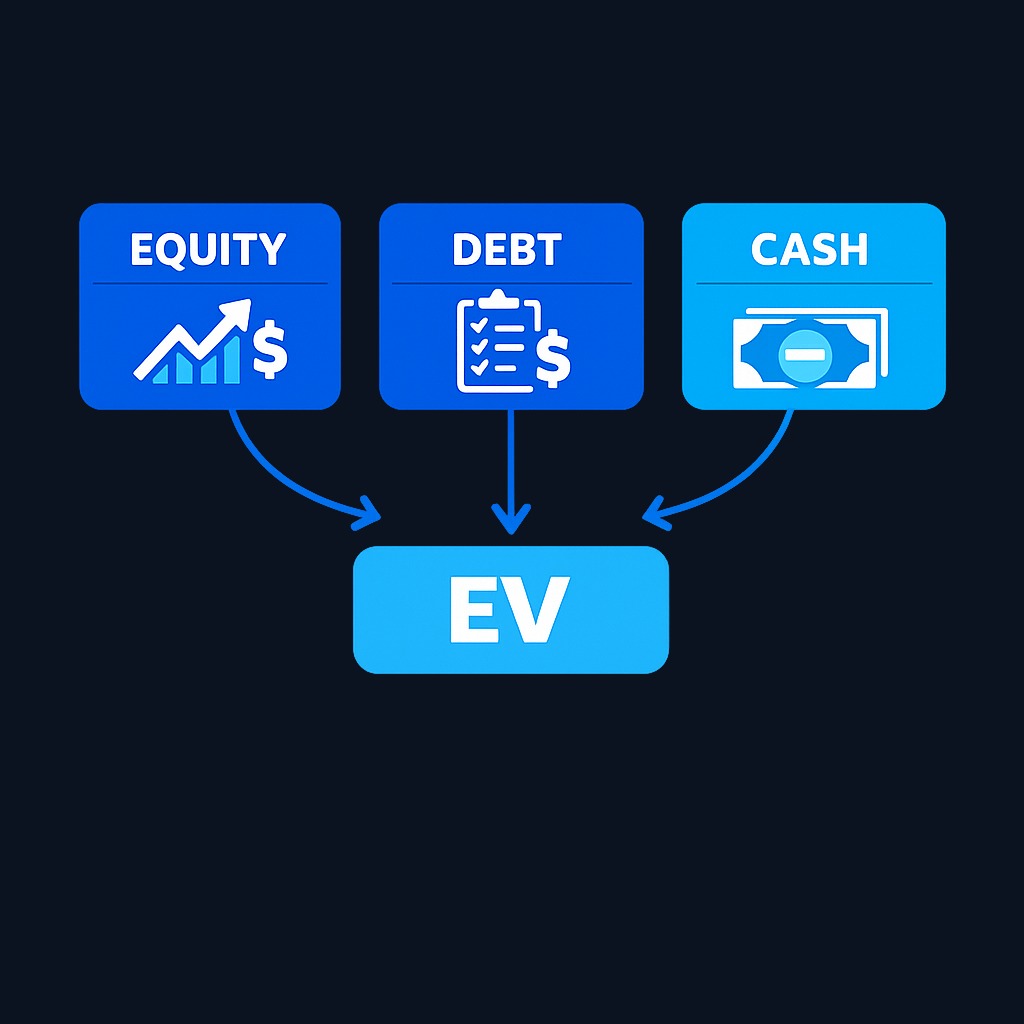
The ratio has two parts. Enterprise value (EV) is the theoretical price of buying the entire company. It equals market capitalization, plus total debt, minus cash and equivalents. Debt is added because a buyer inherits it. Cash is subtracted because the buyer effectively gets it back.
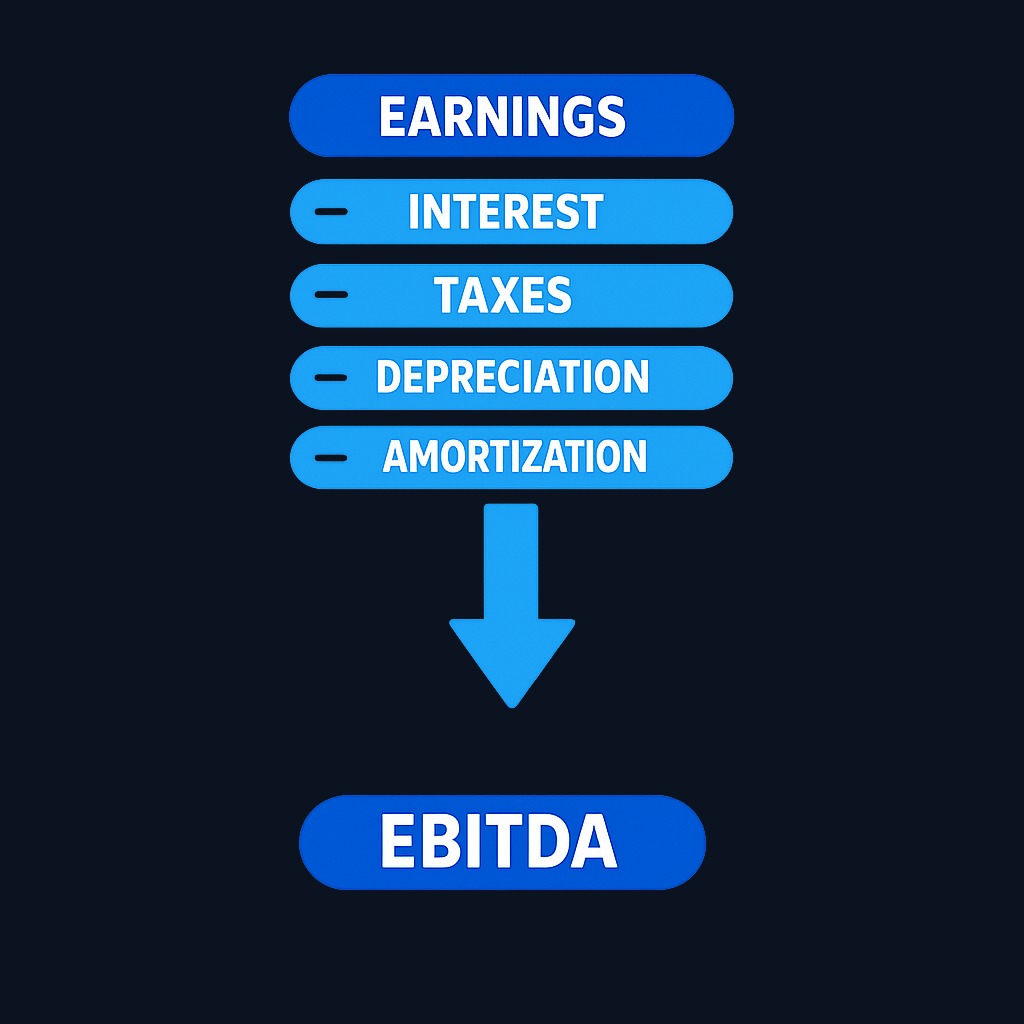
EBITDA is earnings before interest, taxes, depreciation, and amortization. It approximates the earning power of core operations. Financing choices, tax rates, and non-cash accounting charges are stripped away.
Dividing EV by EBITDA produces a valuation multiple. A 10x result means enterprise value equals ten times the selected EBITDA measure; it is not a payback period. Because EV includes debt while EBITDA is pre-interest, the multiple can facilitate peer comparison, but it is not capital-structure neutral: leverage affects risk, taxes, WACC, and the justified multiple.
How to calculate the EV to EBITDA ratio
The formula:
EV/EBITDA = (Market capitalization + Total debt − Cash and equivalents) / EBITDA
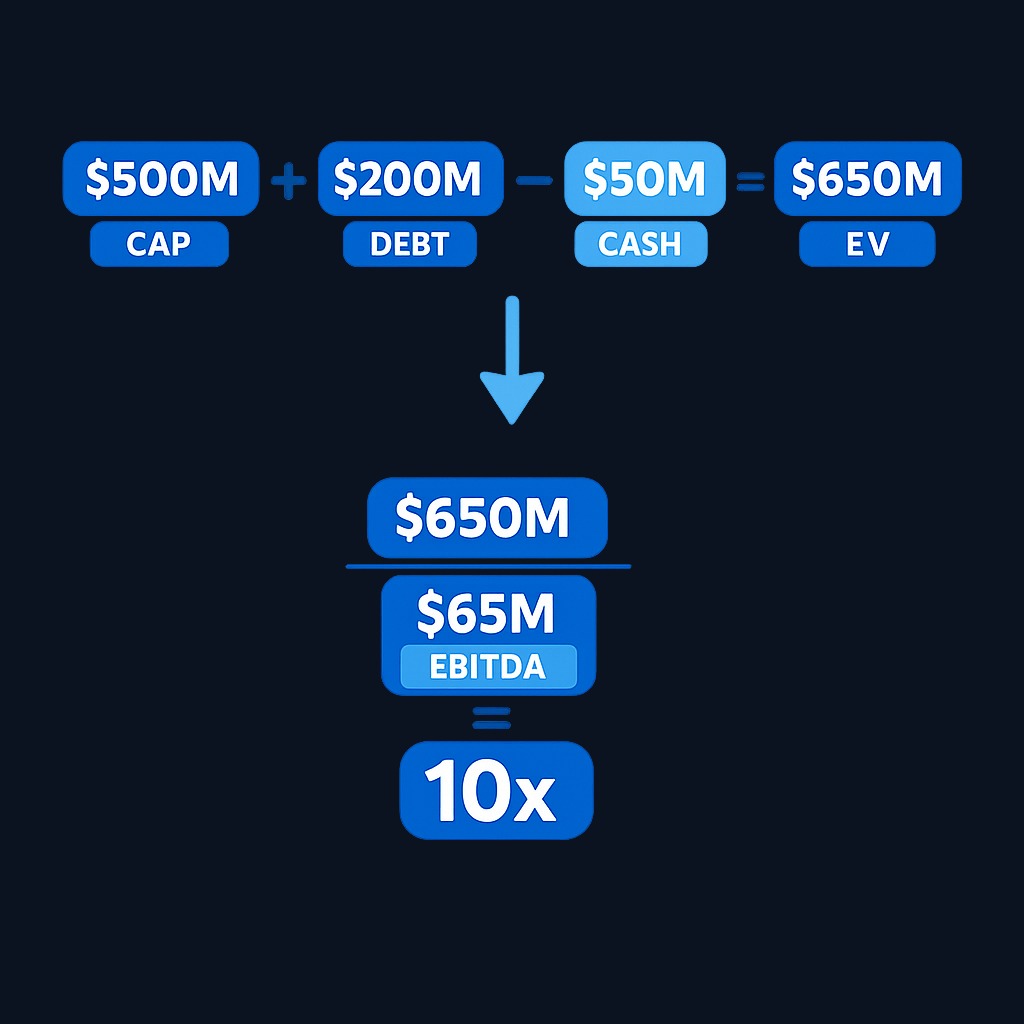
A worked example with rounded numbers:
| Component | Value |
|---|---|
| Share price | $40 |
| Shares outstanding | 100 million |
| Market capitalization | $4.0 billion |
| Total debt | $1.5 billion |
| Cash and equivalents | $0.5 billion |
| Enterprise value | $5.0 billion |
| EBITDA (trailing 12 months) | $625 million |
| EV/EBITDA | 8.0 |
Every input comes from public filings. The balance sheet supplies debt and cash. The income statement and cash flow statement supply the pieces of EBITDA, and the market supplies the share price. For U.S.-listed companies, annual and quarterly reports are freely available through the SEC's EDGAR filing system. That means you can rebuild the ratio yourself rather than trusting a screener's number.
Two practical notes. Most data providers use trailing twelve-month EBITDA. Analysts often quote forward multiples built on estimates instead, and the two can differ a lot for fast-changing businesses. EBITDA itself is not a standardized accounting figure. Check whether one-time items were added back before comparing numbers from different sources.
Why the EV to EBITDA ratio matters
The multiple earns its popularity from three properties.
It is a capital-provider multiple, not a capital-structure-neutral measure. Moving debt into EV and using pre-interest EBITDA reduces one comparability problem, but leverage still changes the numerator, risk, tax effects, and required return. Compare debt, leases, pension obligations, and cash conversion alongside the multiple.
It ignores non-cash accounting charges. Depreciation schedules reflect past capital spending and accounting policy, not current operating performance. Stripping them out helps. Companies with different asset ages and depreciation methods become easier to compare.
It is the deal-maker's metric. Acquirers think in terms of buying whole businesses, debt and all. That is exactly what enterprise value measures. Takeover pricing is commonly discussed in EV/EBITDA terms. The ratio connects everyday investors to the same yardstick used in mergers and buyouts.
Comparing EV/EBITDA with other valuation metrics
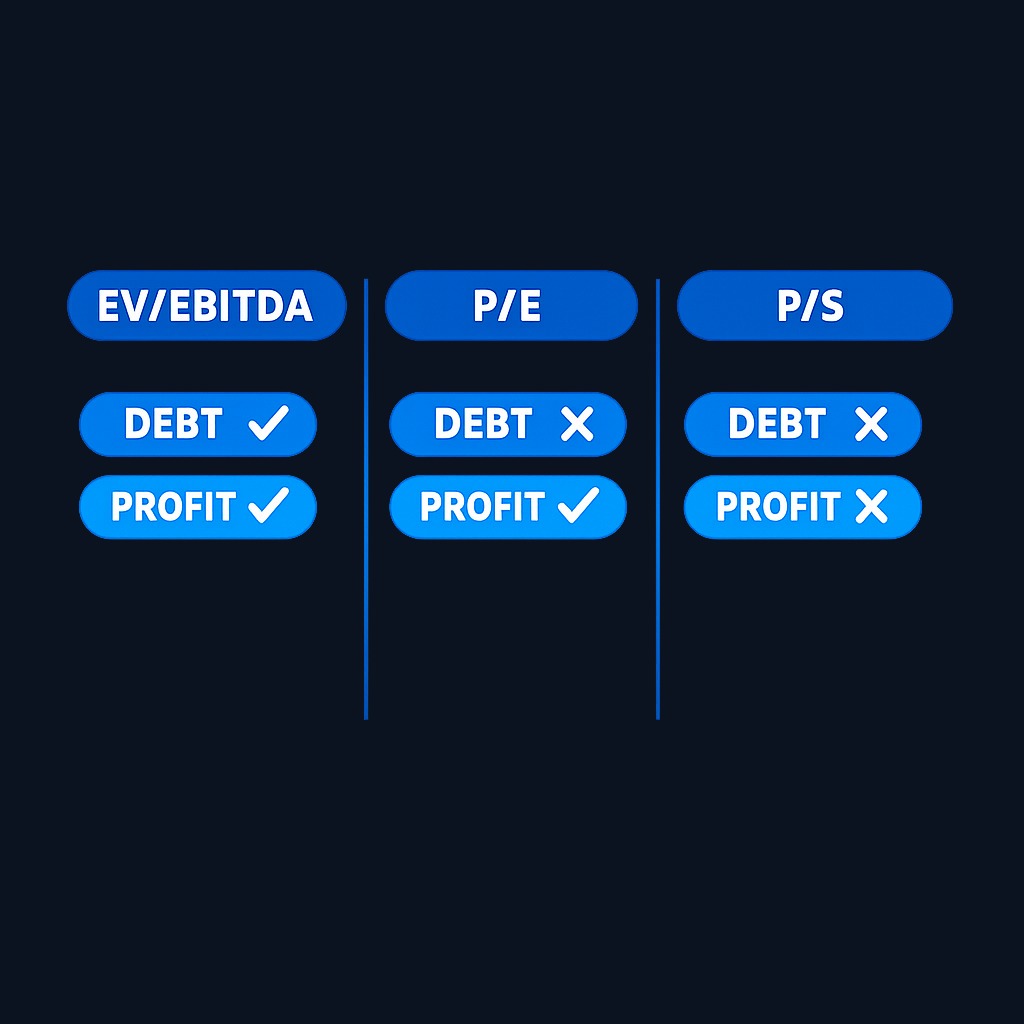
| Metric | What it compares | Strength | Blind spot |
|---|---|---|---|
| EV/EBITDA | Whole-company value vs core operating earnings | Neutral to debt and tax differences | Ignores capital spending needs |
| P/E | Share price vs net income | Simple, widely quoted | Distorted by leverage, tax rates, one-off items |
| P/S | Share price vs revenue | Works for unprofitable companies | Says nothing about profitability |
| P/B | Share price vs book value | Useful for asset-heavy and financial firms | Weak for asset-light businesses |
| EV/EBIT | Whole-company value vs operating profit after depreciation | Captures capital intensity better | Reintroduces depreciation policy differences |
None of these replaces the others. A common workflow in fundamental analysis is simple. Screen with EV/EBITDA, sanity-check with P/E, then read the filings to learn what the multiples are actually rewarding or punishing.
Industry variations in EV/EBITDA ratios
Multiples are only meaningful against the right peer group. Capital-light software businesses routinely trade at much higher EV/EBITDA levels than utilities, telecoms, or heavy industry. More of their EBITDA converts into free cash, and their growth expectations are higher. Cyclical sectors like energy and mining behave differently. They swing between looking cheap at earnings peaks and expensive at troughs, even when the price barely moves.
That leads to two rules. Compare a company against its own sector and its own history, not against the whole market. Treat an unusually low multiple as a question rather than an answer. The market may be pricing in declining earnings, hidden liabilities, or structural change. A "cheap" enterprise multiple is a starting point for research, not a buy signal.
Practice investing with Finelo
Build practical investing skills with guided lessons, simulator practice, and structured challenges.
Limitations of the EV to EBITDA ratio
- EBITDA is not cash flow. It excludes capital expenditures, working-capital swings, interest, and taxes. All of those consume real cash. Asset-heavy businesses can post healthy EBITDA while generating little free cash.
- It can flatter indebted companies. Ignoring interest is useful for comparison but dangerous for solvency judgment. A business can look reasonably valued on EV/EBITDA while struggling to service its debt.
- Add-backs invite manipulation. "Adjusted EBITDA" figures can exclude recurring costs labeled as one-time. Reconcile adjusted numbers to the audited statements.
- It fails for negative-EBITDA companies. Early-stage and distressed businesses need revenue- or asset-based measures instead.
- Financial companies do not fit. Banks and insurers treat debt as raw material, so enterprise value definitions break down. Book-value metrics serve better there.
What to know before deciding
A valuation multiple compresses an entire business into one number, and compression always loses information. Before acting on an EV/EBITDA comparison, check three things. Confirm the EBITDA figure is calculated the same way across your peer group. Confirm the debt and cash numbers are current. Confirm nothing unusual, like a pending acquisition or asset sale, is distorting enterprise value. Multiples describe the present price of expectations. They do not tell you whether those expectations are right. Valuation work is educational context for judgment, not a mechanical trading rule. No ratio removes the need to understand the business behind the numbers.
Decision framework: when to lean on EV/EBITDA
- Comparing peers with different debt loads? EV/EBITDA is the right first tool; P/E will mislead you.
- Evaluating an asset-heavy business? Pair EV/EBITDA with EV/EBIT or free-cash-flow measures so capital intensity is not hidden.
- Screening for potential value? Use sector-relative multiples, then read filings to learn why the discount exists.
- Looking at banks or insurers? Skip the enterprise multiple; use price-to-book and return on equity instead.
- Analyzing a loss-making startup? EBITDA is negative or meaningless; use revenue multiples and unit economics.
FAQ
What is a good EV to EBITDA ratio?
There is no universal threshold. Multiples vary widely by sector, growth rate, and interest-rate environment. A number is only high or low relative to comparable companies and the firm's own history.
Why use EV/EBITDA instead of the P/E ratio?
Because it neutralizes differences in debt and tax situations. P/E compares only the equity slice against income after interest and taxes. Leverage distorts it. EV/EBITDA prices the whole business against pre-financing earnings.
Where do I find the inputs for the ratio?
Market capitalization comes from the current share price and share count. Debt, cash, and the components of EBITDA come from the company's financial statements, which U.S. investors can pull directly from SEC filings.
Can EV/EBITDA be negative?
Yes, when EBITDA is negative. It also happens when enormous cash balances push enterprise value below zero. In either case the ratio stops being meaningful, and other valuation approaches should take over.
Conclusion and next steps
The EV to EBITDA ratio is the workhorse of company-level valuation. It is debt-aware, resistant to accounting noise, and spoken fluently by analysts and acquirers alike. Use it to compare businesses within a sector, and interrogate outliers instead of chasing them. Always pair the multiple with a look at real cash generation and debt capacity. Pick three companies in one industry and rebuild their enterprise multiples from the filings. You will learn more about valuation than any screener can teach.
InvestingFundamental AnalysisFinancial StatementsBeginner
Practice investing with Finelo
Build practical investing skills with guided lessons, simulator practice, and structured challenges.
About the author
Finelo Team
The Finelo Team creates practical investing and trading education designed to help beginners learn faster with structured challenges, simulator practice, and bite-sized lessons.
Keep reading — Related articles

Investing
Tax-gain harvesting vs. tax-loss harvesting
Compare realizing investment gains with realizing losses, including holding periods, wash sales, offsets, and portfolio tradeoffs.
Finelo Team

Investing
Stable value fund vs. money market fund
Compare investment structure, contract protections, transfer restrictions, net yields, and access inside a retirement account.
Finelo Team

Investing
Single-life vs. joint-life annuity
Compare income for one lifetime with continued payments to a survivor, using equal premiums and matching guarantee terms.
Finelo Team


