The operating cash flow ratio compares cash generated by operations during a period with current liabilities reported on the balance sheet. It is a liquidity indicator, not a literal claim that the same cash is available to pay every obligation. Because the numerator is a period flow and the denominator is a point-in-time balance, the ratio is most useful when calculated consistently across periods and peers.
Understanding the Operating Cash Flow Ratio

The operating cash flow ratio compares cash generated by operations during a period with current liabilities reported on the balance sheet. It is a liquidity indicator, not a literal claim that the same cash is available…
8 min read
Practice investing with Finelo
Build practical investing skills with guided lessons, simulator practice, and structured challenges.
Want to learn more?
Build practical investing skills with guided lessons, simulator practice, and structured challenges.
Explore FineloExplore Finelo's 28-day challenges
Turn learning into a daily habit with guided challenge paths.
What is the operating cash flow ratio?
The operating cash flow ratio is a liquidity metric. It compares cash generated by operations - the money actually collected from customers minus cash paid to run the business - against current liabilities, the obligations due within twelve months.
The numerator comes from the cash flow statement, not the income statement. That distinction matters. Net income includes non-cash items such as depreciation and accrual adjustments, and it counts credit sales before cash arrives. Operating cash flow strips that away and reports what landed in the bank from running the business.

The denominator, current liabilities, sits on the balance sheet. It includes accounts payable, short-term debt, accrued expenses, and the current portion of long-term debt.
Because the ratio uses reported operating cash flow, it can complement balance-sheet measures such as the current ratio and quick ratio. It is not immune to timing, classification, or working-capital effects.
How to calculate the operating cash flow ratio
Operating cash flow ratio = Cash flow from operations ÷ Average current liabilities
Some references use period-end current liabilities instead. Average current liabilities—beginning plus ending balances divided by two—better matches a period flow with a period-average balance. State which convention you use and keep it consistent.
Both inputs are public for any US-listed company. Cash flow from operations appears as the first section of the cash flow statement; current liabilities appear on the balance sheet. You can pull both from a company's annual or quarterly filings, available for free through the SEC's EDGAR database.
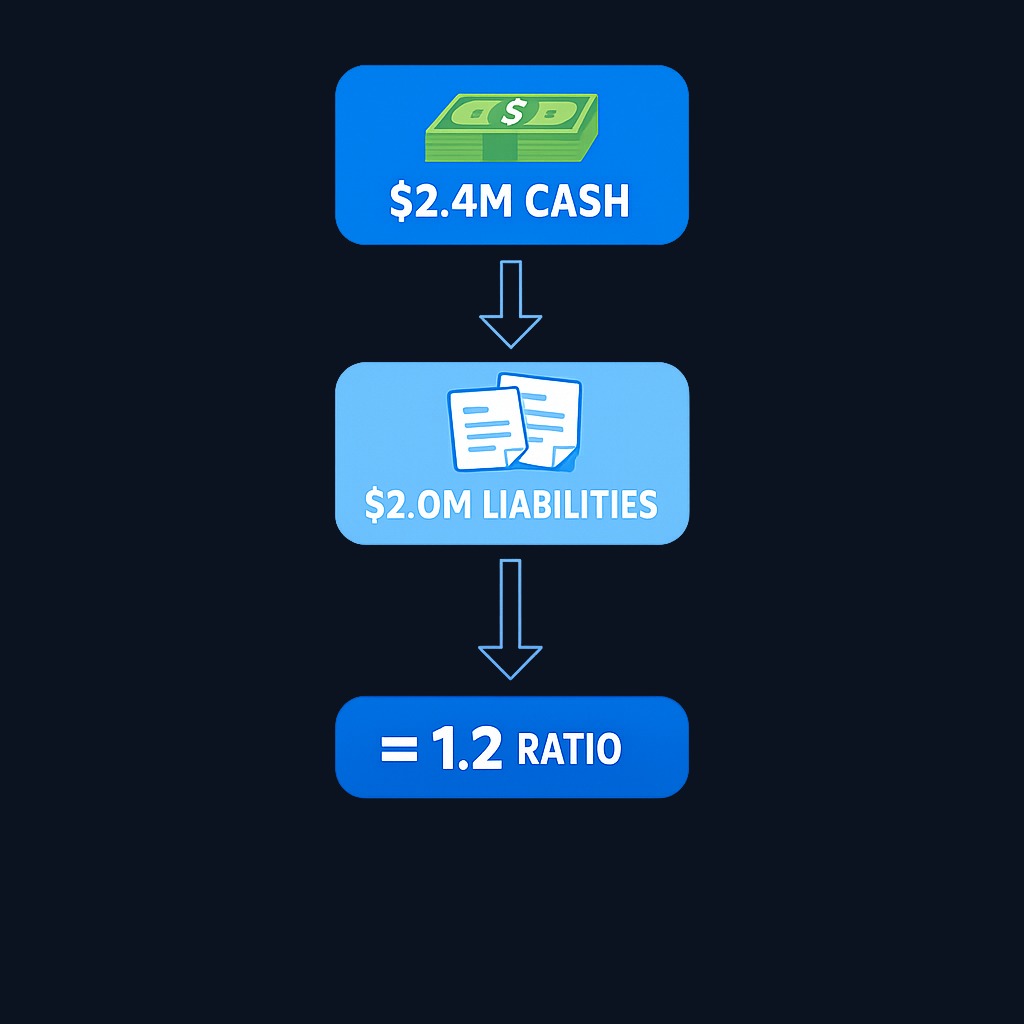
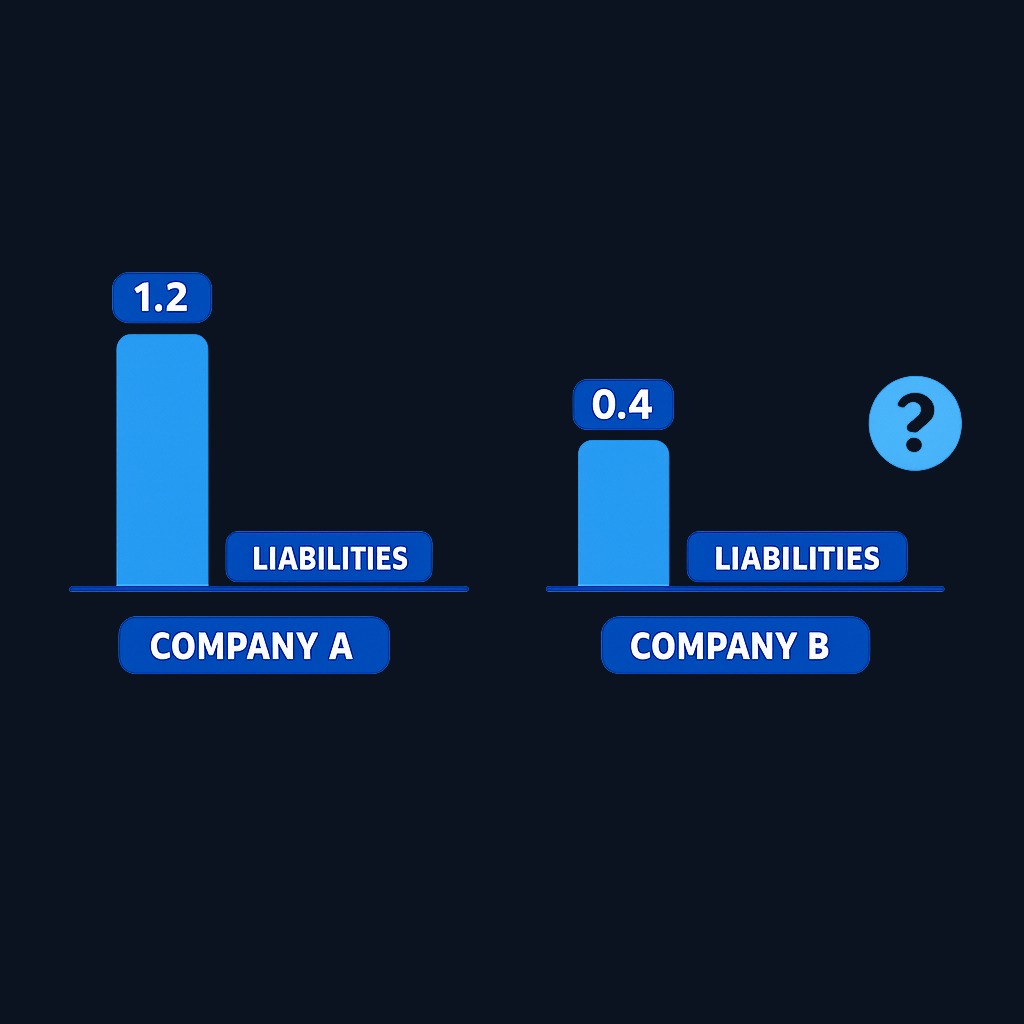
A worked example: a company reports $2,400,000 in annual cash flow from operations. Current liabilities were $1,800,000 at the start of the year and $2,200,000 at year end, for a $2,000,000 average. Its operating cash flow ratio is 1.2. That means annual operating cash flow equaled 1.2 times average current liabilities; it does not mean every liability was paid or that all operating cash remained available.
A second company reports $600,000 of operating cash flow against $1,500,000 of average current liabilities, a ratio of 0.4. The lower result prompts questions about cash balances, credit facilities, working-capital seasonality, and the timing of obligations; it does not by itself prove a funding shortfall.
Why the ratio matters
Profitable companies can still hit liquidity crises. Earnings are an accounting opinion; payroll, rent, and supplier invoices are settled in cash. A business that books strong net income while its customers pay slowly can find itself unable to cover current liabilities - a pattern the operating cash flow ratio exposes and the income statement hides.
The ratio avoids some accrual-estimate issues but can still be affected by collection timing, delayed supplier payments, classification choices, and one-off working-capital movements. Lenders therefore read it alongside cash balances, borrowing facilities, covenant terms, and maturity schedules.
Finally, trend matters as much as level. A ratio drifting down across several quarters - especially while reported earnings stay flat or rise - is one of the classic signs that profit quality is deteriorating.
Interpreting the number
| Ratio | Reading |
|---|---|
| Higher than peers and the company's history | Investigate whether cash conversion improved and whether the change is durable |
| Stable and in line with peers | Use as one liquidity input alongside cash, credit facilities, and maturities |
| Falling or materially below peers | Inspect working capital, seasonality, financing access, and unusual cash-flow items |
Context shapes the reading. Fast-turn businesses with steady cash collection, such as grocery retail, can run safely at lower levels because cash arrives daily. Lumpy, project-based businesses need a bigger cushion. Seasonal companies may show a weak ratio right before their peak selling season and a strong one right after, so comparing the same quarter year over year is fairer than comparing adjacent quarters.
As always with single metrics, cross-industry comparisons mislead. Compare a company against its own history and its direct competitors.
How it compares with other liquidity ratios
The current ratio divides current assets by current liabilities, and the quick ratio does the same after removing inventory. Both are snapshots of balance-sheet stock at one date. The operating cash flow ratio instead measures a flow: cash generated across the whole period against obligations at period end.

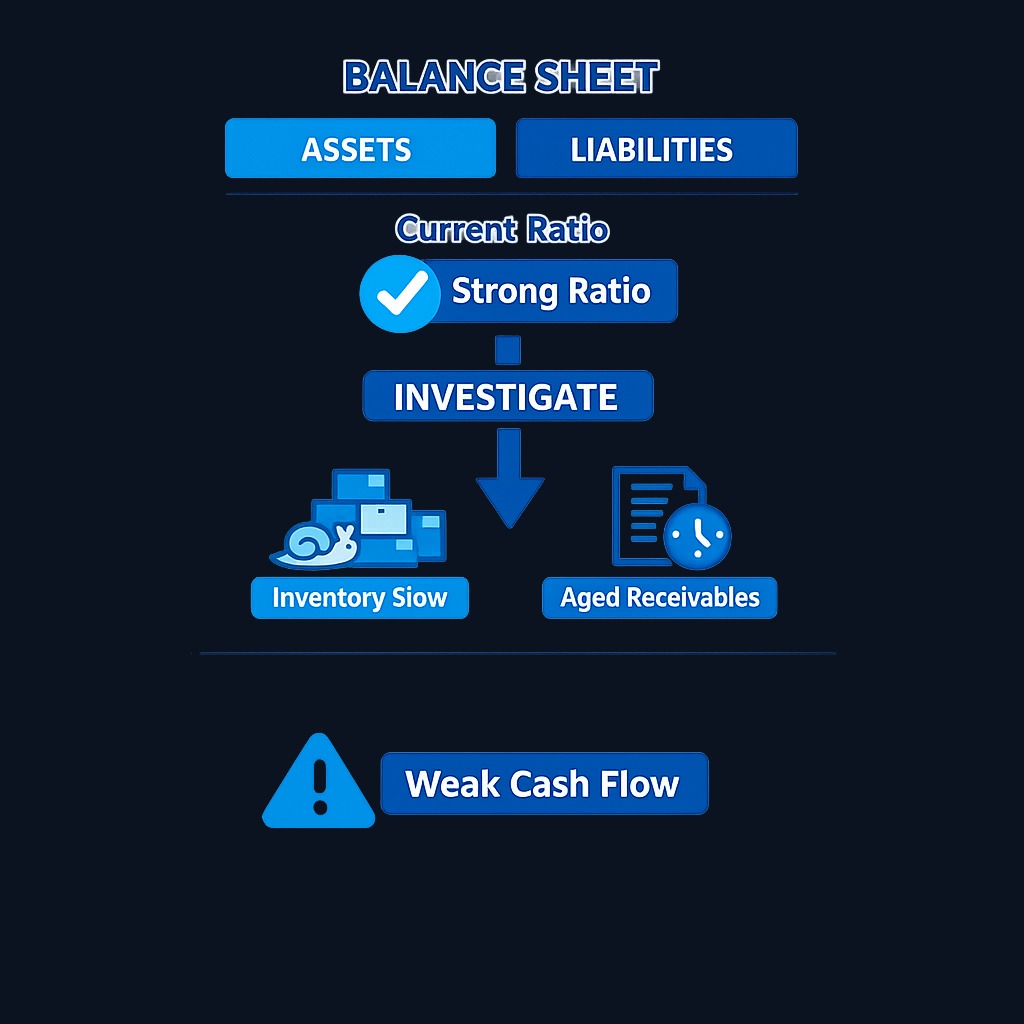
That makes the metrics complementary. A company can post a healthy current ratio built on slow-moving inventory and doubtful receivables - assets that may never convert to cash at book value. If the same company shows a weak operating cash flow ratio, the flow metric is telling you the stock metric flatters reality. When the two disagree, dig deeper; the answer usually sits in receivables aging or inventory quality.
Practice investing with Finelo
Build practical investing skills with guided lessons, simulator practice, and structured challenges.
Limitations of the operating cash flow ratio
- Timing games. Companies can delay supplier payments right before period end, temporarily boosting operating cash flow.
- One-off inflows. Working-capital swings, such as a big customer prepayment, can inflate a single period's ratio without any durable improvement.
- Capital intensity is invisible. The ratio ignores investing needs; a business can cover current liabilities while starving its equipment budget.
- Accounting classification. Some cash flow items sit on the border between operating and financing categories, so definitions vary slightly across companies and jurisdictions.
None of these flaws break the metric. They simply argue for reading it across several periods and alongside the full cash flow statement.
What to know before deciding
Before acting on any ratio, remember what it cannot tell you. The operating cash flow ratio compares a period's cash generation with a balance-sheet category; it does not map cash receipts to the exact dates when obligations come due. It says nothing about growth prospects, competitive position, or valuation. Treat a strong ratio as a prompt to confirm durable cash conversion, not a reason to buy by itself, and a weak one as a question rather than an automatic sell.
Decision framework: putting the ratio to work
- Compute it for the last eight quarters. A single reading hides seasonality and trend.
- Compare with the current and quick ratios. Agreement builds confidence; disagreement flags accrual distortion.
- Benchmark against two or three direct competitors over the same periods.
- Investigate any decline by reading the working-capital detail in the cash flow statement.
- Fold the finding into the bigger picture of margins, debt maturities, and cash reserves before making any portfolio decision.
FAQ
What is a good operating cash flow ratio?
There is no universal cutoff. Use the same calculation convention across time, compare with close peers, and evaluate cash balances, credit lines, seasonality, and maturity timing before drawing a conclusion.
How is the operating cash flow ratio different from the current ratio?
The current ratio compares balance-sheet assets to liabilities at one date. The operating cash flow ratio compares actual cash generated during the period to those liabilities, making it less sensitive to inventory values and receivable quality.
Where do I find operating cash flow in financial statements?
It is the subtotal of the first section of the cash flow statement, usually labeled "net cash provided by operating activities," in any annual or quarterly report.
Can the operating cash flow ratio be negative?
Yes. If operations consumed cash during the period, the numerator is negative. That is common for early-stage companies but a serious warning sign for mature ones.
Conclusion and next steps
The operating cash flow ratio asks how a period's operating cash generation compares with the scale of current liabilities. Because it draws on cash flow rather than net income, it adds a different perspective to earnings-based analysis. Track it over time, read it beside the current and quick ratios, and let disagreements point you to the balance-sheet lines that need scrutiny.
InvestingFundamental AnalysisFinancial StatementsBeginner
Practice investing with Finelo
Build practical investing skills with guided lessons, simulator practice, and structured challenges.
About the author
Finelo Team
The Finelo Team creates practical investing and trading education designed to help beginners learn faster with structured challenges, simulator practice, and bite-sized lessons.
Keep reading — Related articles

Investing
Tax-gain harvesting vs. tax-loss harvesting
Compare realizing investment gains with realizing losses, including holding periods, wash sales, offsets, and portfolio tradeoffs.
Finelo Team

Investing
Stable value fund vs. money market fund
Compare investment structure, contract protections, transfer restrictions, net yields, and access inside a retirement account.
Finelo Team

Investing
Single-life vs. joint-life annuity
Compare income for one lifetime with continued payments to a survivor, using equal premiums and matching guarantee terms.
Finelo Team


