Methodology note: Estimate the Sharpe ratio from average periodic excess returns divided by the matching-period standard deviation, then annualize only with a stated method and assumptions. Serial correlation can make square-root-of-time annualization wrong. Use the same currency, risk-free series, return frequency, period, and fee basis for comparisons. Volatility is not all risk, and there are no universal 1/2/3 quality bands. CFA Institute summarizes the statistics and annualization limits.
Understanding the Sharpe Ratio: Formula, Interpretation, and Limits
The Sharpe ratio measures how much return an investment earns per unit of risk. It divides the return earned above a risk-free benchmark by the volatility of those returns, so a higher number means better risk-adjusted…
9 min read
Practice investing with Finelo
Build practical investing skills with guided lessons, simulator practice, and structured challenges.
Want to learn more?
Build practical investing skills with guided lessons, simulator practice, and structured challenges.
Explore FineloExplore Finelo's 28-day challenges
Turn learning into a daily habit with guided challenge paths.
The Sharpe ratio measures how much return an investment earns per unit of risk. It divides the return earned above a risk-free benchmark by the volatility of those returns, so a higher number means better risk-adjusted performance. This page is for investors, students, and fund researchers who want the formula, a worked calculation, sensible interpretation ranges, and the limitations that keep the ratio from being the last word. Learn the math first, then use the comparison and decision sections to apply it to real funds and portfolios.
The useful questions are how the ratio was calculated, whether the comparison is like-for-like, and which risks its volatility denominator misses.
What the Sharpe ratio measures
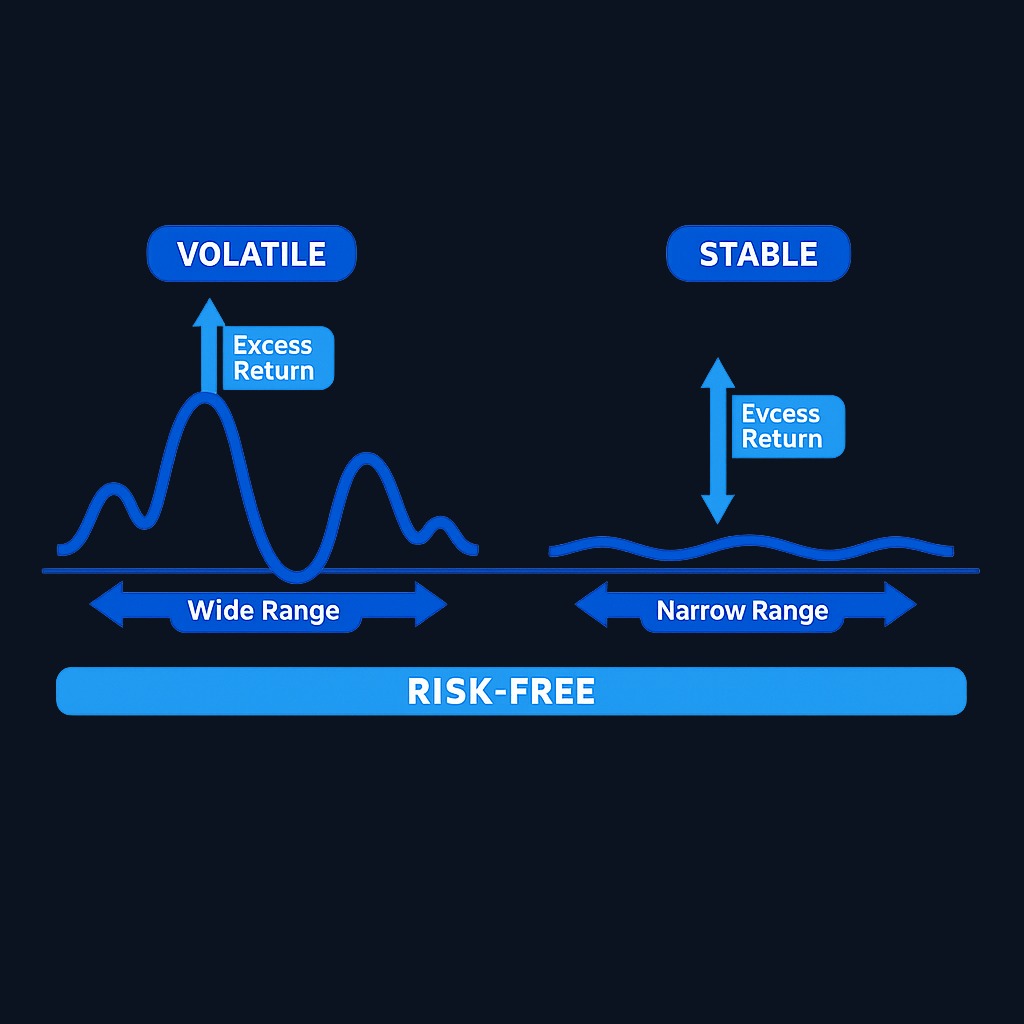
Raw returns hide the ride. Two funds that both earned 8% last year are not equivalent if one drifted up calmly while the other swung 20% in both directions along the way. The Sharpe ratio, introduced by William Sharpe in the 1960s, makes that difference visible by scaling excess return by the volatility endured to get it.
The intuition: investing always offers a nearly risk-free alternative, such as short-term government bills. Any risky investment must justify itself by beating that baseline, and the question is how much punishment came with the outperformance. The Sharpe ratio answers in one number: excess return per unit of volatility. It is the most widely used risk-adjusted performance measure in fund reporting, portfolio reviews, and strategy backtests.
The Sharpe ratio formula
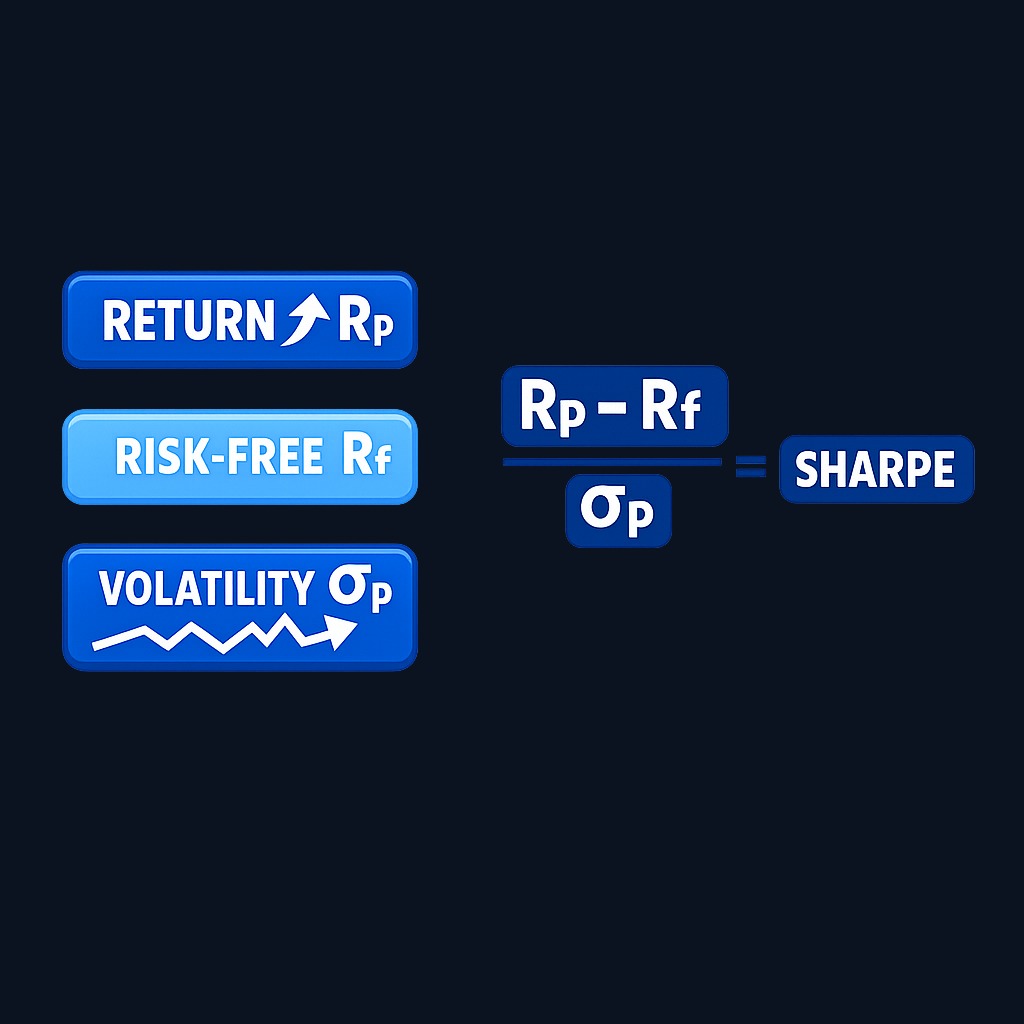
Sharpe ratio = (Rp − Rf) ÷ σp
Where:
- Rp is the return of the portfolio or investment over the period.
- Rf is the risk-free rate over the same period, commonly proxied by short-term US Treasury yields. Current Treasury yields are published in the Federal Reserve's H.15 selected interest rates release.
- σp is the standard deviation of the portfolio's returns, the conventional measure of total risk.
All three inputs must cover the same period and frequency. Annualized returns pair with annualized volatility; monthly with monthly. Mixing frequencies is the most common spreadsheet error in do-it-yourself calculations.
How to calculate the Sharpe ratio step by step
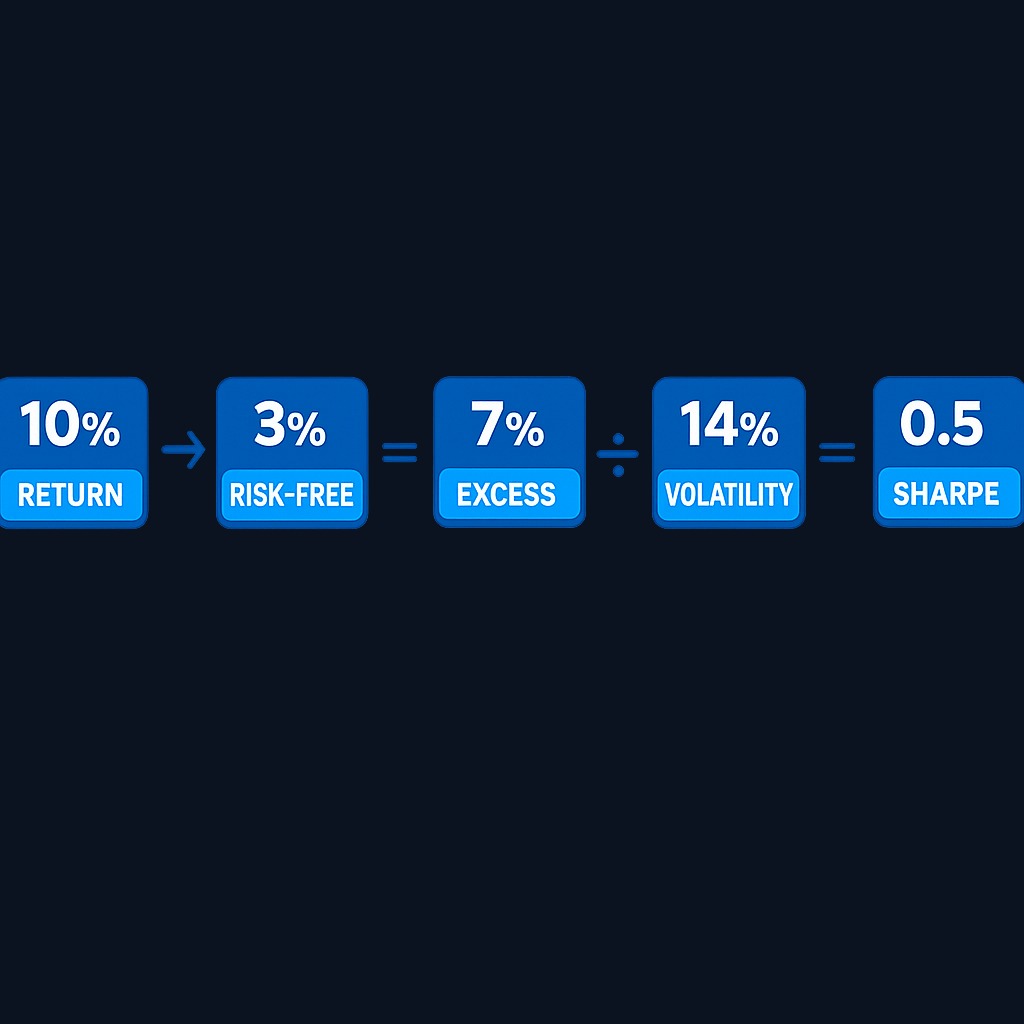
- Collect the return series. Say a portfolio returned 10% over the past year.
- Pick the risk-free rate. Suppose short-term Treasury bills yielded 3% over the same year.
- Compute excess return. 10% − 3% = 7%.
- Measure volatility. Suppose the portfolio's annualized standard deviation was 14%.
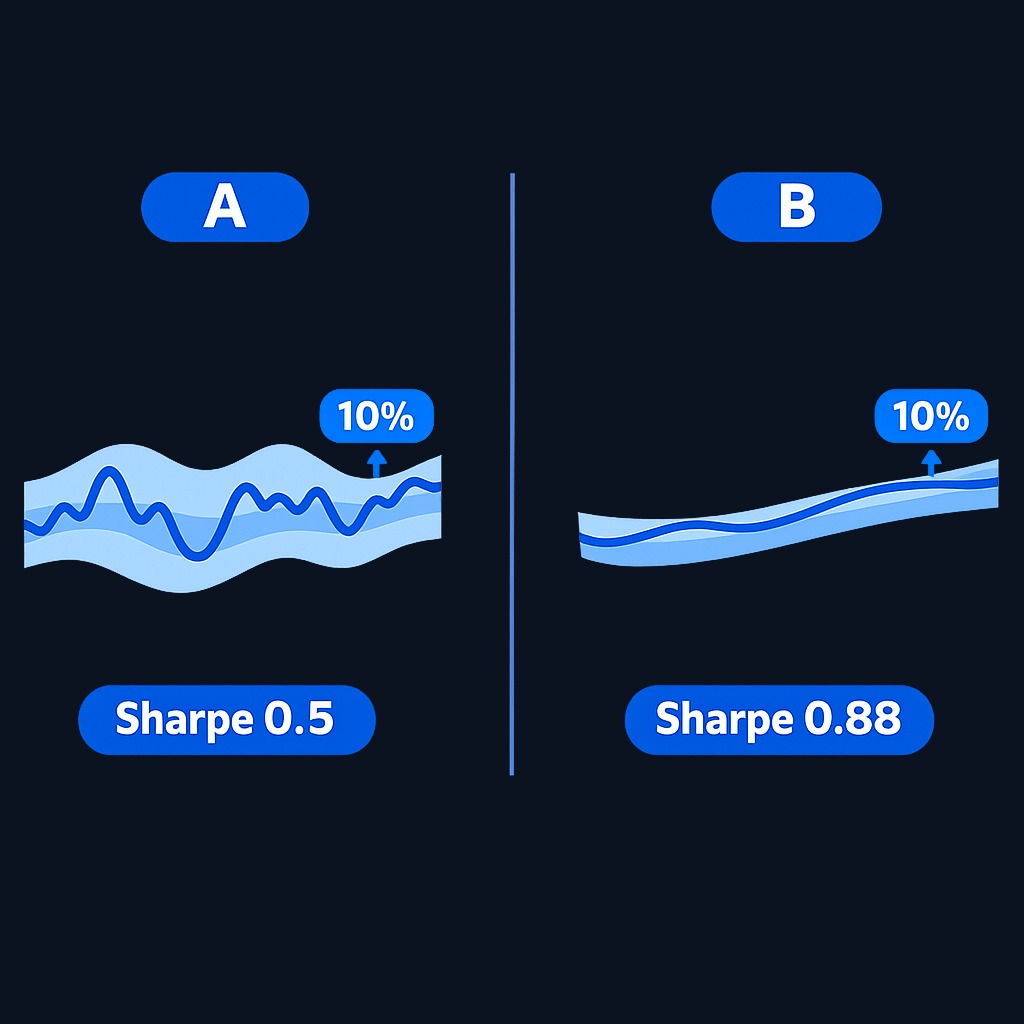
- Divide. 7 ÷ 14 = a Sharpe ratio of 0.5.
Now compare a second portfolio that also returned 10% with only 8% volatility: its ratio is 7 ÷ 8 ≈ 0.88. Same return, meaningfully better risk-adjusted result. That comparison, not the standalone number, is where the ratio earns its keep.
For longer evaluations, practitioners usually compute the ratio from monthly excess returns and annualize, which smooths the effect of any single period. Consistency matters more than the exact convention; use the same method for every fund you compare.
Interpreting Sharpe ratio values
Common rules of thumb treat higher as better, with rough bands:
| Sharpe ratio | Conventional reading |
|---|---|
| Below 0 | Underperformed the risk-free rate; risk was not paid for |
| 0 to 1 | Positive but modest risk-adjusted return; typical for many diversified portfolios |
| 1 to 2 | Good; return meaningfully compensated the volatility |
| 2 to 3 | Very good; rare over long periods |
| Above 3 | Exceptional, and worth skepticism about measurement or sustainability |
Treat these bands as conversation starters, not physics. Sharpe ratios vary with the market regime: nearly everything looks brilliant in a calm bull market and poor in a crisis year. The ratio is most informative when comparing similar strategies over the same window, and least informative as an absolute grade ripped out of context. Time horizon matters too, since short windows produce noisy, unstable ratios.
Applications in portfolio management
- Fund comparison. Ranking funds with similar mandates by Sharpe ratio highlights which manager delivered returns most efficiently.
- Strategy evaluation. Backtests report Sharpe ratios to summarize whether a rule's profits justified its swings.
- Allocation decisions. Adding an asset with modest returns but low correlation can raise the whole portfolio's Sharpe ratio, which is the quantitative case for diversification.
- Performance monitoring. A persistent decline in a fund's rolling Sharpe ratio flags a changing risk profile before raw returns necessarily do.
- Setting expectations. Comparing your portfolio's ratio with a broad index version of it answers whether complexity is adding anything.
In each use, the ratio functions as a screening and comparison tool. The decision still requires looking under the hood at what produced the number.
Practice investing with Finelo
Build practical investing skills with guided lessons, simulator practice, and structured challenges.
Limitations of the Sharpe ratio
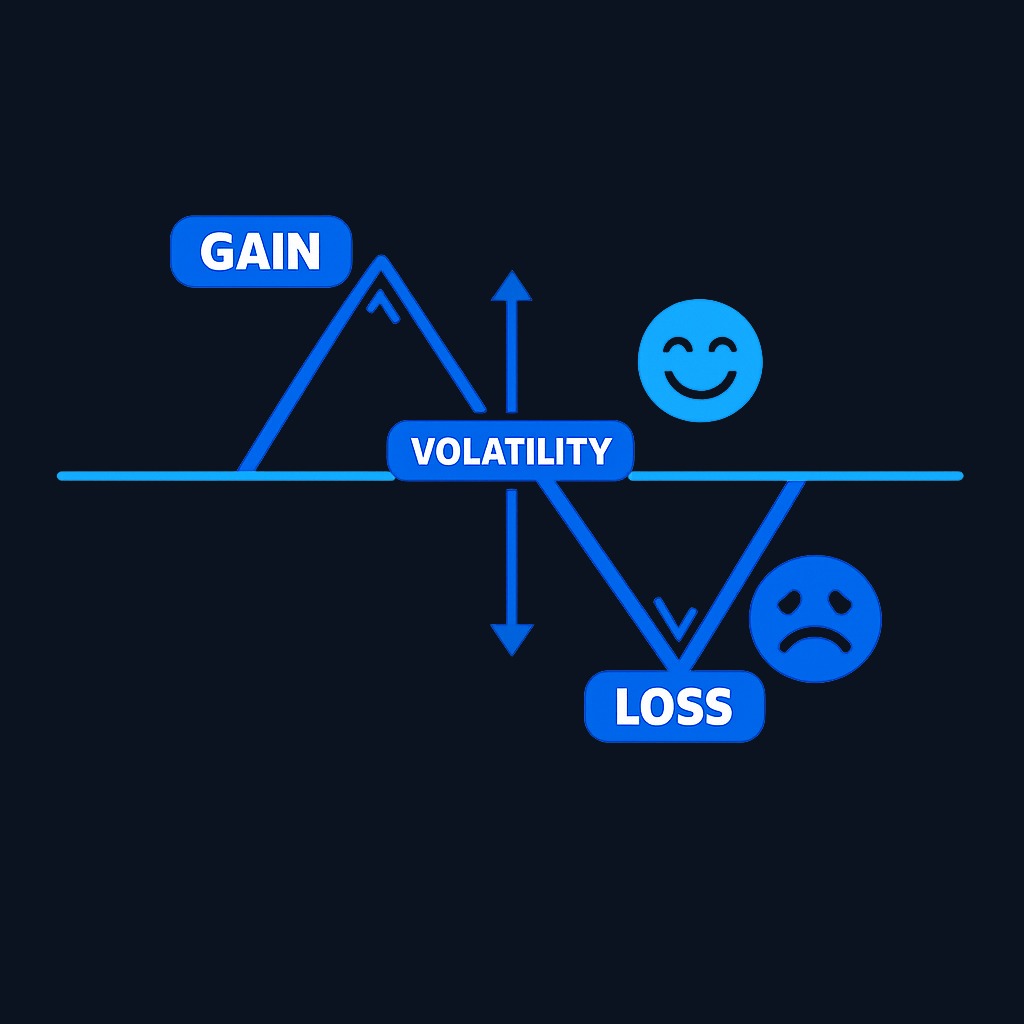
- Volatility is a blunt risk measure. Standard deviation penalizes upside swings exactly like downside ones, though investors only fear the latter.
- Return distributions misbehave. Strategies with steady small gains and rare large losses, like some option-selling approaches, show flattering ratios until the rare loss arrives.
- Inputs are period-dependent. The same fund can show a Sharpe ratio of 0.4 or 1.4 depending on the window chosen, inviting cherry-picking.
- The risk-free rate choice moves the answer. Different bill maturities or averaging methods shift results, especially when rates change quickly.
- It ignores liquidity and leverage. Smooth returns from illiquid or leveraged strategies can mask risk that volatility never captured.
- Gaming is possible. Managers aware of being judged by the ratio can shape reported returns, smoothing marks or selling tail risk, to flatter it.
None of these flaws retire the metric. They argue for pairing it with drawdown measures, longer windows, and qualitative understanding of the strategy.
Comparing the Sharpe ratio with other metrics
| Metric | What it divides | Best used for |
|---|---|---|
| Sharpe ratio | Excess return ÷ total volatility | General-purpose comparison of funds and strategies |
| Sortino ratio | Excess return ÷ downside volatility only | Strategies where upside swings should not be penalized |
| Treynor ratio | Excess return ÷ market beta | Judging diversified portfolios against market risk only |
| Maximum drawdown | Peak-to-trough loss | Understanding worst-case experience and recovery demands |
| Alpha | Return beyond a benchmark model | Isolating manager skill from market exposure |
A practical workflow uses them together: screen with the Sharpe ratio, check the Sortino ratio when a strategy's volatility is asymmetric, and always look at maximum drawdown to understand what living with the strategy felt like in the worst stretch.
What to know before deciding
Before acting on any Sharpe-ratio comparison, confirm four things. The windows match: comparing one fund's five-year ratio with another's three-year ratio is meaningless. The strategies are comparable: a bond fund beating a stock fund on Sharpe ratio tells you about risk levels, not skill. The number is stable: rolling ratios that swing wildly signal regime dependence. And the tails are understood: ask what the worst month looked like, because the ratio will not tell you. A strong Sharpe ratio is a reason to investigate further, never a reason to skip the investigation.
Decision framework: using the Sharpe ratio well
| Your intent | Recommended next step |
|---|---|
| Compare two similar funds | Compute both ratios over the same multi-year window and check rolling stability |
| Evaluate your own portfolio | Compare its ratio against a simple index blend at similar volatility |
| Assess a backtested strategy | Demand out-of-sample results and inspect drawdowns alongside the ratio |
| Judge a high-Sharpe pitch | Ask what tail risk or illiquidity could be subsidizing the smoothness |
| Learn risk-adjusted thinking | Practice the calculation on paper portfolios before using it on real money |
FAQ
What is a good Sharpe ratio?
There is no universal “good” cutoff. Compare similar strategies using identical periods, return frequencies, risk-free inputs, currency, and fee treatment; examine estimation error, autocorrelation, drawdowns, liquidity, and tail exposure.
What risk-free rate should I use in the Sharpe ratio?
Short-term US Treasury yields are the standard proxy, matched to your measurement period. The key is consistency: use the same rate convention for every investment you compare.
Can the Sharpe ratio be negative?
Yes. A negative ratio means the investment returned less than the risk-free baseline over the period. Ranking by negative Sharpe ratios is unreliable, so treat any negative value simply as underperformance.
What is the difference between the Sharpe ratio and the Sortino ratio?
The Sharpe ratio divides excess return by total volatility, while the Sortino ratio divides by downside volatility only. Sortino flatters strategies whose swings are mostly upward; many analysts check both.
Next steps. Compute the Sharpe ratio for your own portfolio and for a simple index alternative over the same period, and let the gap tell you whether your current approach pays for its risk. To build fluency with volatility, diversification, and risk-adjusted thinking, the Finelo app teaches these concepts through short interactive lessons.
InvestingFundamental AnalysisBeginner
Practice investing with Finelo
Build practical investing skills with guided lessons, simulator practice, and structured challenges.
About the author
Finelo Team
The Finelo Team creates practical investing and trading education designed to help beginners learn faster with structured challenges, simulator practice, and bite-sized lessons.
Keep reading — Related articles

Investing
Tax-gain harvesting vs. tax-loss harvesting
Compare realizing investment gains with realizing losses, including holding periods, wash sales, offsets, and portfolio tradeoffs.
Finelo Team

Investing
Stable value fund vs. money market fund
Compare investment structure, contract protections, transfer restrictions, net yields, and access inside a retirement account.
Finelo Team

Investing
Single-life vs. joint-life annuity
Compare income for one lifetime with continued payments to a survivor, using equal premiums and matching guarantee terms.
Finelo Team


