The forward P/E ratio divides a company's current share price by its expected earnings per share over the next 12 months or the next fiscal year. Where the classic P/E looks backward at reported profits, the forward pe ratio prices the stock against what analysts believe is coming. It answers one question: how much are you paying today for next year's expected earnings?
Understanding the Forward P/E Ratio: A Comprehensive Guide
The forward P/E ratio divides a company's current share price by its expected earnings per share over the next 12 months or the next fiscal year. Where the classic P/E looks backward at reported profits, the forward pe…
8 min read
Practice investing with Finelo
Build practical investing skills with guided lessons, simulator practice, and structured challenges.
Want to learn more?
Build practical investing skills with guided lessons, simulator practice, and structured challenges.
Explore FineloExplore Finelo's 28-day challenges
Turn learning into a daily habit with guided challenge paths.
This page is for investors who see "forward P/E" on a screener and want to use it correctly: how it is calculated, when it beats the trailing version, where forecasts mislead, and how to fold it into a decision process. It is educational content, not financial advice.
What is the forward P/E ratio?
A price-to-earnings ratio compares what you pay per share with what the company earns per share. The forward variant swaps reported earnings for estimated future earnings, usually the consensus of analyst forecasts for the next fiscal year or the next four quarters.
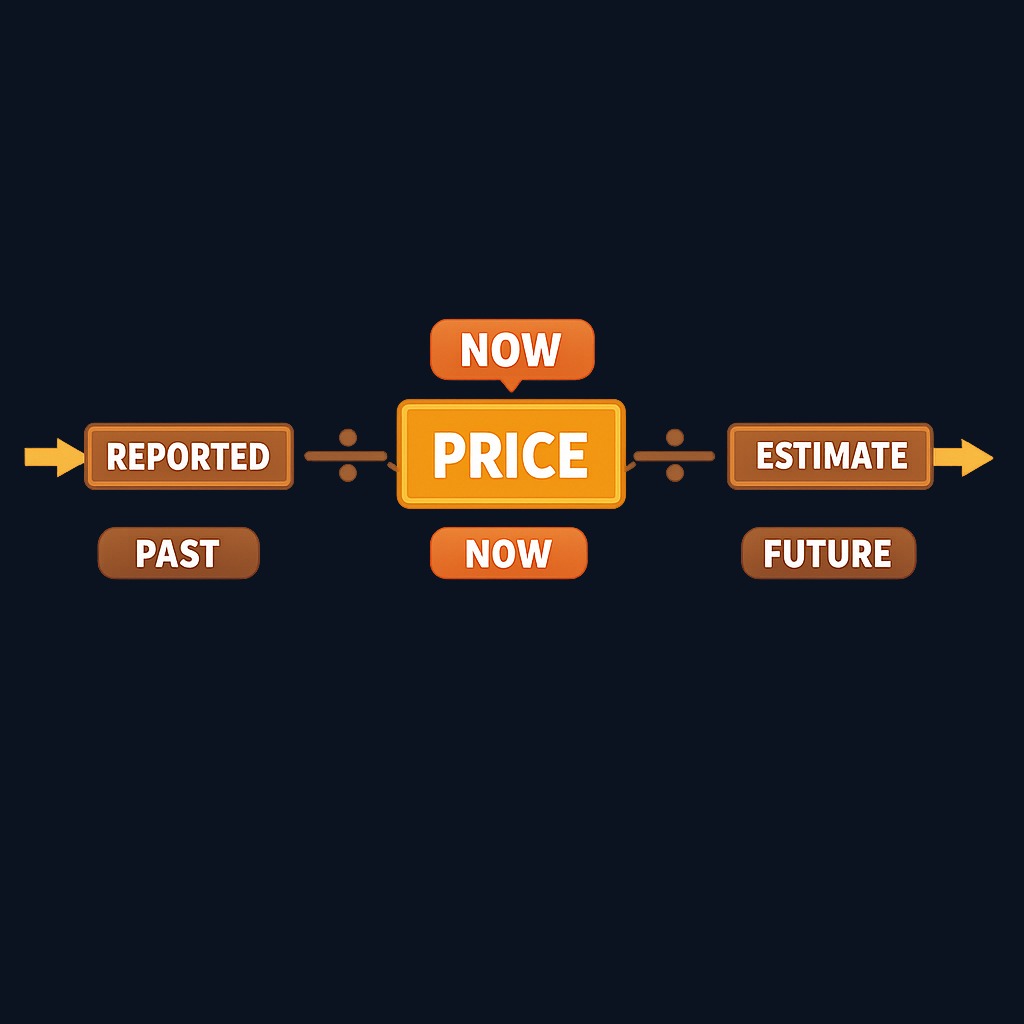
The shift from "what happened" to "what is expected" changes the meaning of the number. A trailing P/E of 40 with earnings doubling next year implies a forward P/E near 20; the market is not paying 40 times the business's real earning power, it is paying 20 times what that power is about to become. Growth stocks in particular can look absurd on trailing numbers and reasonable on forward ones, which is why valuation debates so often turn on which version each side quotes.
How is the forward P/E ratio calculated?
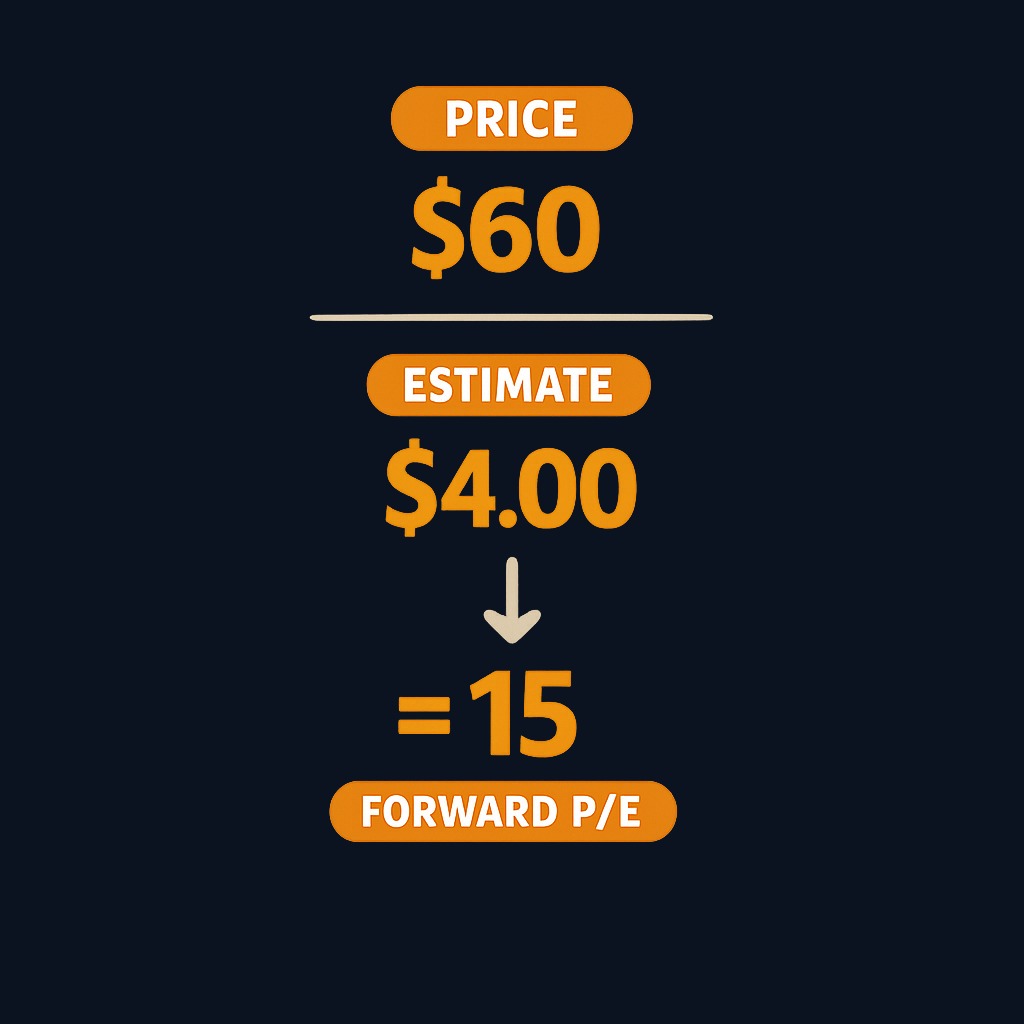
Forward P/E = current share price ÷ estimated future EPS
A worked example:
- A stock trades at $60.
- The consensus estimate for next-fiscal-year earnings is $4.00 per share.
- Forward P/E = 60 ÷ 4.00 = 15.
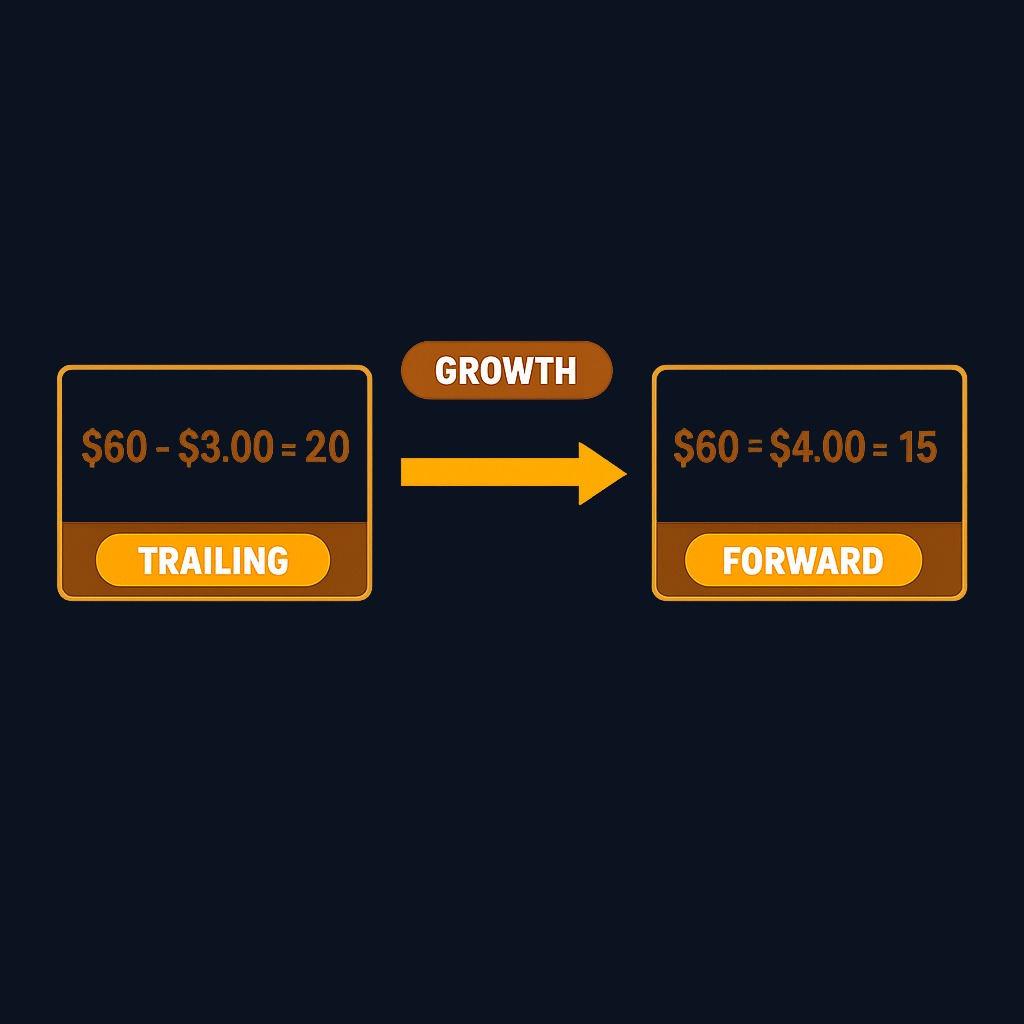
If last year's reported EPS was $3.00, the trailing P/E is 20. The gap between 20 and 15 encodes the expected 33% earnings growth. Three practical notes: use a consensus rather than a single analyst's number when possible; check whether the estimate covers the next fiscal year or a rolling next-twelve-months window, since the two produce different ratios for the same stock; and note the estimate date, because forecasts revise constantly through earnings season.
Advantages of using the forward P/E ratio
- It prices the future you are buying. Investment returns come from earnings that have not happened yet, and the forward multiple points at exactly those.
- It handles inflection points. For companies recovering from a bad year or lapping one-off charges, trailing earnings are distorted while estimates already reflect the normalization.
- It enables fairer growth comparisons. Two companies with equal trailing P/Es but different growth paths separate cleanly on forward multiples.
- It matches how professionals talk. Sell-side targets, fund commentary, and market strategy notes overwhelmingly quote forward multiples, so knowing the convention keeps you fluent in the discussion.
- It reacts to news faster. When guidance changes, estimates move within days, and the forward multiple reprices long before annual reports catch up.
Limitations of the forward P/E ratio
- Estimates are opinions. Consensus forecasts miss, sometimes badly, and the ratio inherits every error in the denominator.
- Optimism bias. Forecasts trend high at the start of a year and drift down; a stock can look cheap on estimates that are quietly being cut.
- Definitions vary. Providers mix fiscal-year and next-twelve-month estimates, GAAP and adjusted earnings, so two sites can show different forward P/Es for one stock.
- Management influence. Companies guide expectations, and a habitually conservative or promotional management team distorts the baseline.
- It invites false precision. A single decimal built on a guess is still a guess; the ratio is a range pretending to be a point.
The cure for most of these is simple hygiene: know whose estimate you are using, what it includes, and how recently it moved.
Forward P/E vs. trailing P/E ratio
| Feature | Forward P/E | Trailing P/E |
|---|---|---|
| Earnings used | Estimated, next year or next 12 months | Reported, last 12 months |
| Reliability of inputs | Depends on forecast accuracy | Audited, factual |
| Sensitivity to news | Fast, moves with revisions | Slow, moves with reports |
| Distortions | Optimistic or stale estimates | One-off charges, cycle peaks and troughs |
| Best use | Growth, recovery, and inflection stories | Stable businesses, historical comparisons |
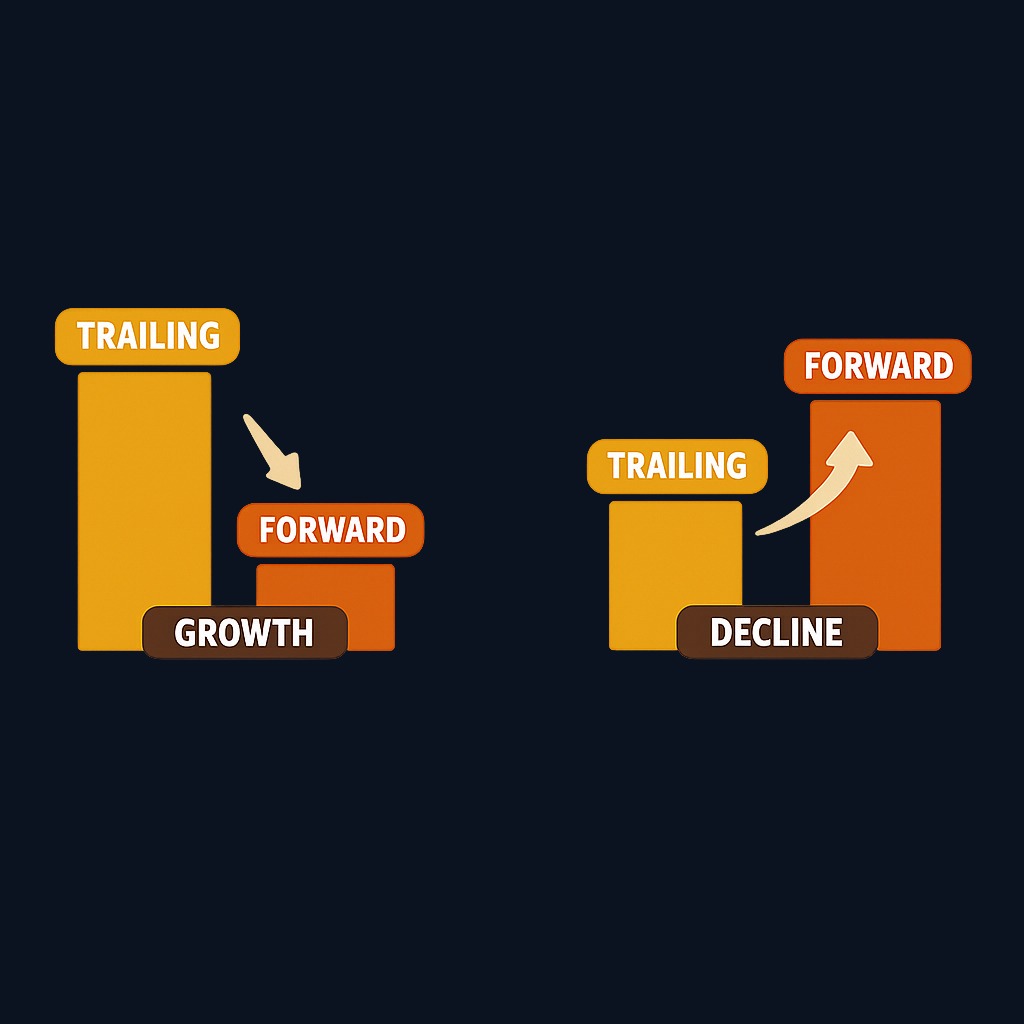
The two ratios are complements, not rivals. Trailing numbers anchor you in verified reality; forward numbers tell you what the market believes happens next. The most informative signal is often the spread between them: a forward multiple far below trailing implies strong expected growth, while a forward multiple above trailing warns that earnings are expected to fall.
Practice investing with Finelo
Build practical investing skills with guided lessons, simulator practice, and structured challenges.
Real-world applications and scenarios
The recovery case. A manufacturer posts a loss after a restructuring year, making its trailing P/E meaningless. On $2.50 of estimated next-year EPS and a $30 price, the forward P/E of 12 gives investors a usable valuation anchor while the trailing number is noise.
The expensive-looking compounder. A software firm trades at a trailing P/E of 55, scaring off ratio screeners. Consensus expects earnings up 45% next year, putting the forward multiple near 38, still rich, but a different conversation, and one that must be judged against the sector's norms rather than the market's.
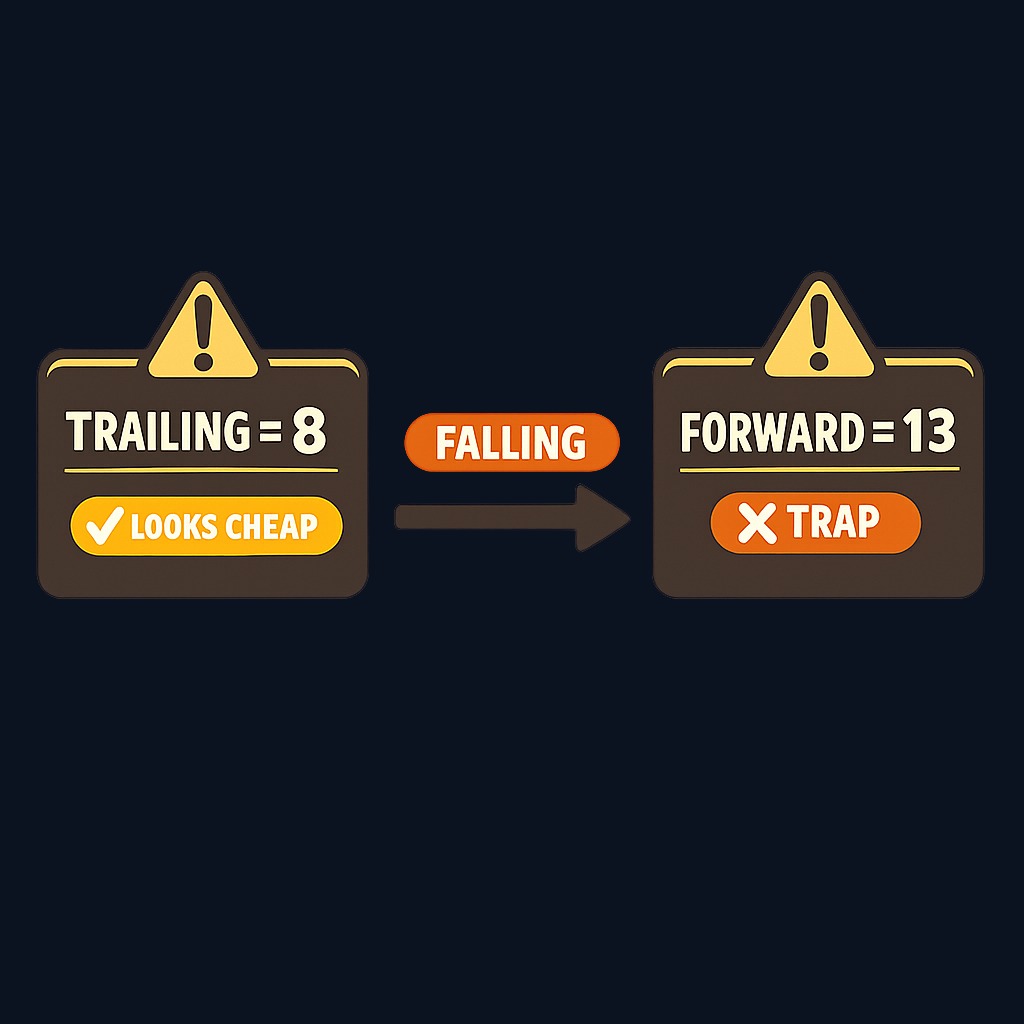
The value trap warning. A retailer shows a trailing P/E of 8 but a forward P/E of 13 because estimates are collapsing. The "cheap" stock is priced for shrinkage, and the forward multiple is the number that told the truth first.
Sector-specific insights on forward P/E ratios
Multiples cluster by industry, and comparing across clusters misleads. High-growth technology and healthcare names habitually carry higher forward multiples because more of their value sits in future earnings. Banks, energy producers, and other cyclical or capital-heavy businesses typically trade at lower forward P/Es, partly because their earnings are volatile and partly because growth expectations are structurally modest. Utilities sit low and stable, priced for income rather than expansion.
Two rules follow. First, benchmark a stock against its own sector's typical range and its own history, not against the whole market. Second, be careful at cycle turns in commodity-linked sectors: forward earnings estimates there can swing enormously with prices, making the ratio least reliable exactly when it looks most dramatic.
Economic factors influencing forward P/E ratios
Market-wide forward multiples expand and compress with the macro backdrop. Interest rates matter most: when rates rise, future earnings are discounted more heavily and investors pay less for each expected dollar, compressing forward P/Es across the board; benchmark yields are tracked in the Federal Reserve's H.15 selected interest rates release. Inflation works similarly, eroding the real value of future profits and injecting uncertainty into the estimates themselves. Recession expectations cut the denominator directly as analysts mark forecasts down, sometimes leaving the ratio looking higher even as prices fall. Sentiment amplifies everything: optimistic markets pay premium multiples for the same forecasts that pessimistic markets discount.
The practical takeaway: a forward P/E is only "high" or "low" relative to its era. Comparing today's multiple with a period of very different rates tells you more about the macro regime than about the stock.
What to know before deciding
Before acting on any forward P/E, verify three things: the estimate's source and date, the definition used (fiscal year vs. next twelve months, adjusted vs. GAAP earnings), and the direction of recent revisions. A low multiple on falling estimates is a warning, not a bargain. Then place the number in context: sector norms, the company's own five-year range, and the trailing-versus-forward spread. Only after that context is the multiple ready to inform a decision, alongside factors the ratio cannot see, such as balance-sheet strength and competitive position.
Decision framework and practical tips
- Screen, don't conclude. Use forward P/E to build a shortlist, never as the final verdict.
- Read the spread. Forward below trailing signals expected growth; forward above trailing signals expected decline. Investigate whichever story the spread tells.
- Check revision momentum. Rising estimates with a stable price quietly cheapen a stock; falling estimates quietly inflate it.
- Compare like with like. Same sector, same estimate convention, same time window.
- Stress the estimate. Recompute the ratio with earnings 10-20% below consensus; if the valuation case collapses, the margin of safety was the forecast, not the price.
- Pair with quality checks. Debt, cash flow, and moat determine whether expected earnings arrive at all.
Conclusion and next steps
The forward P/E ratio prices a stock against the earnings it is expected to produce, making it the natural tool for growth stories, recoveries, and anything where the past misrepresents the future. Its weakness is its input: forecasts err, drift, and differ by provider. Used with revision checks, sector context, and a trailing-ratio cross-read, it turns from a trivia number into a working valuation instrument.
Next steps: pick one stock you follow, gather its trailing P/E, forward P/E, and the last three months of estimate revisions, and write down what the spread implies. Then repeat for a sector peer. If you want structured practice with valuation ratios, Finelo teaches the fundamentals interactively.
Frequently asked questions
What is a good forward P/E ratio?
There is no universal threshold. Judge the number against the company's sector, its own historical range, and the prevailing rate environment. A 15 can be expensive for a utility and cheap for a fast-growing software firm.
Why is the forward P/E lower than the trailing P/E for most companies?
Because earnings are usually expected to grow, next year's estimated EPS exceeds last year's reported EPS, shrinking the ratio. When the forward multiple is higher than trailing, the market expects earnings to decline.
How reliable are the earnings estimates behind forward P/E?
Consensus estimates are informed but imperfect; accuracy degrades with horizon length and with business volatility. Treat the ratio as a scenario built on assumptions, and check how estimates have been revised recently before trusting it.
Where can I find forward P/E data?
Most brokerage platforms, fund fact sheets, and financial data sites publish forward multiples alongside trailing ones. Confirm which earnings definition and time window each source uses, since conventions differ between providers.
forwardp/eratiocomprehensive
Practice investing with Finelo
Build practical investing skills with guided lessons, simulator practice, and structured challenges.
About the author
Finelo Team
The Finelo Team creates practical investing and trading education designed to help beginners learn faster with structured challenges, simulator practice, and bite-sized lessons.
Keep reading — Related articles

Investing
Tax-gain harvesting vs. tax-loss harvesting
Compare realizing investment gains with realizing losses, including holding periods, wash sales, offsets, and portfolio tradeoffs.
Finelo Team

Investing
Stable value fund vs. money market fund
Compare investment structure, contract protections, transfer restrictions, net yields, and access inside a retirement account.
Finelo Team

Investing
Single-life vs. joint-life annuity
Compare income for one lifetime with continued payments to a survivor, using equal premiums and matching guarantee terms.
Finelo Team


