The information ratio measures how much extra return a portfolio earns above its benchmark for each unit of active risk taken. You calculate it by dividing excess return by tracking error. A higher information ratio means a manager beats the benchmark more consistently, not just occasionally.
Understanding the Information Ratio and How to Use It
The information ratio measures how much extra return a portfolio earns above its benchmark for each unit of active risk taken. You calculate it by dividing excess return by tracking error. A higher information ratio…
6 min read
Practice investing with Finelo
Build practical investing skills with guided lessons, simulator practice, and structured challenges.
Want to learn more?
Build practical investing skills with guided lessons, simulator practice, and structured challenges.
Explore FineloExplore Finelo's 28-day challenges
Turn learning into a daily habit with guided challenge paths.
This page is for investors comparing funds or evaluating their own results against an index. You will learn the formula, a worked example, how the metric differs from the Sharpe ratio, and its limits. Everything here is educational, not financial advice.
What is the information ratio?
Beating a benchmark once proves little; anyone can get lucky in a single year. The information ratio, often abbreviated IR, asks a tougher question: when a portfolio deviates from its benchmark, does it get paid reliably for those deviations?
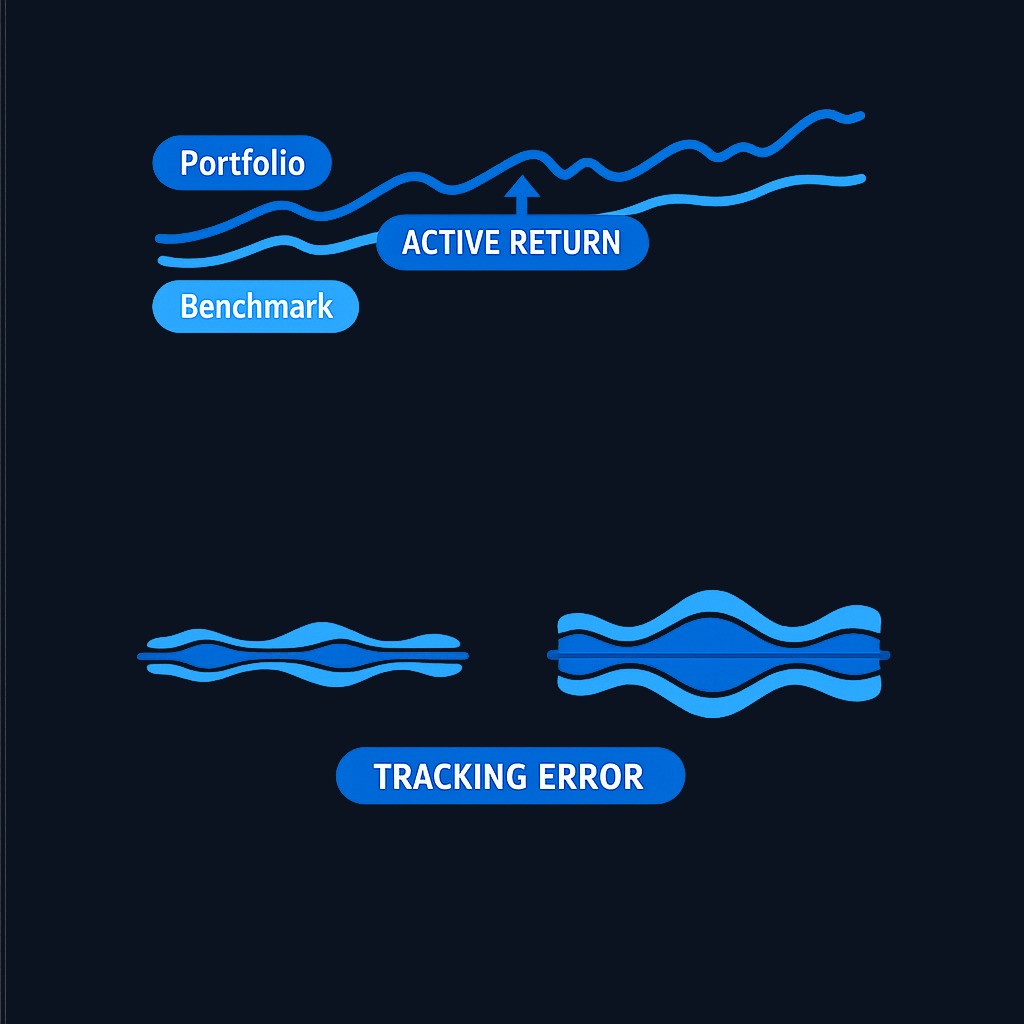
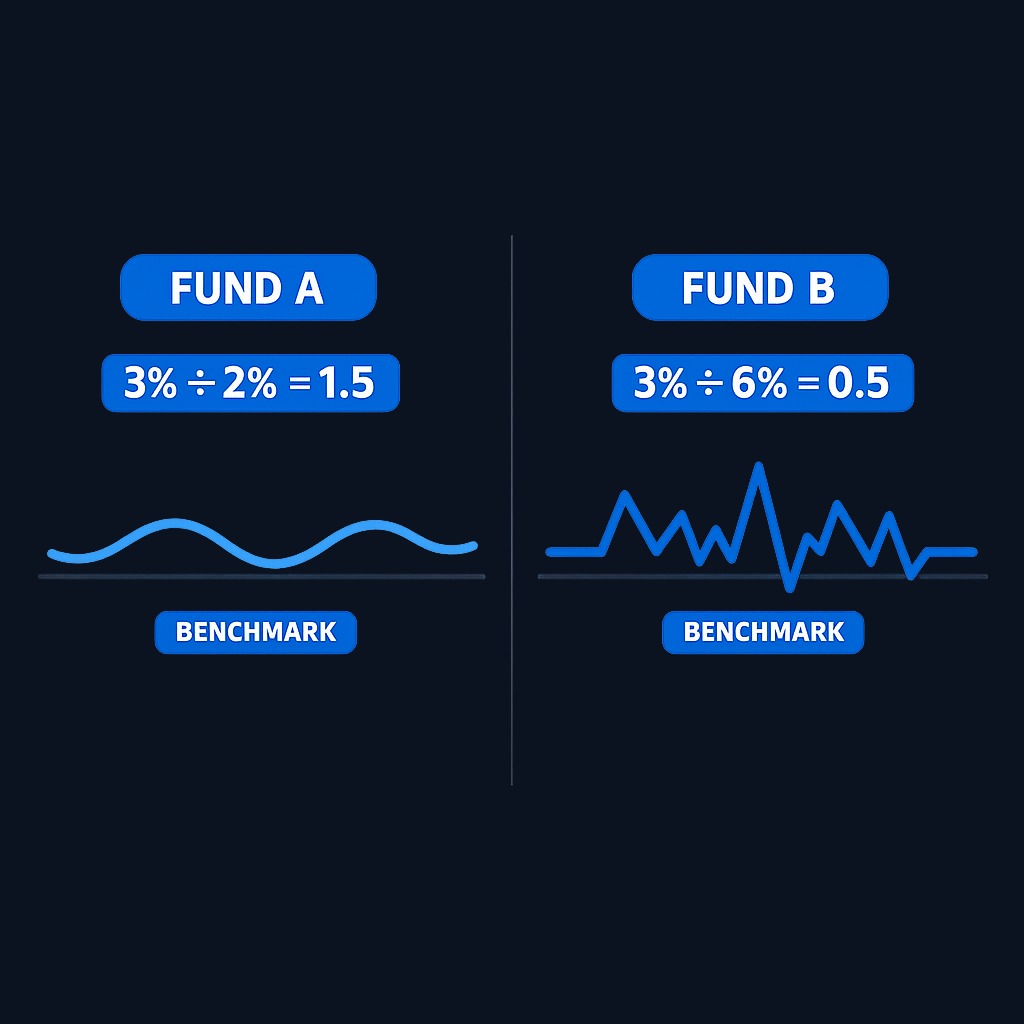
The numerator is active return, the portfolio's return minus the benchmark's return. The denominator is tracking error, the volatility of that active return over time. A manager who beats the index by 2% a year with steady, small deviations shows skill. A manager with the same 2% average but wild year-to-year swings around the benchmark shows noise. The information ratio separates the two.
How to calculate the information ratio
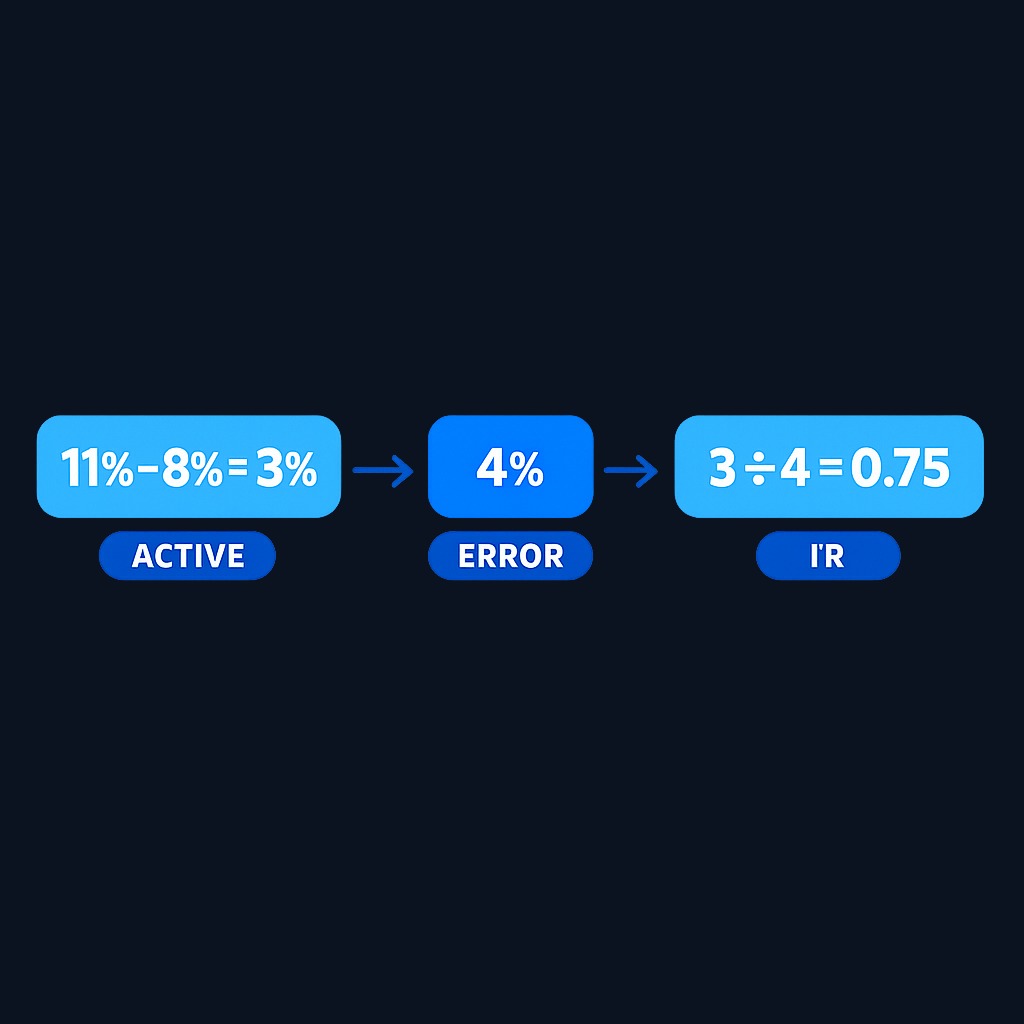
Information ratio = (portfolio return - benchmark return) ÷ tracking error
Worked example
A fund returns 11% while its benchmark returns 8%, so active return is 3%. The fund's tracking error, the standard deviation of its active returns, is 4%. The information ratio is 3 ÷ 4 = 0.75.
| Input | Fund A | Fund B |
|---|---|---|
| Portfolio return | 11% | 11% |
| Benchmark return | 8% | 8% |
| Active return | 3% | 3% |
| Tracking error | 4% | 9% |
| Information ratio | 0.75 | 0.33 |
Both funds beat the benchmark by the same margin, but Fund A did it with far steadier deviations, earning a higher IR. As a rough convention, sustained ratios near 0.5 are considered good and near 1.0 excellent, though few managers hold high ratios for long periods. Measure over multiple years, since short windows are dominated by luck.
Why the information ratio matters
Active management costs more than indexing, so the question every investor faces is whether the extra fees buy real skill. The information ratio is one of the cleanest tools for that judgment because it is benchmark-relative: it evaluates exactly the job an active manager is hired to do.
It also enables fair comparisons. Two funds with different styles can both be measured on how efficiently they convert active risk into active return against their own benchmarks. Consistency is the point: an investor can stomach small, steady deviations far more easily than violent swings, even when long-run averages match. Institutions use IR heavily when hiring and firing managers for precisely this reason.
Information ratio vs Sharpe ratio
| Feature | Information ratio | Sharpe ratio |
|---|---|---|
| Compares against | A chosen benchmark | The risk-free rate |
| Risk measure | Tracking error (active risk) | Total volatility |
| Question answered | Is active management adding value? | Is total risk being rewarded? |
| Best for | Judging managers vs an index | Judging standalone portfolios |
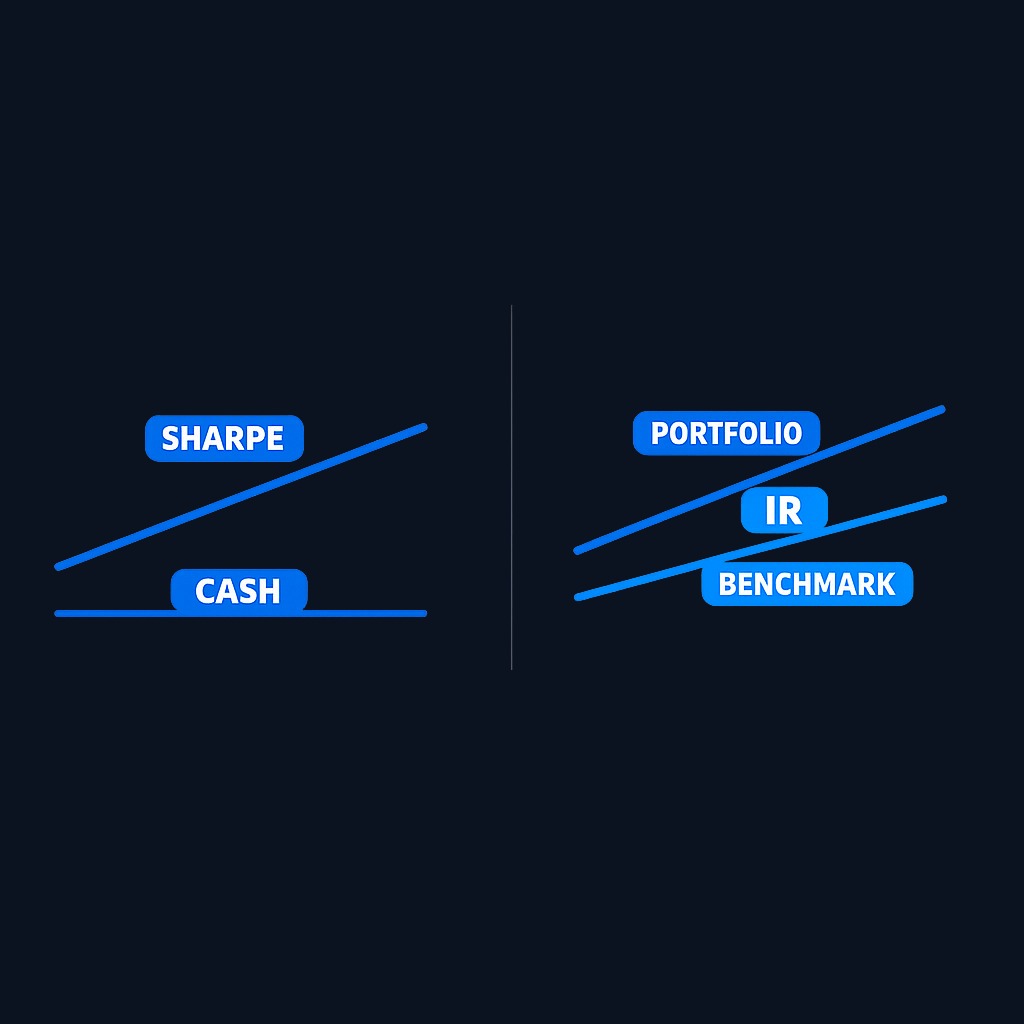
The Sharpe ratio evaluates a portfolio in isolation: return above cash, divided by total volatility. The information ratio evaluates a portfolio against a specific alternative you could hold instead, such as an index fund. A portfolio can post a strong Sharpe ratio while trailing its benchmark, and a strong IR while being volatile in absolute terms. Use Sharpe to judge whether the overall ride compensates you; use IR to judge whether paying for active decisions is worthwhile.
Practice investing with Finelo
Build practical investing skills with guided lessons, simulator practice, and structured challenges.
Real-world applications
Fund selection is the classic use: comparing several large-cap funds against the same index, the one with the higher long-run information ratio has historically converted active bets into benchmark-beating results more reliably. Manager monitoring is another: institutions set IR expectations and review whether a manager's ratio decays as assets grow, a common pattern since size makes active deviation harder.
Self-assessment may be the most useful application for individuals. If you pick stocks, compute your own IR against a low-cost index fund over several years. Many DIY investors discover their active return is negative or their tracking error enormous, which is exactly the insight the metric exists to deliver. One practical caveat for taxable accounts: active strategies usually trade more, and realized gains are taxable events, as the IRS explains in its overview of capital gains and losses, so after-tax IR can look worse than the headline number.
What to know before deciding
The information ratio has real limits. It depends entirely on choosing the right benchmark: measured against the wrong index, the ratio is meaningless. It is backward-looking, and high past ratios routinely fade. It treats upside and downside deviations identically, so a manager punished for beneficial deviations can look worse than a steady mediocre one. And it says nothing about fees paid, style drift, or whether returns came from leverage. Use IR alongside expense ratios, longer track records, and an understanding of how a manager invests, and never let one statistic hire or fire a fund on its own.
Decision framework: using the information ratio in fund choices
- Confirm the benchmark fits. The fund's stated benchmark should match its actual style; otherwise the ratio misleads.
- Require a multi-year window. Look for at least three to five years of data before trusting the number.
- Set a bar. Favor sustained ratios near 0.5 or better; treat brief spikes with skepticism.
- Net out costs. Compare the ratio against fees and the after-tax drag of active trading; a modest IR can vanish once expenses are deducted.
- Cross-check with other evidence. Pair IR with Sharpe ratio, drawdowns, and manager tenure before deciding to buy, hold, or replace a fund with an index alternative.
Conclusion and next steps
The information ratio distills active management into one number: excess return per unit of active risk. It rewards consistent benchmark-beating, exposes lucky streaks, and gives you a fair way to compare funds, managers, or your own stock picking against simply owning the index.
Next steps: pick one active fund you own or follow, find its benchmark, and estimate its active return and tracking error over the past five years. Then ask whether the ratio justifies the fees versus an index fund.
Frequently asked questions
What is a good information ratio?
Sustained ratios around 0.5 are commonly viewed as good and around 1.0 as excellent. Very few managers maintain high ratios over long periods, which is itself a useful fact when weighing active funds against index alternatives.
How is the information ratio different from alpha?
Alpha measures excess return after adjusting for market risk; it is a return figure. The information ratio divides active return by the volatility of that active return, adding a consistency dimension alpha alone does not capture.
Can the information ratio be negative?
Yes. A negative IR means the portfolio underperformed its benchmark on average over the period measured. Persistent negative ratios are a strong argument for switching to low-cost index exposure.
What time period should I use to evaluate it?
Longer is better; three to five years is a common minimum. Short windows are dominated by luck, and the ratio's value comes from revealing whether outperformance repeats across different market conditions.
informationratio
Practice investing with Finelo
Build practical investing skills with guided lessons, simulator practice, and structured challenges.
About the author
Finelo Team
The Finelo Team creates practical investing and trading education designed to help beginners learn faster with structured challenges, simulator practice, and bite-sized lessons.
Keep reading — Related articles

Investing
Tax-gain harvesting vs. tax-loss harvesting
Compare realizing investment gains with realizing losses, including holding periods, wash sales, offsets, and portfolio tradeoffs.
Finelo Team

Investing
Stable value fund vs. money market fund
Compare investment structure, contract protections, transfer restrictions, net yields, and access inside a retirement account.
Finelo Team

Investing
Single-life vs. joint-life annuity
Compare income for one lifetime with continued payments to a survivor, using equal premiums and matching guarantee terms.
Finelo Team


