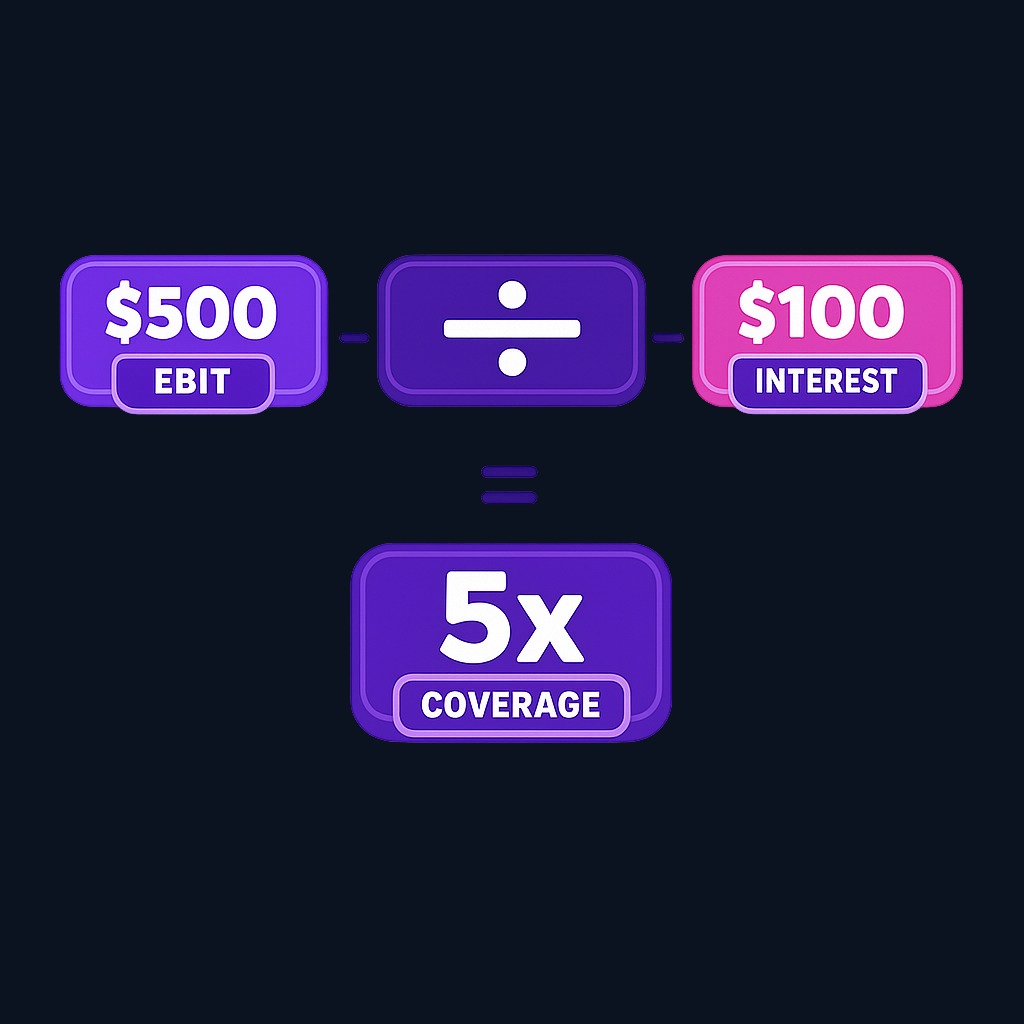
The interest coverage ratio (ICR) measures how easily a company can pay the interest on its debt from its operating earnings. You calculate it by dividing EBIT, earnings before interest and taxes, by interest expense for the same period. A ratio of 5 means operating profit covers interest payments five times over; a ratio near 1 means almost every operating dollar goes to lenders.
Understanding the Interest Coverage Ratio: A Comprehensive Guide
The interest coverage ratio (ICR) measures how easily a company can pay the interest on its debt from its operating earnings. You calculate it by dividing EBIT, earnings before interest and taxes, by interest expense…
8 min read
Practice investing with Finelo
Build practical investing skills with guided lessons, simulator practice, and structured challenges.
Want to learn more?
Build practical investing skills with guided lessons, simulator practice, and structured challenges.
Explore FineloExplore Finelo's 28-day challenges
Turn learning into a daily habit with guided challenge paths.
This page is for beginner investors who want to judge whether a company's debt load is safe. You will learn the formula and its variations, how to interpret the result, what distorts it, how companies improve it, and a framework for using the interest coverage ratio in real analysis. Everything here is educational, not financial advice.
What is the interest coverage ratio?
The interest coverage ratio is a solvency and safety metric. Where liquidity ratios ask whether a company can pay all its near-term bills, the ICR asks a sharper question: can earnings comfortably service the interest expense on existing debt?
Debt itself is neither good nor bad. Borrowing lets a business fund growth without diluting shareholders, and interest is simply the recurring cost of that capital. Trouble starts when operating earnings shrink toward the size of the interest bill. At that point the company loses room to invest, faces pressure from lenders, and risks default if conditions worsen. The ICR quantifies the cushion between the profits a business earns and the interest it owes. That is why lenders, credit analysts, and equity investors all track it.
How to calculate the interest coverage ratio
The standard formula:
Interest coverage ratio = EBIT ÷ interest expense
Both inputs come from the income statement. EBIT is operating profit before financing costs and taxes; interest expense is the period's cost of borrowed money.
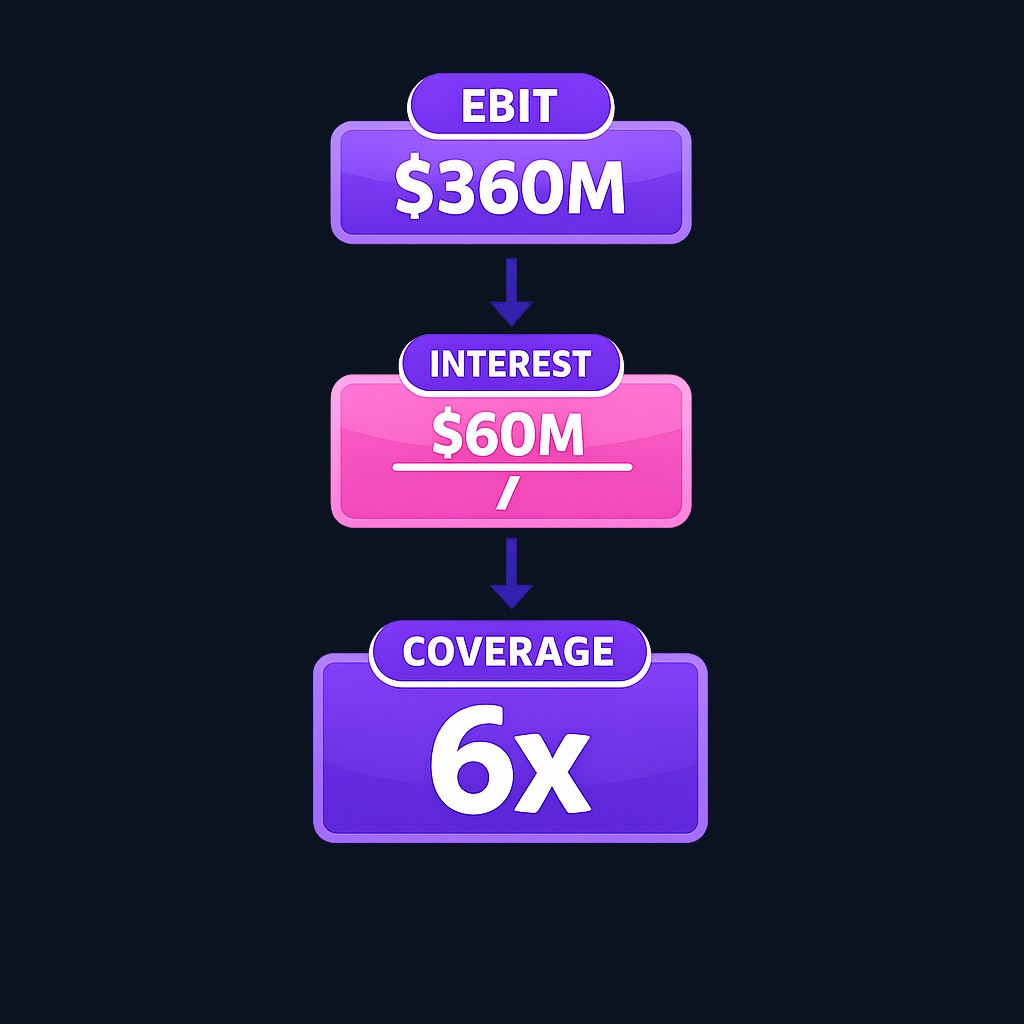
Example: a company reports EBIT of $360 million and interest expense of $60 million. ICR = 360 ÷ 60 = 6. Operating earnings could pay the interest bill six times, a comfortable cushion in most industries.
Common variations tighten or loosen the test:
- EBITDA coverage uses earnings before interest, taxes, depreciation, and amortization. It runs higher than the EBIT version because non-cash charges are added back, so it flatters asset-heavy companies.
- EBIT less capex coverage subtracts capital spending first, a stricter view of what earnings are truly available after the reinvestment a business requires.
- Cash interest coverage uses cash interest actually paid, useful when accrued and paid interest differ.
Whichever version you use, apply it consistently across companies and time periods. Mixing an EBITDA-based number from one source with an EBIT-based number from another makes any comparison meaningless.
Why the interest coverage ratio matters
- Default early warning. Deteriorating coverage is one of the clearest signals that debt stress is building, often visible several quarters before a crisis.
- Credit quality. Rating agencies and lenders weigh coverage heavily when setting credit ratings and loan terms. Those terms then feed back into the company's future borrowing costs.
- Covenant tripwires. Many loan agreements require the borrower to keep coverage above a set level; breaching such a covenant can trigger penalties or immediate repayment demands.
- Equity risk lens. For shareholders, thin coverage means profits are hostage to the debt schedule, and dividends or buybacks are usually the first casualties when the cushion shrinks.
- Rate sensitivity. Companies with floating-rate debt can watch interest expense climb when rates rise. The ratio compresses even while the business performs steadily.
A company with strong coverage owns its choices; a company with weak coverage negotiates them with creditors.
Interpreting the interest coverage ratio
| ICR level | Typical reading |
|---|---|
| Below 1 | Earnings cannot cover interest; serious distress signal |
| 1 to 1.5 | Barely covering; little room for any setback |
| 1.5 to 3 | Adequate but thin; watch the trend closely |
| 3 to 6 | Comfortable for most established businesses |
| Above 6 | Strong cushion; debt is well controlled |
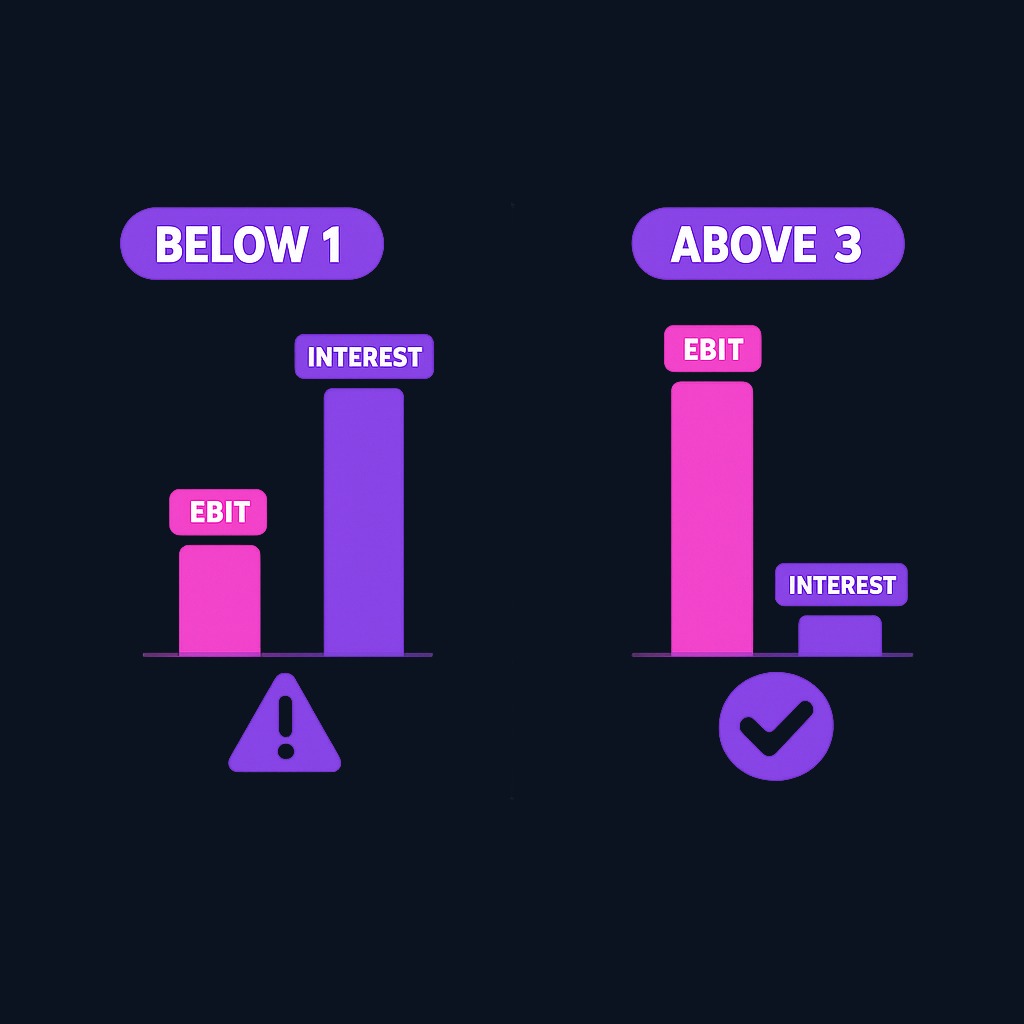
Context adjusts every band. Stable, regulated businesses like utilities operate safely at lower coverage because their revenue is predictable. Cyclical companies such as airlines, miners, and retailers need thicker cushions. Their EBIT can halve in a downturn. The trend also outweighs the level. A slide from 8 to 4 to 2.5 across three years tells a story that one healthy snapshot would hide. Always read the ratio across several periods and against direct industry peers.
Practice investing with Finelo
Build practical investing skills with guided lessons, simulator practice, and structured challenges.
Common pitfalls in calculating and reading the ICR
- One-time items in EBIT. Asset-sale gains or restructuring charges can inflate or crush a single period's operating profit. Strip unusual items before trusting the ratio.
- Capitalized interest. Some companies capitalize part of their interest into asset costs rather than expensing it, which makes reported interest expense look smaller than the true cash obligation.
- Seasonal earnings. For businesses that earn most profit in one season, an annual or trailing-twelve-month EBIT is honest; a single strong quarter is not.
- EBITDA flattery. Adding back depreciation helps companies whose assets genuinely need replacing look safer than they are. Machines wear out; the add-back does not repay lenders.
- Ignoring principal. The ICR covers interest only. A company can cover interest comfortably yet still face a wall of principal maturities it cannot refinance; check the debt maturity schedule separately.
- Leases and hybrids. Lease obligations and convertible instruments blur the line between interest and other fixed charges; a fixed-charge coverage ratio catches what the ICR misses.
The theme across all six: the ratio is only as honest as its inputs. Two minutes with the income statement's footnotes prevents most misreads.
How companies improve their interest coverage ratio
Understanding the levers helps investors judge whether an improving ratio reflects real progress:
- Grow operating earnings. Higher revenue or better margins expand EBIT, the healthiest route to stronger coverage.
- Pay down debt. Reducing principal cuts future interest expense directly, compounding the improvement each year.
- Refinance expensive borrowing. Replacing high-rate debt with cheaper or fixed-rate debt lowers the interest bill, though the window depends on market conditions.
- Restructure the maturity profile. Spreading maturities avoids concentrated refinancing risk that can spike costs at the worst moment.
- Sell non-core assets. Divestitures can fund debt reduction, trading some earnings for a sturdier balance sheet.
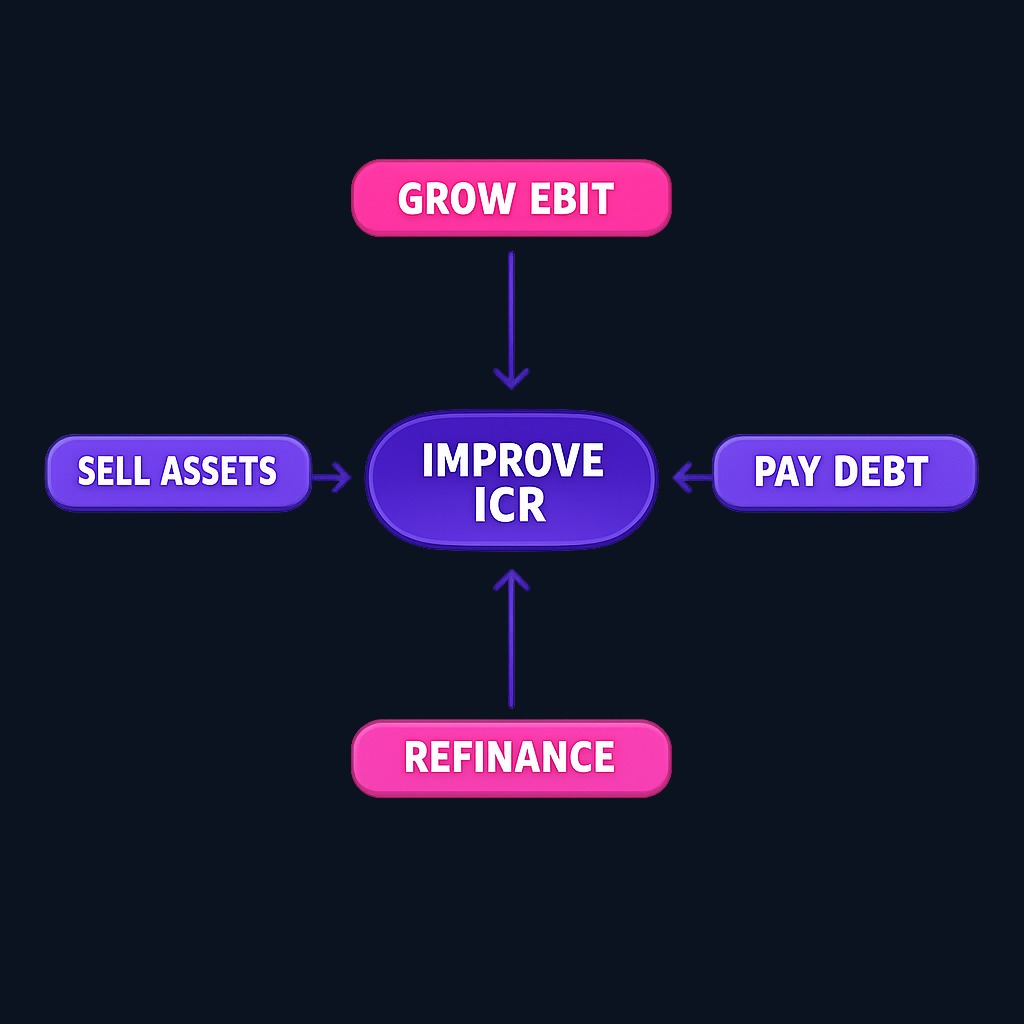
Watch the composition of an improvement. Coverage that rises because EBIT grew signals operating strength. Coverage that rises only because the company slashed investment to repay debt may be borrowing from its own future.
What to know before deciding
Before using the ICR in an investment decision, verify three things. First, the formula behind any number you did not compute yourself. EBIT and EBITDA versions differ materially, and data providers mix them. Second, the quality of the period: confirm EBIT was not propped up by one-time gains and that interest expense reflects the full obligation, including capitalized portions. Third, the refinancing picture: coverage measures the interest burden today, not the terms the company will face when its debt rolls over. A business can show adequate coverage yet face large near-term maturities in a rising-rate market. That risk never appears in the ratio.
Decision framework: using the ICR in your analysis
- Compute the EBIT-based ratio for at least three years. The direction matters more than the level.
- Benchmark against industry peers. Compare cyclicals to cyclicals and utilities to utilities.
- Stress-test it. Ask what the ratio becomes if EBIT falls by a third; for cyclical firms, that scenario is a matter of when, not if.
- Cross-check with the maturity schedule and cash flow. Interest coverage plus refinancing risk plus free cash flow gives the full debt picture.
- Watch covenant levels. If disclosed, know how close the company sits to its required minimums.
- Then weigh the equity case. Thin coverage does not forbid investment, but it demands a bigger margin of safety in the price you pay.
The same cushion logic applies to personal finances: regulators encourage households to keep a liquid emergency fund so surprise expenses never force debt distress, which is precisely what the ICR tests at company scale.
Conclusion and next steps
The interest coverage ratio distills debt safety into one division: operating earnings over interest expense. Compute it consistently, read it across years and against peers, stress-test it for a downturn, and pair it with the maturity schedule before judging any leveraged business. Companies with durable coverage control their own destiny; companies without it answer to their lenders.
Next steps: pick one company you follow, pull three years of EBIT and interest expense from its income statements, and chart the trend. Then compare the result to one direct competitor. For structured, beginner-friendly training on ratios like this, Finelo offers guided investing education you can take at your own pace.
Frequently asked questions
What is a good interest coverage ratio?
Above 3 is comfortable for most established companies, and above 6 is strong. Stable businesses with predictable revenue can run lower safely, while cyclical firms need more cushion. The multi-year trend and industry norm matter more than any single reading.
What does an interest coverage ratio below 1 mean?
Operating earnings for the period were smaller than the interest bill. The company had to draw on cash, sell assets, or borrow more just to service existing debt. Sustained coverage below 1 is a classic precursor to restructuring or default.
Should I use EBIT or EBITDA for the interest coverage ratio?
EBIT is the stricter, more conservative test because it charges the business for depreciation, a real economic cost. EBITDA coverage is common in lending contexts but flatters asset-heavy companies. Whichever you choose, stay consistent across every company you compare.
How is the interest coverage ratio different from the debt-to-equity ratio?
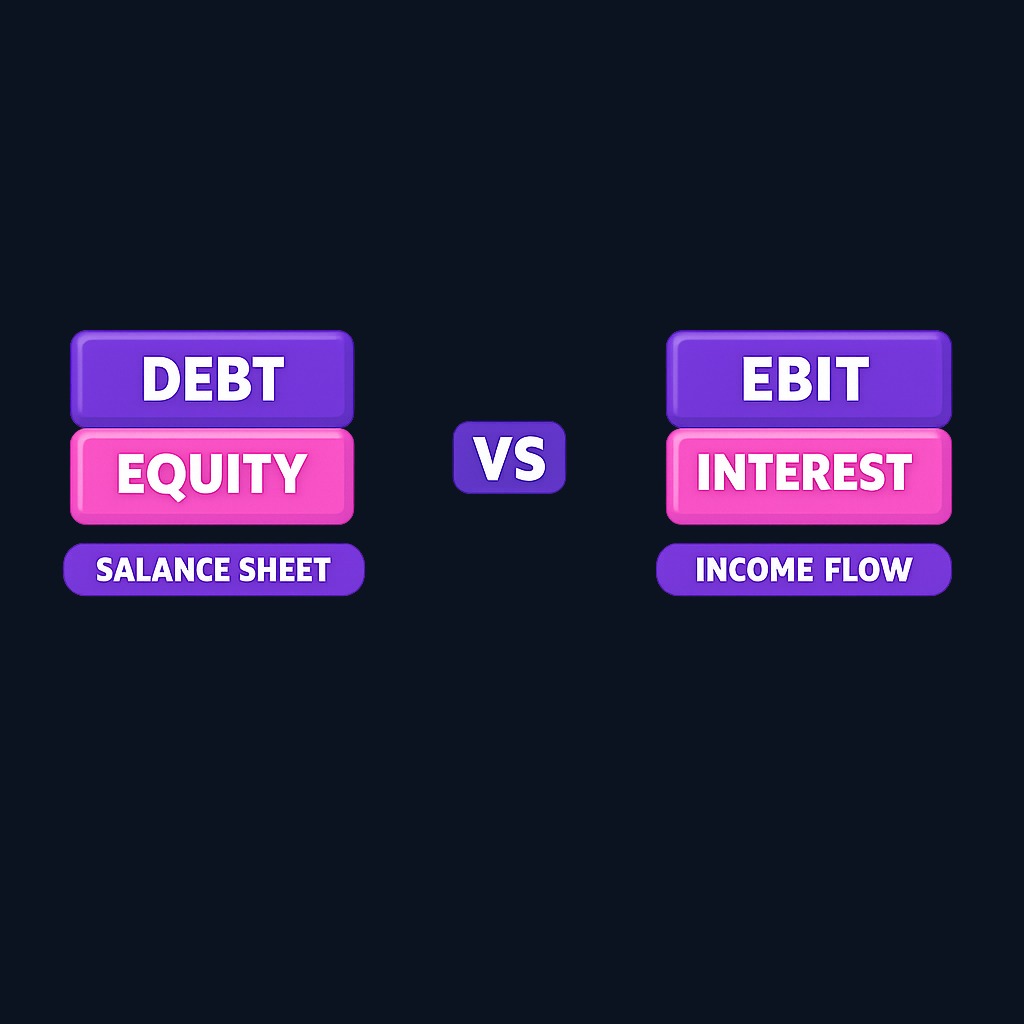
Debt-to-equity measures how much a company has borrowed relative to owner capital, a balance-sheet snapshot. The ICR measures whether earnings can service that borrowing, an income-statement flow. Read together, they show both the size of the debt and the ability to carry it.
interestcoverageratiocomprehensive
Practice investing with Finelo
Build practical investing skills with guided lessons, simulator practice, and structured challenges.
About the author
Finelo Team
The Finelo Team creates practical investing and trading education designed to help beginners learn faster with structured challenges, simulator practice, and bite-sized lessons.
Keep reading — Related articles

Investing
Tax-gain harvesting vs. tax-loss harvesting
Compare realizing investment gains with realizing losses, including holding periods, wash sales, offsets, and portfolio tradeoffs.
Finelo Team

Investing
Stable value fund vs. money market fund
Compare investment structure, contract protections, transfer restrictions, net yields, and access inside a retirement account.
Finelo Team

Investing
Single-life vs. joint-life annuity
Compare income for one lifetime with continued payments to a survivor, using equal premiums and matching guarantee terms.
Finelo Team


