The price to book ratio compares a company's market value to the accounting value of what it owns. You calculate it by dividing the stock price by book value per share. A P/B of 1 means the market prices the company at exactly its net asset value; below 1 can signal a potential bargain or a business in trouble.
Understanding the Price to Book Ratio
The price to book ratio compares a company's market value to the accounting value of what it owns. You calculate it by dividing the stock price by book value per share. A P/B of 1 means the market prices the company at…
6 min read
Practice investing with Finelo
Build practical investing skills with guided lessons, simulator practice, and structured challenges.
Want to learn more?
Build practical investing skills with guided lessons, simulator practice, and structured challenges.
Explore FineloExplore Finelo's 28-day challenges
Turn learning into a daily habit with guided challenge paths.
This page is for investors learning to judge whether a stock is cheap or expensive relative to its assets. You will learn the formula, worked examples, industry context, and the metric's blind spots. Everything here is educational, not financial advice.
What is the price to book ratio?
Book value is what remains if a company sold its assets and paid off its liabilities, the accounting net worth recorded on the balance sheet. The price to book ratio, often written P/B, asks how the market's price for the company compares to that accounting value.
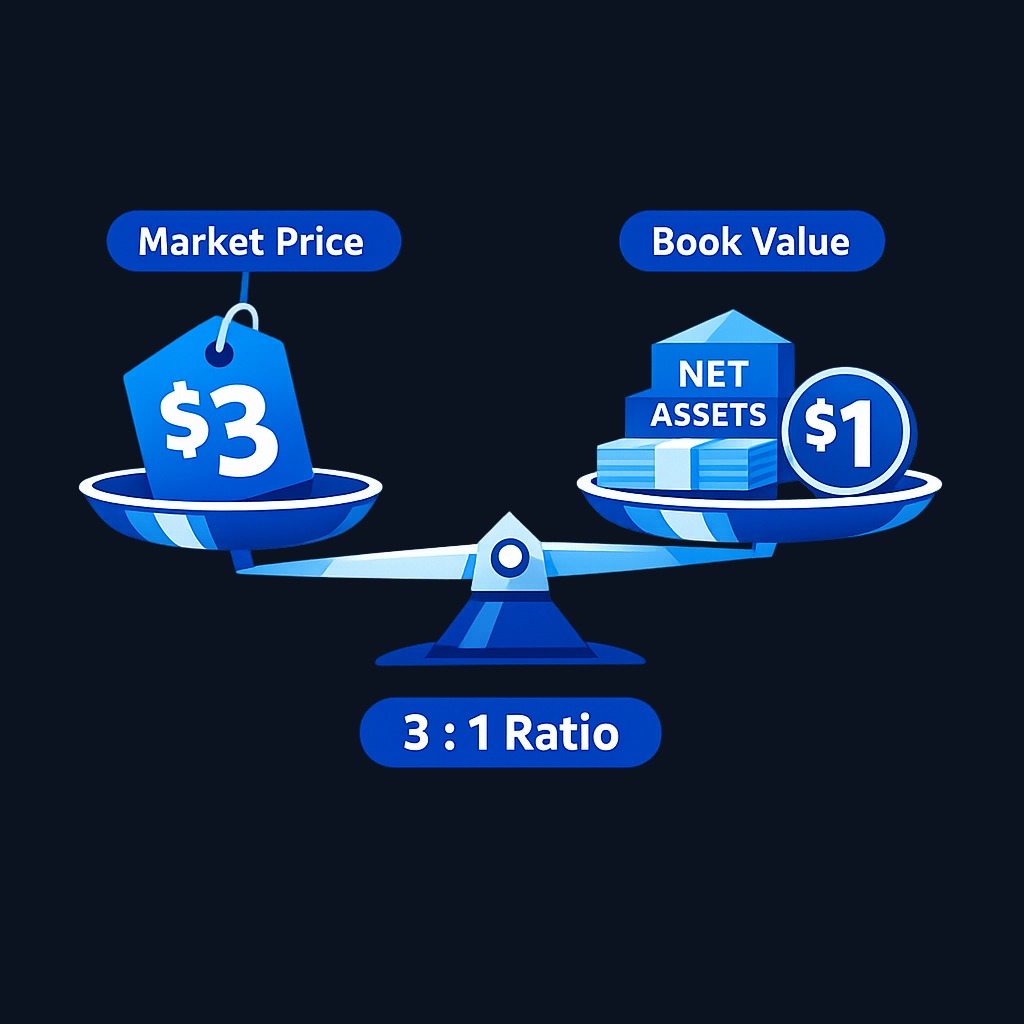
A P/B of 3 means investors pay three dollars for every dollar of recorded net assets. They are betting the business will earn far more than its assets alone suggest. A P/B below 1 means the market values the company at less than its net assets, which can point to deep pessimism, hidden problems, or a genuine value opportunity. Value investors have long screened for low P/B stocks for exactly this reason, though a low number is the start of the research, never the conclusion.
How to calculate the price to book ratio
Two equivalent formulas:
P/B = market capitalization ÷ total book value (shareholders' equity)
P/B = share price ÷ book value per share
Book value per share is shareholders' equity divided by shares outstanding.
Worked example
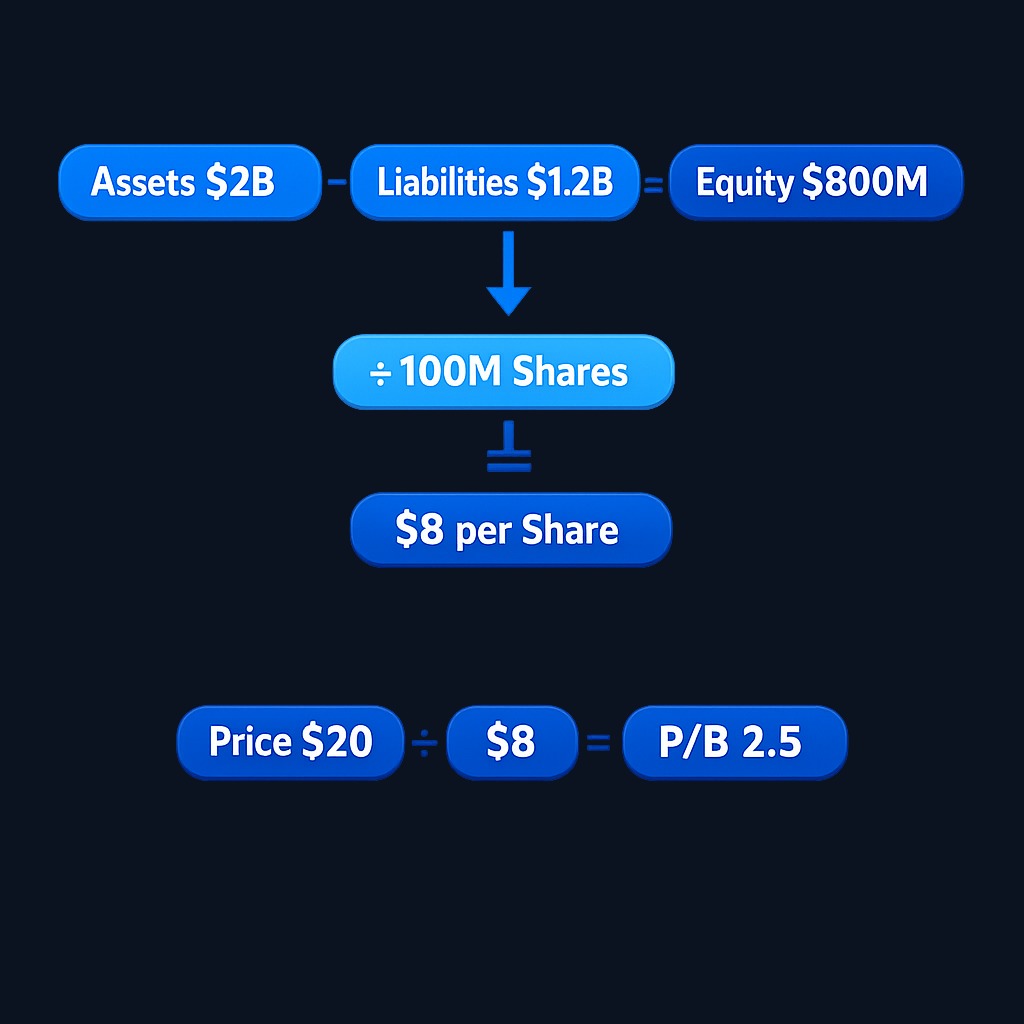
A company has $2 billion in assets, $1.2 billion in liabilities, and 100 million shares outstanding. Book value is $800 million, so book value per share is $8. If the stock trades at $20, the price to book ratio is 20 ÷ 8 = 2.5.
| Input | Value |
|---|---|
| Assets | $2.0B |
| Liabilities | $1.2B |
| Book value (equity) | $0.8B |
| Shares outstanding | 100M |
| Book value per share | $8.00 |
| Share price | $20.00 |
| P/B ratio | 2.5 |
Interpreting the price to book ratio
| P/B value | Common reading |
|---|---|
| Below 1 | Market prices the firm below net assets; bargain or warning |
| Around 1-2 | Modest premium to book value |
| 2-4 | Market expects solid returns on assets |
| Above 4 | Value driven mostly by intangibles or high expected growth |
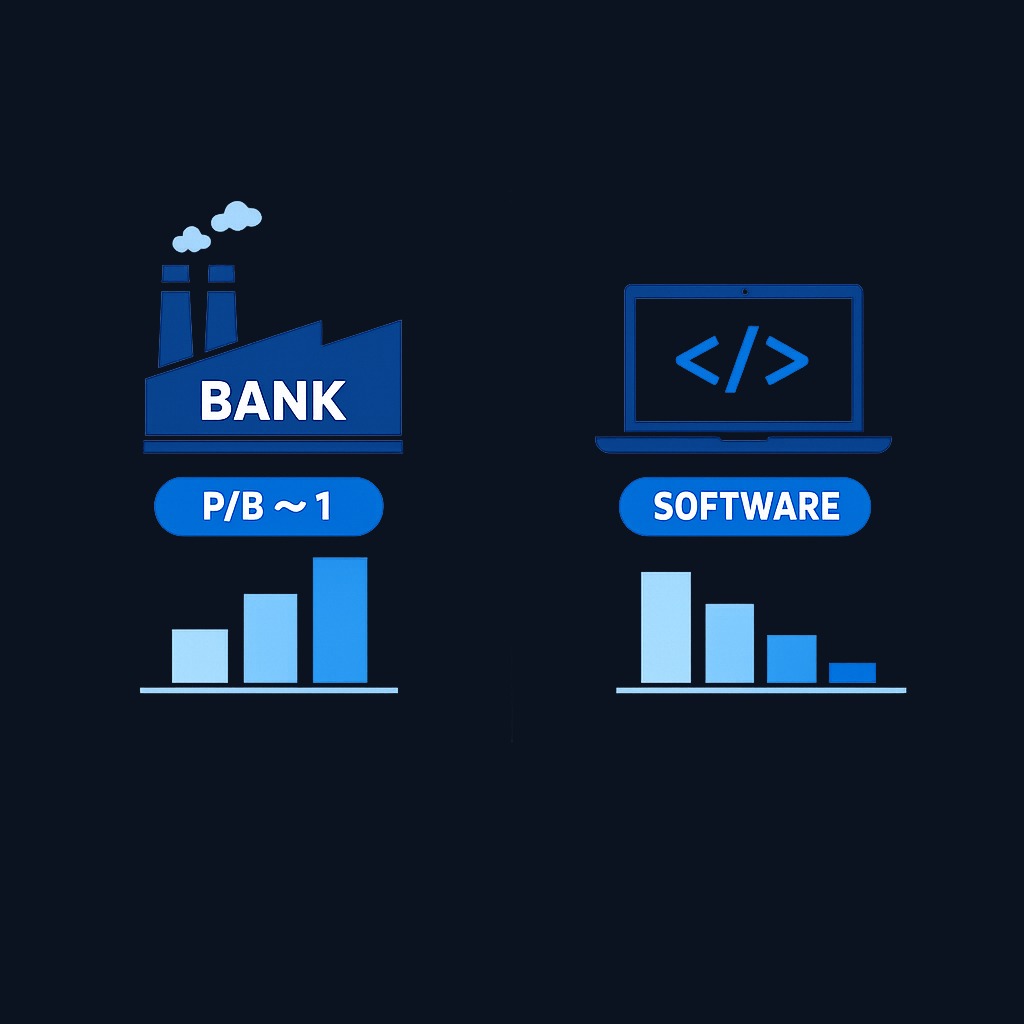
Context decides which reading is right. A bank trading at 0.8 times book might be cheap if its loan book is sound, or fairly priced if bad loans are coming. A software firm at 10 times book is not automatically overvalued; its real assets are code, brands, and people, which barely appear on the balance sheet.
Industry variations
Asset-heavy industries, banks, insurers, utilities, and manufacturers, keep most of their value on the balance sheet, so they commonly trade near book value. Asset-light industries, such as software and consumer brands, run high P/B ratios because their most valuable assets are largely invisible to accounting rules. Use the price to book ratio to compare companies within the same industry, and be cautious across industries: ranking a bank against a software firm on P/B mostly reflects accounting conventions.
What is included in book value
Book value equals recorded assets minus liabilities, but what gets recorded matters:
- Included: cash, inventory, receivables, property, equipment, and acquired intangibles such as purchased patents or goodwill from takeovers.
- Missing: internally built brands, software, customer relationships, and expertise. Companies that grew their own intangibles show little of that value on the balance sheet.
- Distorted: assets carried at historical cost can drift far from today's market worth, and heavy share buybacks can shrink or even turn equity negative.
This is why two companies with similar real-world value can show wildly different book values. Before trusting a P/B figure, look at what actually sits in the denominator.

Practice investing with Finelo
Build practical investing skills with guided lessons, simulator practice, and structured challenges.
Value and comparison notes
P/B earns its keep in a few specific jobs. Screening: filtering a sector for its lowest P/B names quickly builds a value-candidate list. Financials analysis: for banks and insurers, whose assets and liabilities are mostly financial instruments carried near market value, P/B remains one of the most trusted checks. Downside framing: book value offers a rough floor estimate in distressed situations.
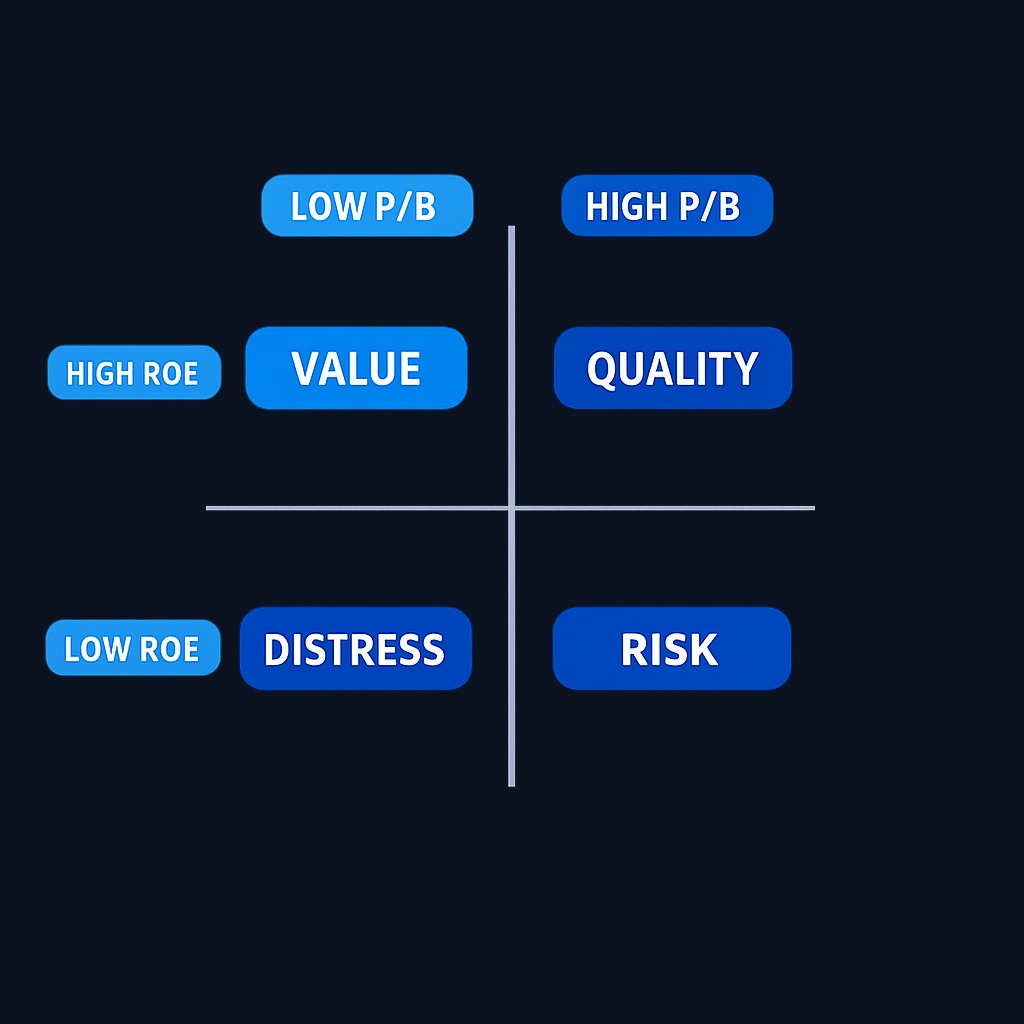
Compare P/B alongside return on equity: a company earning high returns on its equity usually deserves a higher multiple than one earning weak returns on the same asset base. Many investors read P/B together with the P/E ratio, since one prices the assets and the other prices the earnings those assets generate. A low price to book ratio plus healthy profitability and manageable debt is a far stronger signal than the ratio alone.
Plans, billing, and limits to verify
You can compute P/B by hand from any annual report, and most free screeners and broker apps display it automatically. If you use a paid data service or screener, verify what its plan includes before relying on it: how fresh the balance-sheet data is, whether book value reflects the latest quarterly filing, any limits on the number of screens or exports, and what the subscription bills after any promotional period. Data quality differences between providers are common, so spot-check a few companies against their official filings before you trust a screen's output.
What to know before deciding
Before acting on any P/B reading, verify the inputs. Check the date of the balance-sheet figures, whether recent write-downs or buybacks changed equity, and how much of book value is goodwill from past acquisitions. Confirm the share count is current. Remember the metric says nothing about earnings power, so pair it with profitability, debt, and cash flow. Selling a holding to rotate into value candidates can also create a taxable event; the IRS explains how capital gains and losses are treated, and the rules affect your net result. A single ratio should never make the decision on its own.
Conclusion and next steps
The price to book ratio distills the market's premium over accounting net worth into one number: share price divided by book value per share. It shines for asset-heavy businesses compared within one industry, and it misleads when intangibles, old cost records, or buybacks distort the denominator.
Next steps: pick one bank and one software company, compute both P/B ratios, and note how differently the numbers should be read. Then compare each against its direct peers and its own five-year history.
Frequently asked questions
What is a good price to book ratio?
There is no universal target. Below 1 attracts value hunters, while quality companies often trade at 2-4 times book. Judge the number against industry peers and the company's return on equity rather than a fixed cutoff.
Why do some great companies have very high P/B ratios?
Because their key assets, brands, software, and expertise, are not recorded on the balance sheet. Accounting understates their book value, which inflates the ratio without implying overvaluation.
When is the price to book ratio most useful?
For asset-heavy businesses, especially banks and insurers, where balance-sheet values sit close to market reality. It is least informative for asset-light companies built on intangibles.
Can the price to book ratio be negative?
Yes. Large accumulated losses or aggressive buybacks can push shareholders' equity below zero. A negative P/B is not meaningful as a ratio, but the underlying cause is worth investigating before investing.
pricebookratio
Practice investing with Finelo
Build practical investing skills with guided lessons, simulator practice, and structured challenges.
About the author
Finelo Team
The Finelo Team creates practical investing and trading education designed to help beginners learn faster with structured challenges, simulator practice, and bite-sized lessons.
Keep reading — Related articles

Investing
Tax-gain harvesting vs. tax-loss harvesting
Compare realizing investment gains with realizing losses, including holding periods, wash sales, offsets, and portfolio tradeoffs.
Finelo Team

Investing
Stable value fund vs. money market fund
Compare investment structure, contract protections, transfer restrictions, net yields, and access inside a retirement account.
Finelo Team

Investing
Single-life vs. joint-life annuity
Compare income for one lifetime with continued payments to a survivor, using equal premiums and matching guarantee terms.
Finelo Team


