The price to sales ratio compares what the market pays for a company to the revenue it generates. You calculate it by dividing market capitalization by annual sales, or share price by sales per share. A P/S of 2 means investors pay two dollars for every dollar of yearly revenue.
Price-to-Sales Ratio: Formula, Meaning, and Examples

The price to sales ratio compares what the market pays for a company to the revenue it generates. You calculate it by dividing market capitalization by annual sales, or share price by sales per share. A P/S of 2 means…
5 min read
Practice investing with Finelo
Build practical investing skills with guided lessons, simulator practice, and structured challenges.
Want to learn more?
Build practical investing skills with guided lessons, simulator practice, and structured challenges.
Explore FineloExplore Finelo's 28-day challenges
Turn learning into a daily habit with guided challenge paths.
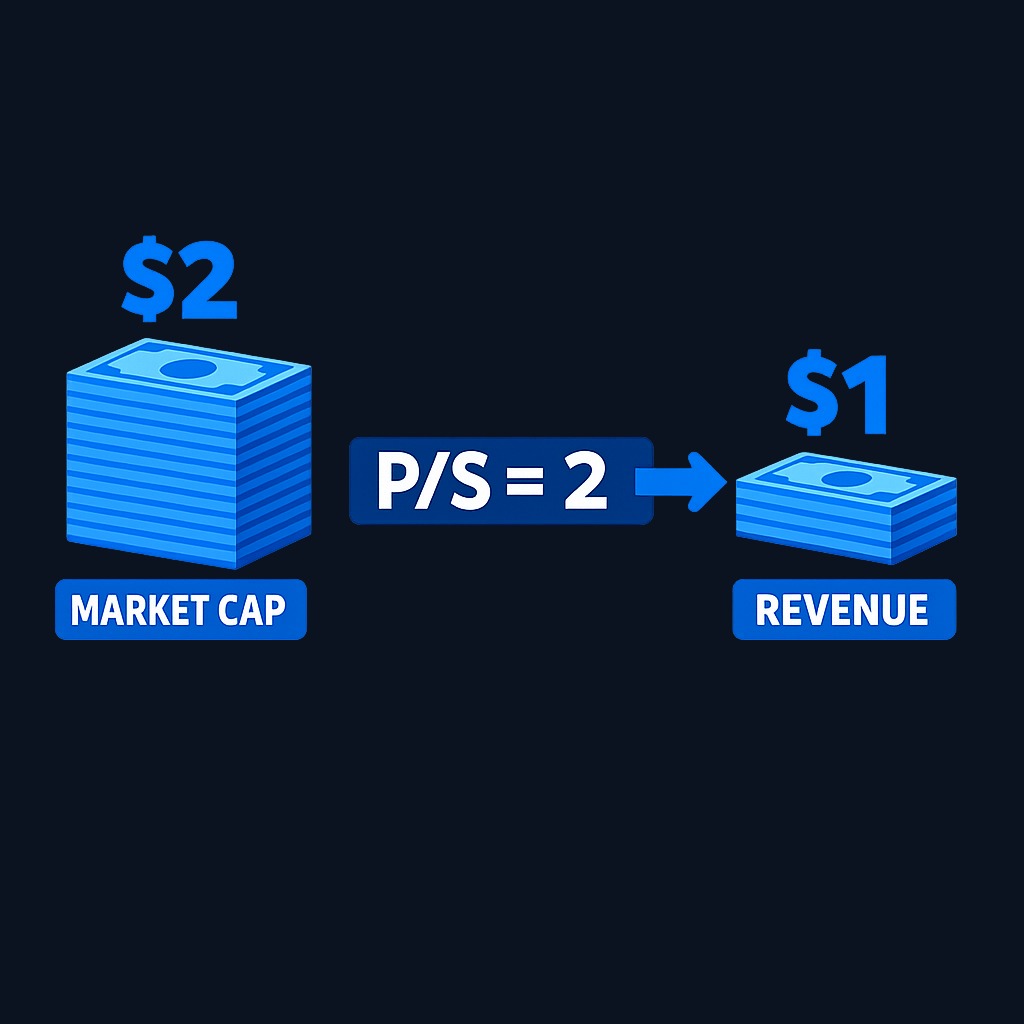
This page is for investors who want a valuation check that works even when a company has no profits yet. You will learn the formula, worked examples, interpretation bands, and the caveats that keep the number honest. Everything here is educational, not financial advice.
What is the price to sales ratio?
Earnings-based metrics like the P/E ratio break down when a company is unprofitable or when accounting choices distort the bottom line. Revenue sits higher up the income statement and is harder to massage, which makes the price to sales ratio a useful check for young companies, turnarounds, and cyclical businesses in a down year.
At its core, the ratio tells you the price the market attaches to every dollar the business brings in through the door. A low multiple can flag a potential bargain, and a high multiple signals that the market expects rapid growth or fat future margins. Because revenue says nothing about profitability, the P/S ratio is a starting filter rather than a final verdict.
How to calculate the price to sales ratio
Two equivalent formulas:
P/S = market capitalization ÷ total revenue (trailing 12 months)
P/S = share price ÷ revenue per share
Worked example
A company has 50 million shares trading at $30, giving a market cap of $1.5 billion. Trailing-year revenue is $750 million. The price to sales ratio is 1,500 ÷ 750 = 2.0.
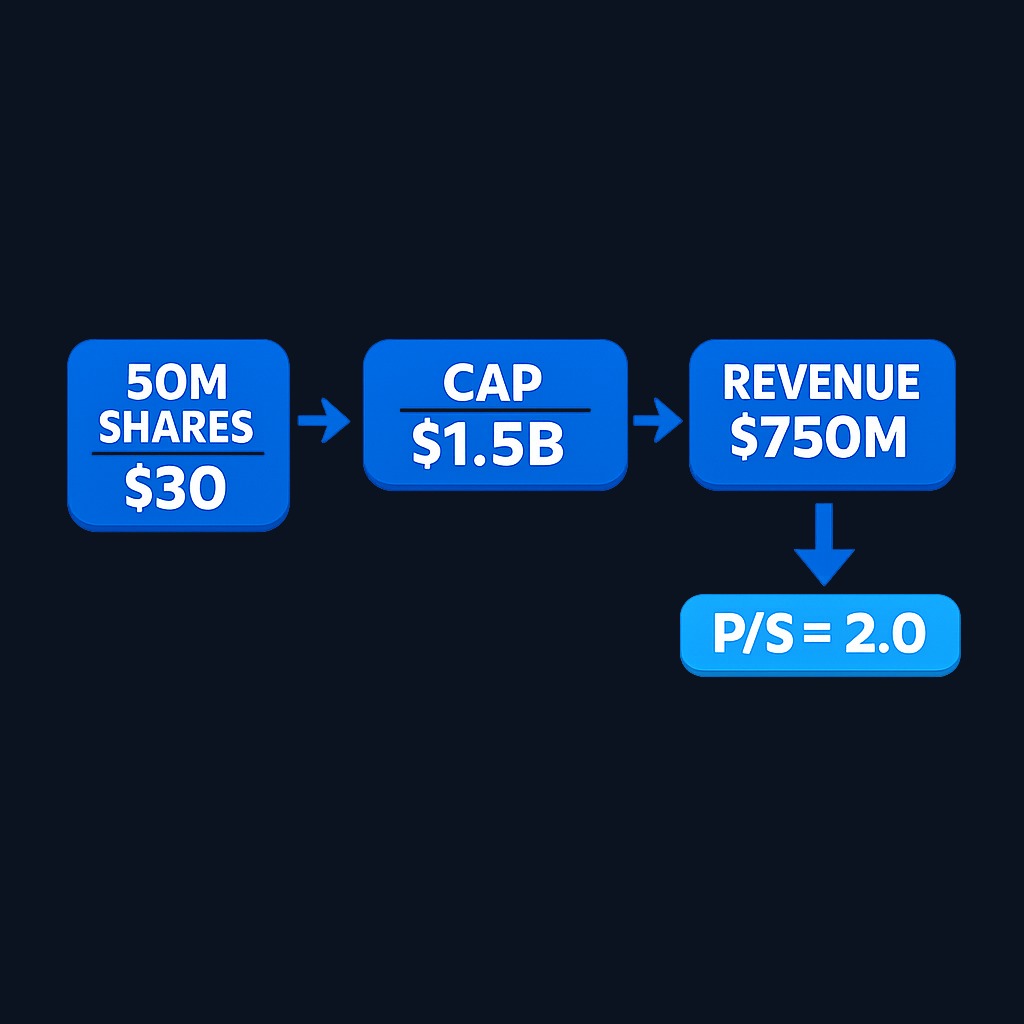
| Input | Value |
|---|---|
| Shares outstanding | 50M |
| Share price | $30.00 |
| Market capitalization | $1.5B |
| Trailing 12-month revenue | $750M |
| P/S ratio | 2.0 |
What is included in the inputs
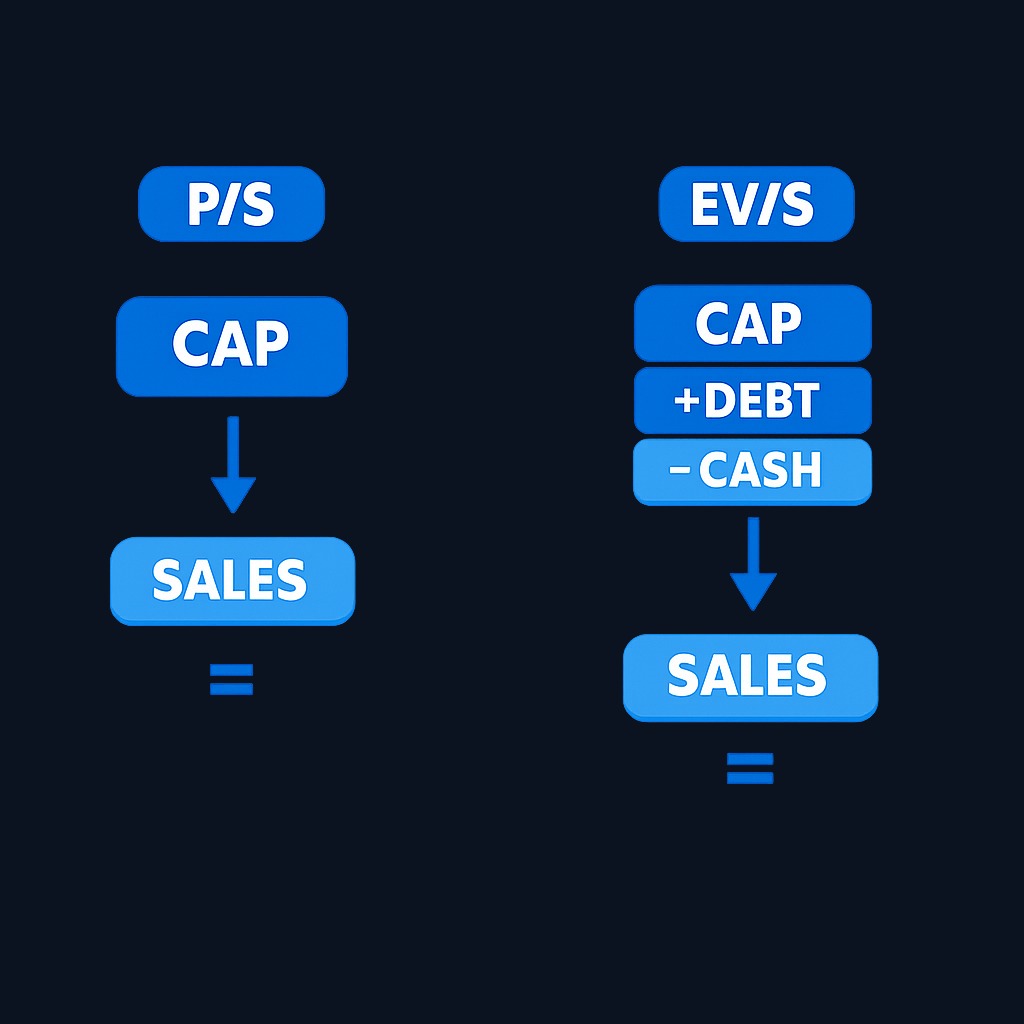
Use a matching pair: current market cap against the most recent trailing 12 months of revenue. Revenue includes all sales the company recognized under accounting rules, which can include items like deferred-contract adjustments. Some analysts prefer enterprise value to sales, which adds debt and subtracts cash, so heavily indebted companies do not look artificially cheap.
Interpreting the price to sales ratio
| P/S value | Common reading |
|---|---|
| Below 1 | Market pays less than a year's revenue; bargain or distress |
| 1-3 | Typical range for established businesses |
| 3-10 | Growth expectations or high-margin business models |
| Above 10 | Aggressive growth assumptions built into the price |
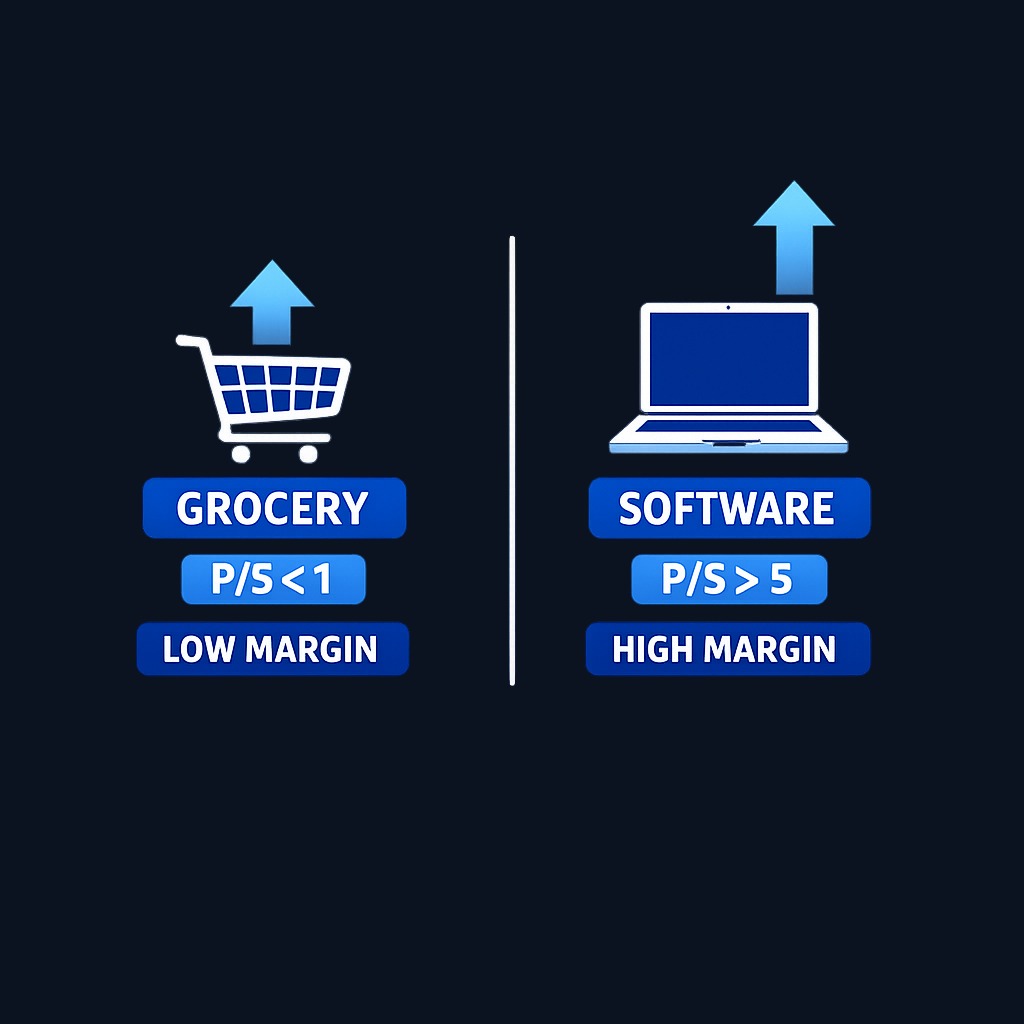
Margins decide what a sales dollar is worth. A grocery chain earning thin margins deserves a lower P/S than a software firm converting much of each sale into profit. Industry context matters for the same reason: retailers often trade below 1, while cloud software companies can sustain high multiples. Compare within a sector, and against a company's own history, before drawing conclusions.
Practice investing with Finelo
Build practical investing skills with guided lessons, simulator practice, and structured challenges.
Value and comparison notes
The P/S ratio is most valuable in three situations. Unprofitable growth companies: with no earnings to measure, revenue multiples are often the only sensible valuation anchor. Cyclical stocks: earnings swing violently across the cycle, while sales move less, so P/S offers a steadier comparison. Cross-checking a cheap P/E: if a stock looks cheap on earnings but expensive on sales, one-time gains may be flattering the bottom line.
Read the ratio alongside revenue growth and margins. A company at 8 times sales growing 40% a year with expanding margins can be a better value than a stagnant business at 1 times sales. Pairing P/S with the P/E ratio and free cash flow builds a fuller picture: sales set the scale of the business, and profitability determines what that scale is worth.
Plans, billing, and limits to verify
You can compute the price to sales ratio yourself from a company's filings, and most free screeners and broker apps display it automatically. If you rely on a paid screener or data service, verify what its plan includes before trusting the output: how current the revenue figures are, whether the tool uses trailing or forward sales, any limits on screens, exports, or watchlists, and what the service bills once any trial or promotional period ends. Cross-check a few companies against official filings, since providers update data on different schedules.
Pricing caveats
- Revenue is not profit. A company can grow sales forever and still never earn a dollar; the ratio ignores costs entirely.
- Debt is invisible. Market cap alone flatters leveraged firms; enterprise-value-to-sales fixes this.
- Revenue recognition varies. Different industries book sales differently, which muddies cross-sector comparisons.
- Low margins compress value. A dollar of low-margin revenue simply is not worth a dollar of high-margin revenue.
- Taxes affect realized results. If you rotate holdings based on valuation screens, selling winners can create taxable gains; the IRS overview of capital gains and losses explains how those are treated.
Verify the inputs behind any screen result, and never let a single multiple make the decision.
Conclusion and next steps
The price to sales ratio prices a company against its revenue: market cap divided by sales. It shines when earnings are absent or unreliable and misleads when margins or debt differ across the companies being compared.
Next steps: pick one profitable and one unprofitable company in the same sector, compute both P/S ratios, and note how growth and margins change what the numbers mean. Then compare each against sector peers.
Frequently asked questions
What is a good price to sales ratio?
There is no universal cutoff. Below 1 often attracts value hunters, while high-growth, high-margin businesses can justify much higher multiples. Judge the number against industry peers, margin profiles, and the company's own history.
When should I use P/S instead of P/E?
Use the price to sales ratio when earnings are negative, distorted by one-time items, or swinging with the economic cycle. Revenue provides a steadier base for comparison in those cases.
What is the difference between P/S and EV/Sales?
P/S uses market capitalization, while EV/Sales uses enterprise value, which adds debt and subtracts cash. EV/Sales gives a fairer comparison when companies carry very different debt loads.
Can the price to sales ratio be manipulated?
Less easily than earnings, but revenue recognition choices, one-time contract items, and acquisitions can still inflate sales. Reading the revenue footnotes in filings protects you from headline numbers.
pricesalesratio
Practice investing with Finelo
Build practical investing skills with guided lessons, simulator practice, and structured challenges.
About the author
Finelo Team
The Finelo Team creates practical investing and trading education designed to help beginners learn faster with structured challenges, simulator practice, and bite-sized lessons.
Keep reading — Related articles

Investing
Tax-gain harvesting vs. tax-loss harvesting
Compare realizing investment gains with realizing losses, including holding periods, wash sales, offsets, and portfolio tradeoffs.
Finelo Team

Investing
Stable value fund vs. money market fund
Compare investment structure, contract protections, transfer restrictions, net yields, and access inside a retirement account.
Finelo Team

Investing
Single-life vs. joint-life annuity
Compare income for one lifetime with continued payments to a survivor, using equal premiums and matching guarantee terms.
Finelo Team


