Methodology note: Session VWAP is the cumulative sum of trade price × volume divided by cumulative volume under a defined feed and session. It is a historical average and execution benchmark, not “fair value”; price above it does not prove buyers control the market, and price below it does not prove sellers do. Benchmark conclusions also depend on order constraints, participation, opportunity cost, fees, and the chosen market data.
VWAP Indicator: Definition, Calculation, and How Traders Use It
The vwap indicator, short for volume-weighted average price, shows the average price a security has traded at during the day, weighted by volume. In plain terms, it answers one question: where has most of today's money…
10 min read
Practice trading with Finelo
Practice in a simulator, learn with bite-sized lessons, and build confidence before risking real money.
Want to learn more?
Practice in a simulator, learn with bite-sized lessons, and build confidence before risking real money.
Explore FineloExplore Finelo's 28-day challenges
Turn learning into a daily habit with guided challenge paths.
The vwap indicator, short for volume-weighted average price, shows the average price a security has traded at during the day, weighted by volume. In plain terms, it answers one question: where has most of today's money actually changed hands? Traders use it as an intraday benchmark to judge whether the current price is rich or cheap relative to the session's true average. This page is for newer traders and self-directed investors who keep seeing VWAP on charts and want a clear, practical explanation. Read the calculation, the chart-reading rules, and the decision framework below, then practice spotting VWAP on a demo chart before you risk real money.
What the VWAP indicator measures
VWAP blends two things a simple average ignores: price and the volume traded at each price. A stock that trades 1 million shares at $50 and only 10,000 shares at $55 has spent most of its real activity near $50. VWAP reflects that. A plain average of prices would not.
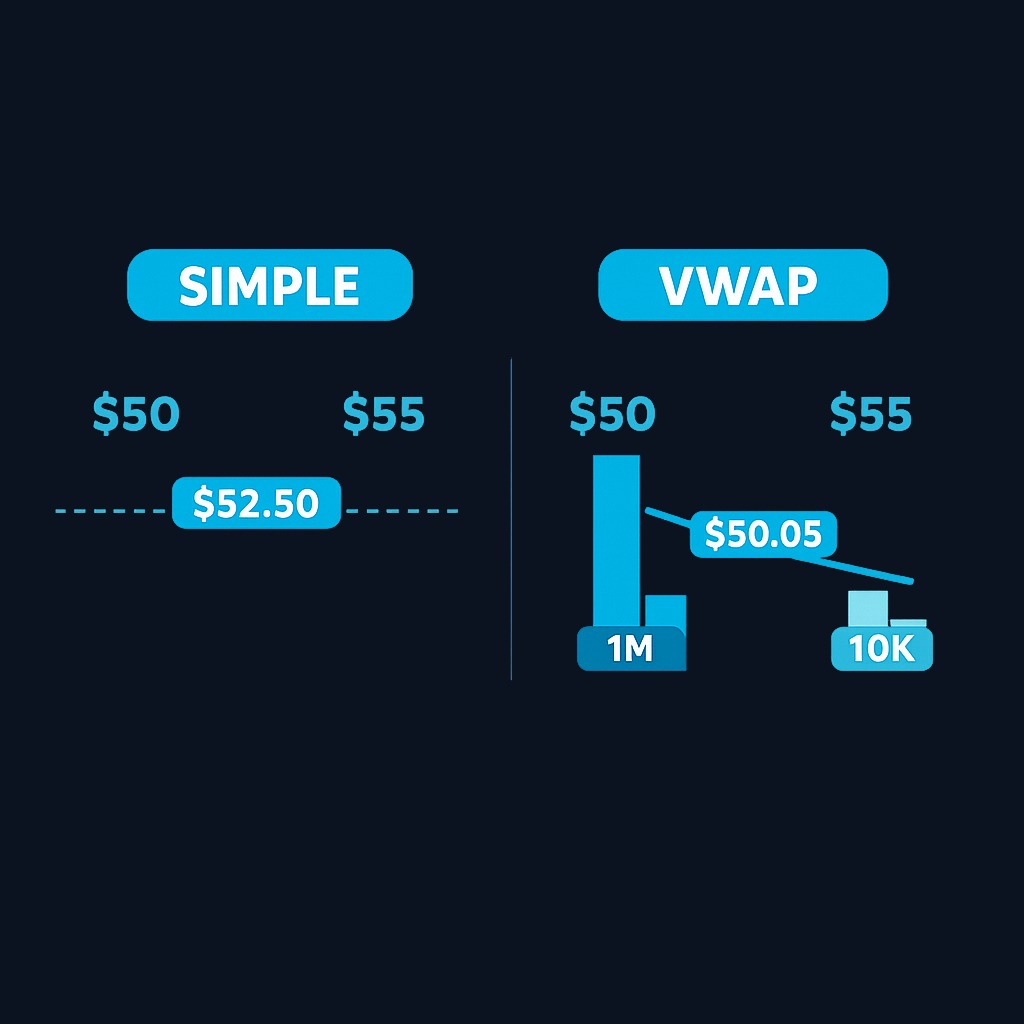
VWAP is sometimes called a fair-value or control line in market shorthand, but the formula supports neither claim. It only reports the volume-weighted mean of included trades up to that time. Trading desks may use VWAP as one execution benchmark, but a fill below the benchmark is not automatically good once constraints, market impact, timing, fees, and opportunity cost are considered.
Three properties matter for anyone learning the indicator:
- It is an intraday tool. Standard VWAP resets at the start of each trading day.
- It is cumulative. Every calculation includes all trading since the open, so the line gets harder to move as the day goes on.
- It lags by design. VWAP describes where volume has already traded. It does not predict where price will go next.
How VWAP is calculated
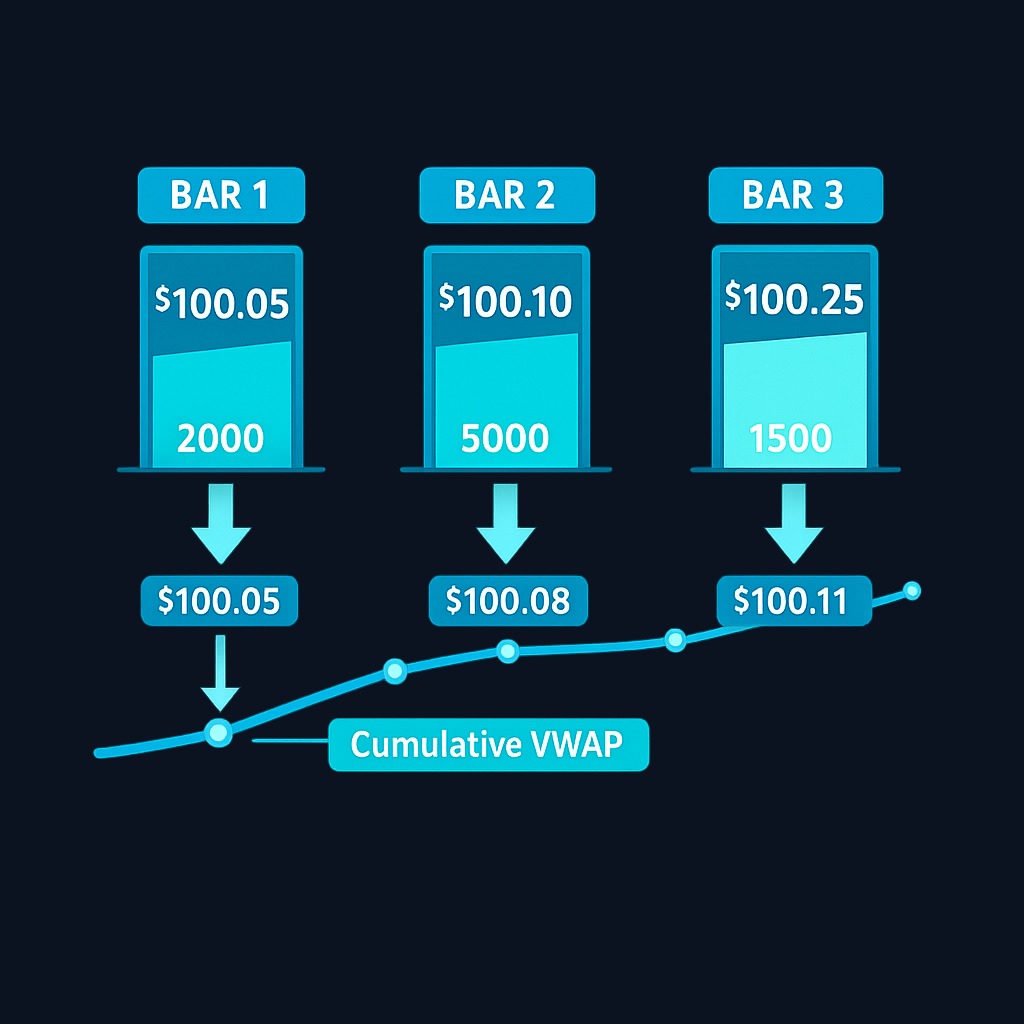
The formula is straightforward. For each period (usually each minute or each candle), multiply the typical price by the volume of that period. Add these values up cumulatively through the day, then divide by cumulative volume.
Typical price = (high + low + close) / 3
VWAP = cumulative (typical price × volume) / cumulative volume
A short worked example over three five-minute bars:
| Bar | Typical price | Volume | Price × volume | Cumulative P×V | Cumulative volume | VWAP |
|---|---|---|---|---|---|---|
| 1 | $20.00 | 10,000 | $200,000 | $200,000 | 10,000 | $20.00 |
| 2 | $20.30 | 30,000 | $609,000 | $809,000 | 40,000 | $20.23 |
| 3 | $20.10 | 20,000 | $402,000 | $1,211,000 | 60,000 | $20.18 |
Notice how bar 2, with the heaviest volume, pulls the average toward its price. That is the entire point of volume weighting. Charting platforms compute this automatically, so you will never do the math by hand, but understanding it explains the indicator's behavior: early in the day VWAP moves quickly, and by the afternoon it flattens because the cumulative volume behind it is large.
How to read VWAP on a chart
Most platforms draw VWAP as a single line overlaid on the intraday chart, often with optional bands one or two standard deviations away. Three common readings:
- Price above VWAP: the session's average buyer is in profit; intraday momentum favors the upside. Many traders treat pullbacks to VWAP as potential support.
- Price below VWAP: the average buyer is underwater; rallies toward VWAP often meet selling. The line can act as resistance.
- Price chopping across VWAP: no side is in control. Range or low-volume conditions make VWAP signals weaker and false crosses more common.
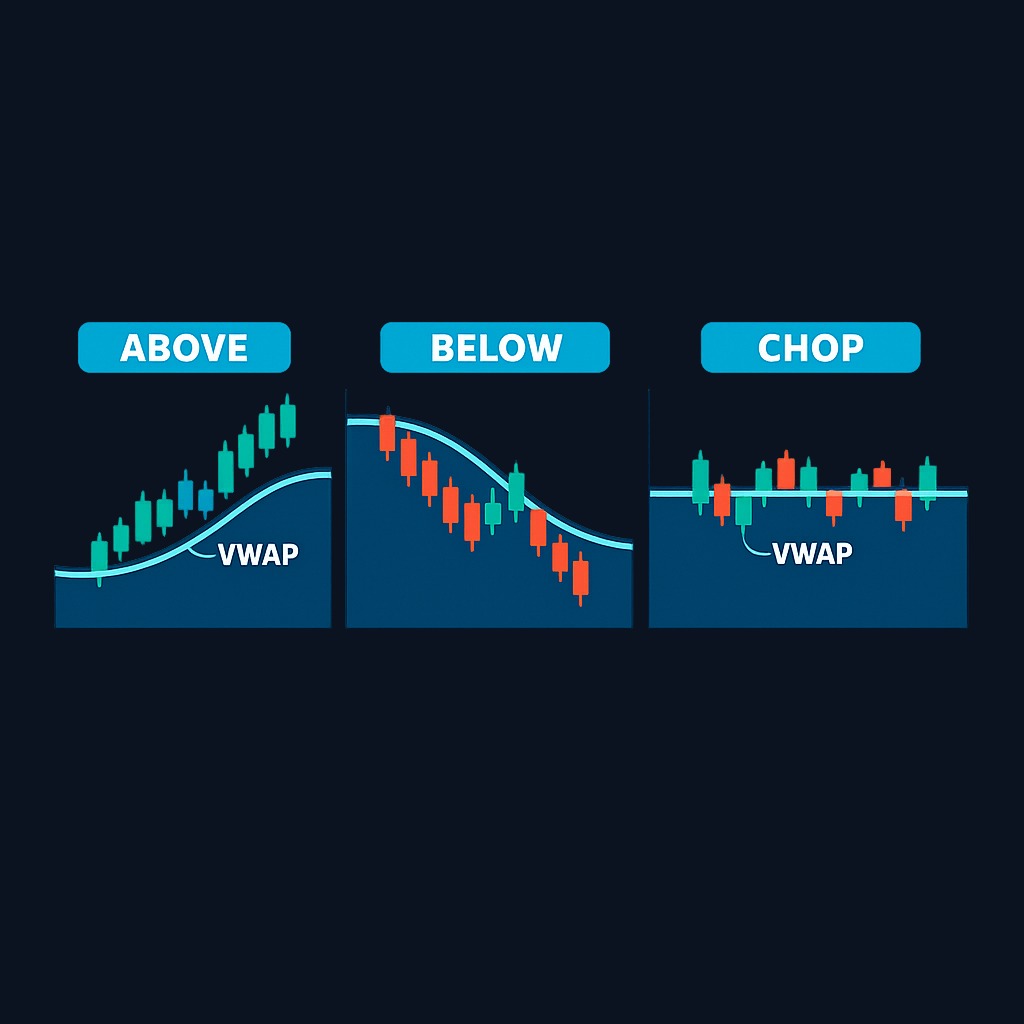
Context matters more than the line itself. A VWAP touch on heavy volume in a trending market means something different from a drift across VWAP at lunchtime on light volume. Pair the level with what volume is doing at that moment.
VWAP trading strategies
Trend confirmation
The simplest use: only take long setups while price holds above VWAP, and only short setups below it. The indicator acts as a bias filter, keeping a trader aligned with the side that controls the session.
Pullback entries
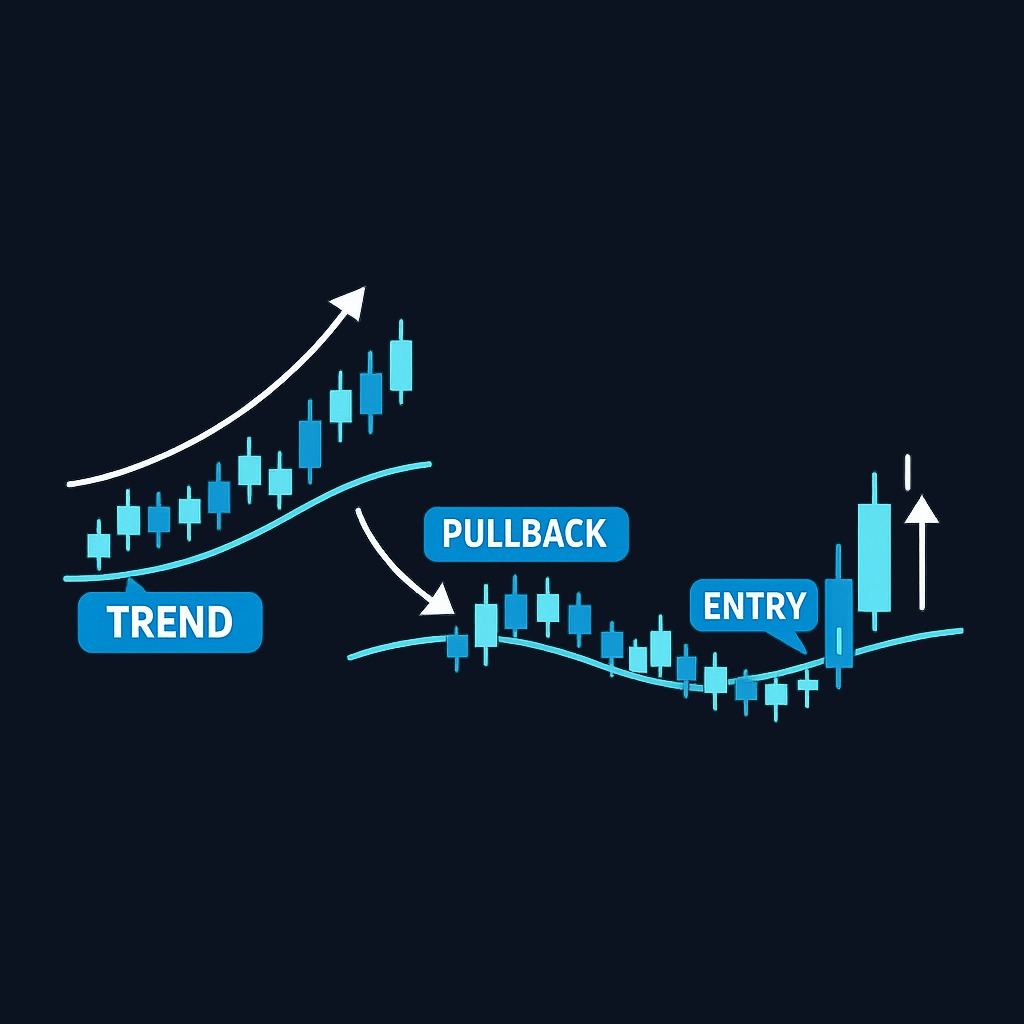
In an uptrend, traders wait for price to retrace to the VWAP line, then look for a reversal signal such as a strong candle close before entering. The logic is buying near the session's fair value instead of chasing an extended move.
Mean reversion with bands
When price stretches two or more standard deviations from VWAP without fresh news, some traders fade the move, targeting a return toward the line. This works best in range-bound sessions and fails hard in strong trends, so it demands strict stops.
Execution benchmarking
Longer-term investors placing a large order can compare their fill price against the day's VWAP to judge execution quality. This is the institutional origin of the indicator. How your broker routes and fills orders affects the price you actually get; the SEC's investor publication on trade execution explains how orders are executed and why fill prices can differ from the quote you saw.
VWAP vs moving averages
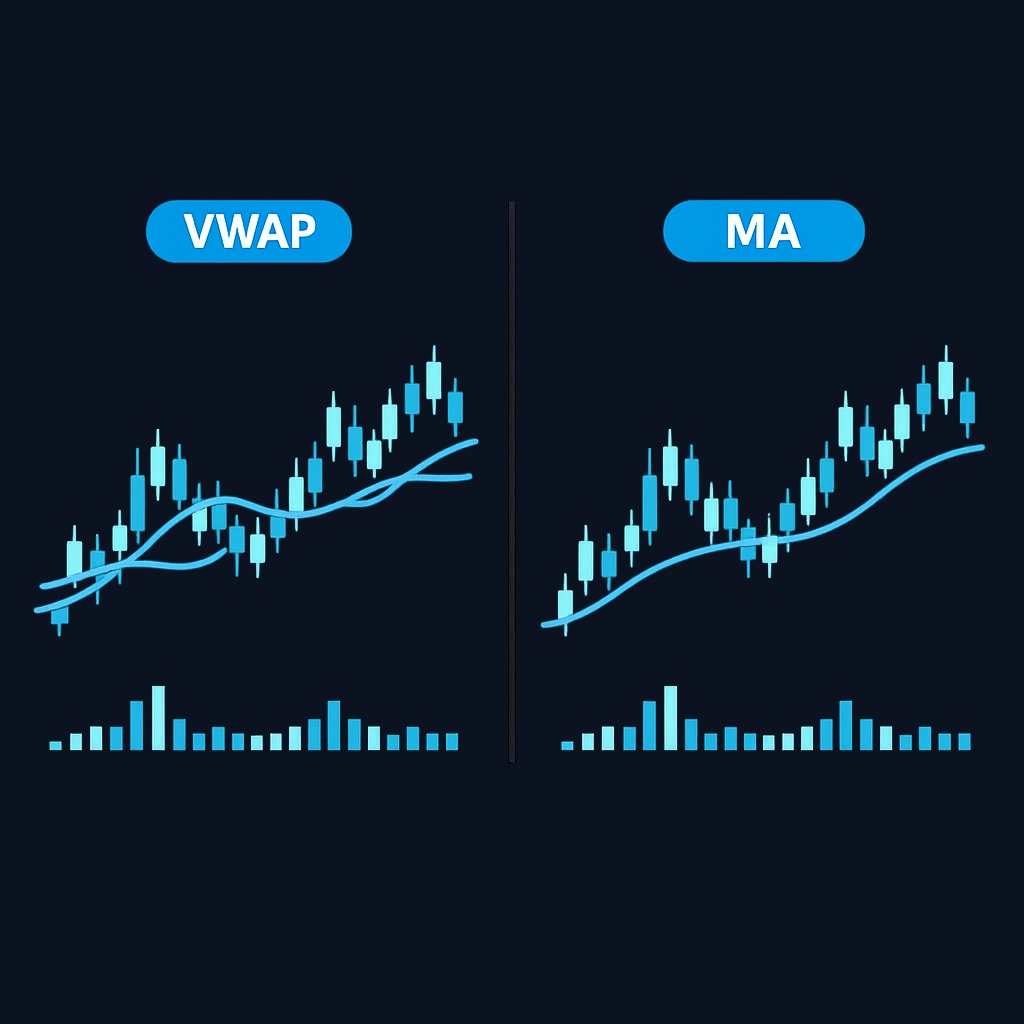
VWAP and a simple moving average look similar on a chart but answer different questions.
| Feature | VWAP | Simple moving average |
|---|---|---|
| Weighting | Volume-weighted | Equal weight per period |
| Reset | Resets each session | Rolls continuously across days |
| Best timeframe | Intraday | Any timeframe |
| Primary users | Day traders, execution desks | Swing and position traders |
| What it tells you | Where volume actually traded today | Average price over N periods |
A moving average smooths price over a fixed lookback window regardless of how much trading happened in each bar. VWAP cares about where the volume occurred. For multi-day analysis, moving averages are the better tool; for judging today's session, VWAP is purpose-built.
Practice trading with Finelo
Practice in a simulator, learn with bite-sized lessons, and build confidence before risking real money.
Anchored VWAP and other variants
The standard session VWAP is only one flavor. Anchored VWAP lets you start the calculation from any bar you choose: an earnings gap, a Federal Reserve announcement, a breakout candle, or an IPO's first print. The line then shows the volume-weighted average of everyone who has traded since that event. If price sits above an earnings-anchored VWAP, the average post-earnings buyer is profitable, which often turns that line into a durable reference for weeks.
Institutional desks extend the idea further. Execution algorithms slice a parent order into hundreds of child orders and pace them by participation rate, targeting the day's VWAP so a pension fund's footprint stays invisible. Related tools include TWAP, the time-weighted cousin that ignores volume entirely, and multi-day rolling VWAP used on futures. Retail platforms increasingly expose these variants, so check your charting settings before assuming you are looking at the plain session line.
A practical walkthrough makes the behavior concrete. Suppose a stock opens at $42.10, spikes to $43.00 in the first fifteen minutes on heavy prints, then fades. By 10:15 a.m. VWAP sits near $42.55. A trader watching the tape sees price base just above the line during the midday lull, with sellers unable to force a close below it. That failure, plus rising volume after 2:00 p.m., is the kind of evidence stack VWAP users wait for: the level itself, the reaction to it, and the volume behind the reaction.
Common misconceptions about VWAP
- "VWAP predicts price." It does not. It summarizes completed trading. Any predictive value comes from how other participants react to the same line.
- "VWAP works on daily charts." Standard VWAP is a single-session tool. Anchored VWAP variants can start from any date, but the default calculation resets daily and means little on a weekly chart.
- "A VWAP cross is a signal by itself." Crosses happen constantly in quiet markets. Without volume and trend context, a cross is noise.
- "VWAP is only for day traders." Execution benchmarking makes it useful to anyone placing sizable orders, including long-term investors who simply want a fair fill.
What to know before deciding
VWAP is free, objective, and available on virtually every charting platform, which makes it a low-cost addition to a trading toolkit. But it earns its keep only in specific situations. If you trade intraday, it gives you a session bias and a reference level that thousands of other participants watch, which is precisely why it tends to matter. If you invest on a horizon of months or years, the daily VWAP line will rarely change a decision, though it can still improve the quality of your entries on large orders. Be honest about which category you fall into. No single indicator, VWAP included, produces reliable profits on its own; risk management and position sizing decide outcomes over time.
Decision framework: should you use the vwap indicator?
| Your situation | Recommended approach |
|---|---|
| Day trading stocks or futures | Use VWAP as a bias filter and pullback reference on every session chart |
| Swing trading over days or weeks | Prefer moving averages; use anchored VWAP from key events if your platform offers it |
| Long-term investing, occasional large orders | Check your fill against the day's VWAP to gauge execution quality |
| Complete beginner still learning charts | Learn candlesticks, volume, and support/resistance first, then add VWAP |
Two questions settle the decision. First, does your strategy live inside a single trading day? If yes, VWAP belongs on your chart. Second, do you place orders large enough that execution quality matters? If yes, VWAP is your benchmark even when you never trade off it.
FAQ
What is the vwap indicator in simple terms?
It is the average price of the day's trading, weighted by volume. It shows the level where most money actually changed hands during the session, which traders treat as the day's fair value reference.
How is VWAP different from an average price?
A plain average treats every price equally. VWAP gives more influence to prices where heavy volume traded, so it reflects real activity instead of just price movement.
Does VWAP work for long-term investing?
Not directly, because it resets each session. Long-term investors mainly use it to benchmark execution on larger orders rather than to time the market.
Can VWAP be used with other indicators?
Yes, and it usually should be. Common pairings include volume analysis, RSI for momentum, and support and resistance levels. VWAP provides the session bias while other tools time entries.
Conclusion and next steps
VWAP condenses included session trades into a volume-weighted average. The current price's position above or below the line is descriptive, not proof of who controls the tape. Treat bias, pullback, and mean-reversion uses as rules to test rather than implications of the formula. Document the feed and session and include fees, slippage, and opportunity cost.
Chart AnalysisTechnical AnalysisBeginner
Practice trading with Finelo
Practice in a simulator, learn with bite-sized lessons, and build confidence before risking real money.
About the author
Finelo Team
The Finelo Team creates practical investing and trading education designed to help beginners learn faster with structured challenges, simulator practice, and bite-sized lessons.
Keep reading — Related articles

Chart Analysis
Symmetrical Triangle Pattern: Identification, Breakouts, and Limits
A symmetrical triangle forms when lower highs and higher lows narrow the trading range. Learn to identify it, assess breakout confirmation, and recognize false signals.
Finelo Team

Chart Analysis
Hanging Man Candlestick: The Hammer’s Bearish Twin Explained
A hanging man is a bearish warning candle after an uptrend. Learn how its context differs from a hammer, why confirmation matters, and when the warning fails.
Finelo Team

Chart Analysis
Evening Star Pattern: How to Identify a Three-Candle Reversal
The evening star is a three-candle bearish reversal pattern that forms after an uptrend. Learn its anatomy, confirmation signals, and limitations before interpreting it on a chart.
Finelo Team


