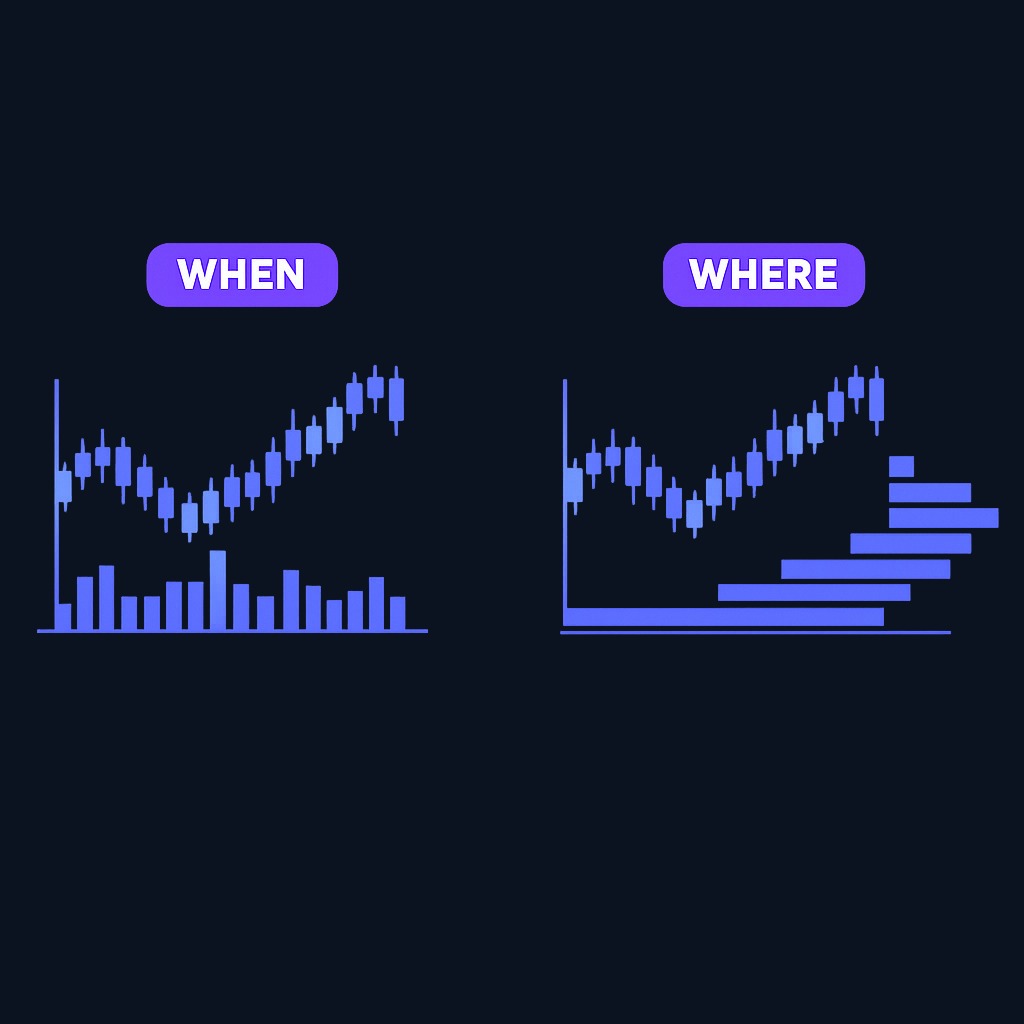
Volume profile trading is a charting method that shows how much volume traded at each price level, drawn as horizontal bars along the side of the chart. Instead of asking when trading happened, it asks where. The result is a map of the prices the market cares about most. This page is for traders who already know basic candlesticks and want a deeper view of support, resistance, and breakout quality. You will learn the key components, the main profile types, practical setups, and the tool's limits. Read the walkthrough, then study a few charts on a practice account before trading the levels live.
Volume Profile Trading: How to Read and Use the Levels
Volume profile trading is a charting method that shows how much volume traded at each price level, drawn as horizontal bars along the side of the chart. Instead of asking when trading happened, it asks where. The result…
9 min read
Practice trading with Finelo
Practice in a simulator, learn with bite-sized lessons, and build confidence before risking real money.
Want to learn more?
Practice in a simulator, learn with bite-sized lessons, and build confidence before risking real money.
Explore FineloExplore Finelo's 28-day challenges
Turn learning into a daily habit with guided challenge paths.
What is volume profile?
A standard volume pane shows vertical bars under each time period. Volume profile turns that sideways. It stacks the traded volume against price instead of time, so each horizontal bar shows how much business was done at that exact price zone.
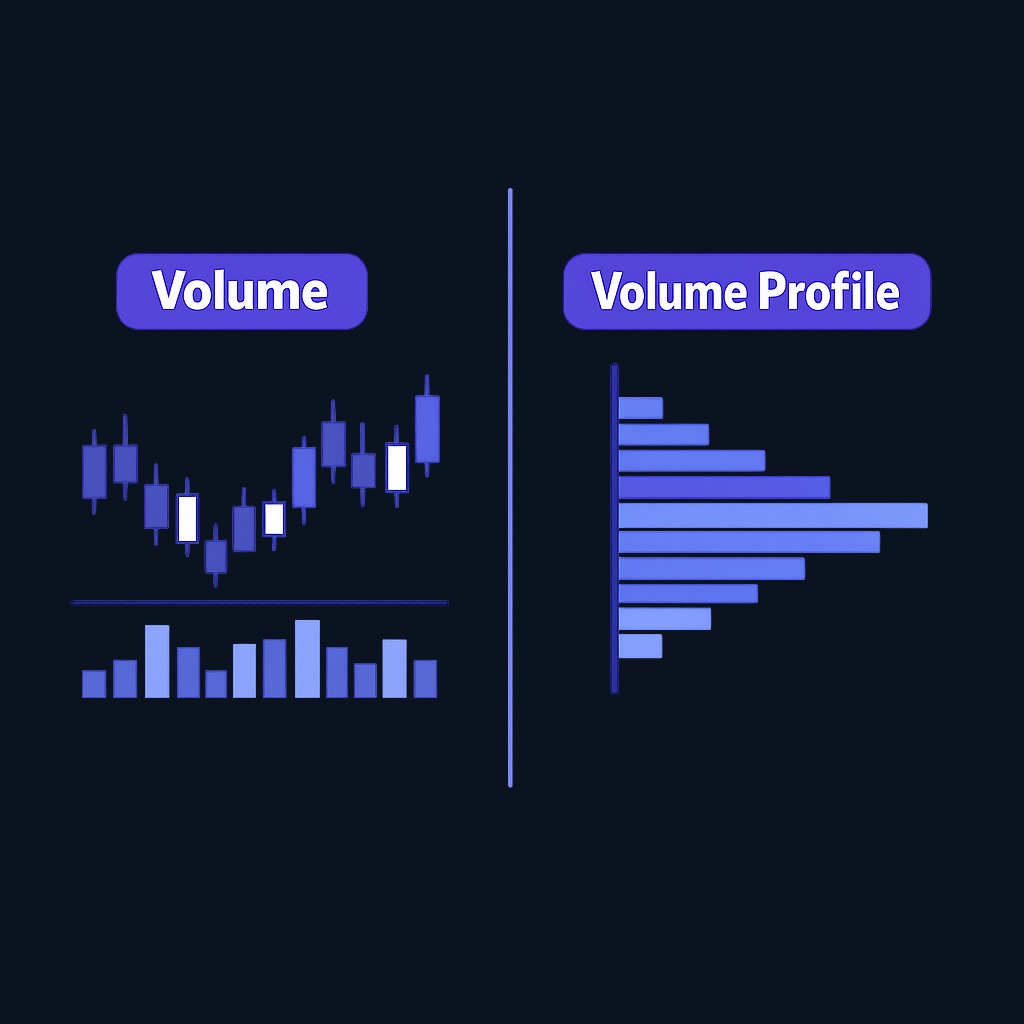
Long bars mark prices where more reported volume traded during the selected range; short bars mark prices where less traded. Traders often call these acceptance and rejection zones, but those labels are interpretations rather than forecasts. The result depends on the instrument, venue coverage, data vendor, aggregation method, session settings, and selected range.
Traders use the profile on any timeframe. A day trader may profile a single session, while a swing trader profiles weeks or months of trading to find the levels that matter for a bigger move.
How volume profile works: the key components
A volume profile has a small vocabulary worth learning precisely.
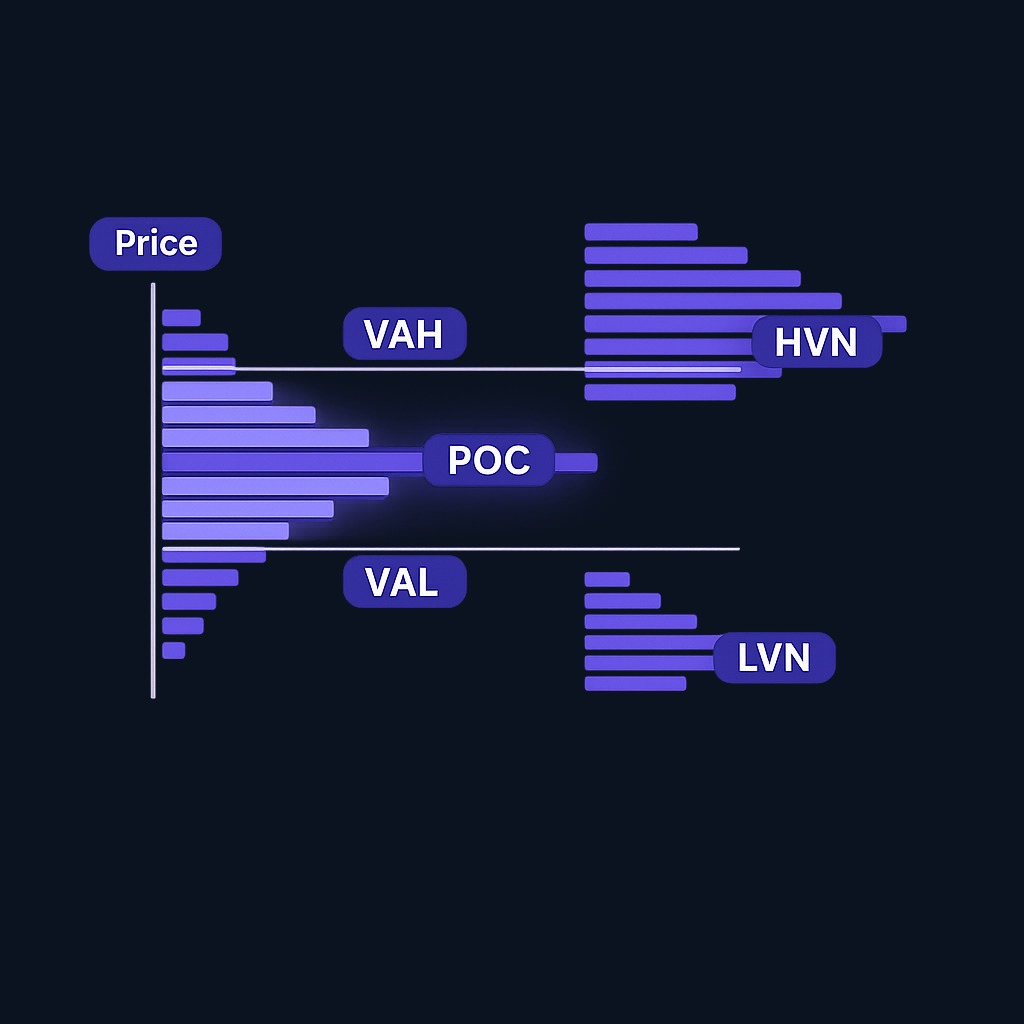
Point of control (POC)
The point of control is the price bin with the highest reported volume in the selected profile. Traders use it as a reference level, but it is not a price magnet and does not imply that price must return.
Value area
The value area is the price band containing a selected share of the profile's reported volume, often 70% by convention. Its edges are called the value area high (VAH) and value area low (VAL). Platforms can calculate the band differently, so check the method and settings before comparing levels.
High and low volume nodes
High-volume nodes (HVNs) are bulges where reported trade clustered; low-volume nodes (LVNs) are thinner areas. Traders may test whether these zones behave as support, resistance, or faster-travel areas, but the profile alone cannot show who still holds a position or how future orders will behave.
For exchange-traded products, a profile is only as complete as its feed. A single-venue or limited-depth product does not represent every execution in a fragmented market, and hidden liquidity is not visible before it trades. Use the same data source, session definition, tick size, and corporate-action adjustment throughout any test.
Types of volume profiles
- Session profile. Built from one trading day. Day traders use it to frame intraday levels.
- Fixed range profile. Built from any range you select, such as a rally or a consolidation. Useful for analyzing a specific move.
- Visible range profile. Built from whatever candles are on screen. Quick, but it changes as you scroll, so anchor important levels with a fixed range instead.
- Composite profile. Built from weeks or months of data to reveal long-term acceptance zones.
Most modern platforms include at least a visible range tool. The chart type matters less than consistency: pick the profile that matches your holding period and keep using it the same way.
Practical applications of volume profile in trading
Sharper support and resistance
Traditional support and resistance lines come from swing highs and lows. Volume profile adds a record of reported transactions in the selected range. An HVN lining up with another reference level creates a more explicit hypothesis to test, not a stronger level by definition.
Judging breakout quality
When price leaves the value area, traders compare subsequent price and volume with the existing profile. A breakout into an LVN may move quickly, stall, or reverse; an HVN does not reveal how much current supply remains. Write these outcomes as conditional rules and measure them rather than assuming the node predicts the path.
Framing entries, stops, and targets
Profile levels can make an entry, invalidation point, and target explicit. Their placement should follow a tested rule and a position-size limit; putting a stop beyond a node does not make that distance safe, and a target at another node does not make a reaction likely.
A worked example with numbers
Suppose a stock has traded between $98 and $106 for three weeks. The profile of that range shows the point of control at $102.40, a value area from $100.80 (VAL) to $103.90 (VAH), a thick high volume node near $101.50, and a thin shelf between $104.20 and $105.30 where almost nothing traded.
A hypothetical trend-following rule might enter near $101.70 after a defined reversal signal, exit at $100.55, and evaluate targets at $103.90 and $105.90. The second target is $4.20 above entry versus $1.15 of initial risk, or about 3.7 to 1 before fees, slippage, gaps, and partial fills. The LVN does not imply that price will cross it quickly; the example shows how to specify and test a rule.
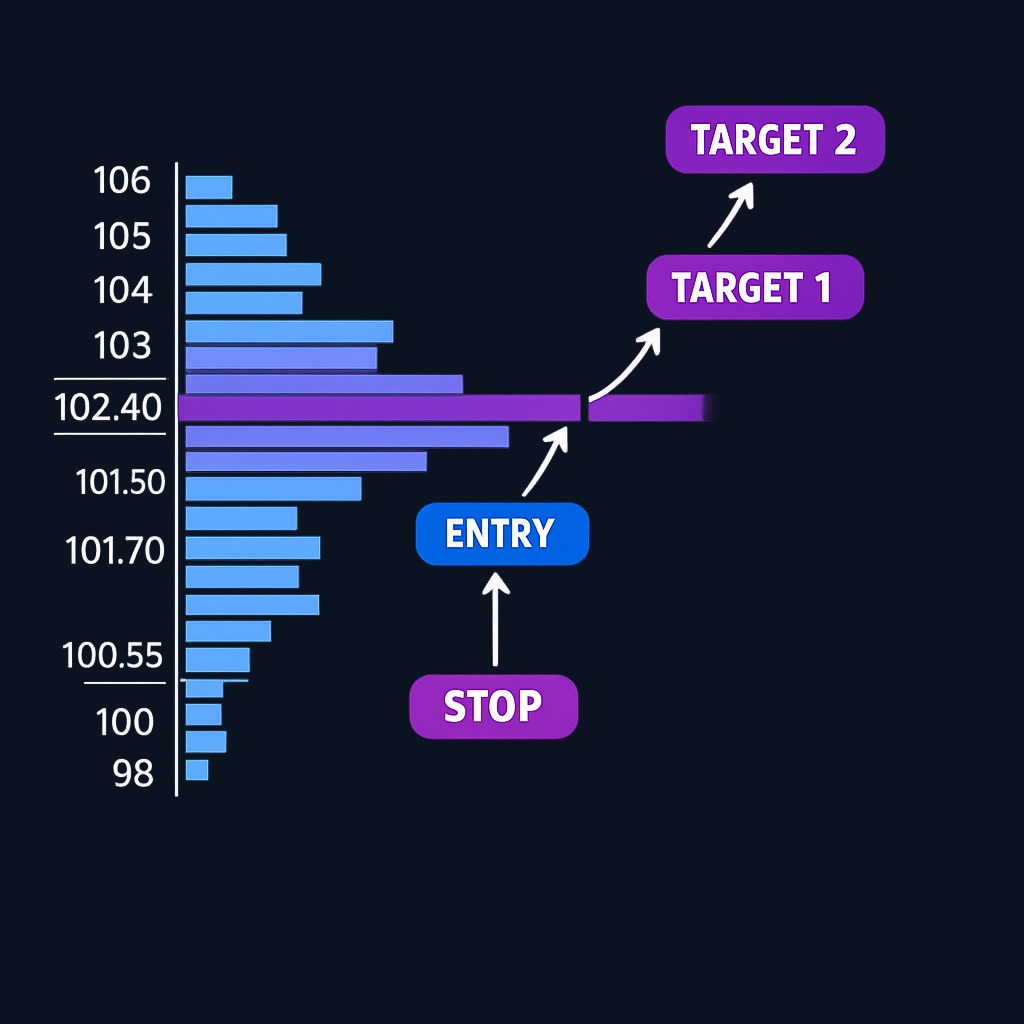
| Profile element | Level in example | Role in the trade |
|---|---|---|
| POC | $102.40 | Reference level; no directional signal by itself |
| Value area | $100.80-$103.90 | Fair-price zone framing the pullback |
| HVN | $101.50 | Entry zone with transaction history |
| LVN shelf | $104.20-$105.30 | Low reported volume in the selected range; behavior must be tested |
Spotting acceptance and rejection
If a new profile begins building volume above the prior value area, traders may describe that as acceptance. A move outside the area followed by a return is often labeled rejection. Neither label establishes a higher-probability next path without evidence from the exact rules, market, and sample being used.
Practice trading with Finelo
Practice in a simulator, learn with bite-sized lessons, and build confidence before risking real money.
Common mistakes in volume profile trading
- Treating the POC or value area edge as an automatic entry signal without any confirmation from price behavior.
- Using the visible range profile for important levels, then wondering why the levels moved when the chart scrolled.
- Profiling a period that mixes unrelated regimes, such as combining a calm range with a news-driven spike.
- Ignoring the broader trend and fading strong momentum just because price reached a node.
- Overloading the chart with five profiles at once and losing the simple story: where is value, and is price accepting or rejecting it?
What to know before deciding
Volume profile describes a vendor's past distribution of reported trade. It does not assign probabilities by itself. Different platforms can draw materially different profiles because of feed coverage, price-bin size, session settings, data resolution, and selected range, so document the settings used.
Short-term trading built on these levels is an active, demanding style. The U.S. Securities and Exchange Commission's day trading risk bulletin warns that active short-term traders should only risk money they can afford to lose, as most face significant losses. Volume profile can improve the quality of your levels, but position sizing, stops, and a tested plan decide whether you survive long enough to benefit. Expect a learning period: reading acceptance and rejection well takes screen time that no article can compress.
Decision framework: is volume profile right for your trading?
- You day trade or swing trade liquid markets. Strong fit. Profiles are most reliable where volume data is rich.
- You rely on classic support and resistance. Good fit as an upgrade; use HVNs to validate your existing levels.
- You trade breakouts. Use LVNs overhead as green lights and thick HVNs as caution zones before entering.
- You invest long term. Weak fit. Value areas matter little next to fundamentals and asset allocation on multi-year horizons.
- You trade illiquid small caps or thin crypto pairs. Be careful. Sparse volume makes profiles noisy and less meaningful.
FAQ
What is the point of control in volume profile trading?
It is the price bin with the highest reported volume in the selected profile. Traders use it as a reference, but it is not inherently magnetic or directional.
What is the difference between volume profile and the regular volume indicator?
The regular volume indicator shows volume per time period along the bottom of the chart. Volume profile shows volume per price level along the side. The first tells you when activity happened, the second where it happened.
Does volume profile work for day trading and swing trading?
It can be calculated for intraday or multi-session ranges. The data, session definition, bin size, holding period, and execution costs differ, so a rule tested on one horizon should not be assumed to work on another.
Can volume profile be used alone?
It is better used as context than as a standalone system. Most traders combine profile levels with price action, trend analysis, and strict risk management before acting on a level.
Conclusion and next steps
Volume profile turns reported activity into a map: the POC marks the highest-volume bin, the value area contains a chosen share of volume, and nodes show how that historical volume was distributed. Start with a simple two-week observation drill on one market. Document the feed and settings, mark the levels before the session, record one falsifiable expectation, and grade it after the close. A journal and a sufficiently large test—not the indicator's labels—show whether the tool adds value for your process.
Chart AnalysisTechnical AnalysisBeginner
Practice trading with Finelo
Practice in a simulator, learn with bite-sized lessons, and build confidence before risking real money.
About the author
Finelo Team
The Finelo Team creates practical investing and trading education designed to help beginners learn faster with structured challenges, simulator practice, and bite-sized lessons.
Keep reading — Related articles

Chart Analysis
Symmetrical Triangle Pattern: Identification, Breakouts, and Limits
A symmetrical triangle forms when lower highs and higher lows narrow the trading range. Learn to identify it, assess breakout confirmation, and recognize false signals.
Finelo Team

Chart Analysis
Hanging Man Candlestick: The Hammer’s Bearish Twin Explained
A hanging man is a bearish warning candle after an uptrend. Learn how its context differs from a hammer, why confirmation matters, and when the warning fails.
Finelo Team

Chart Analysis
Evening Star Pattern: How to Identify a Three-Candle Reversal
The evening star is a three-candle bearish reversal pattern that forms after an uptrend. Learn its anatomy, confirmation signals, and limitations before interpreting it on a chart.
Finelo Team


