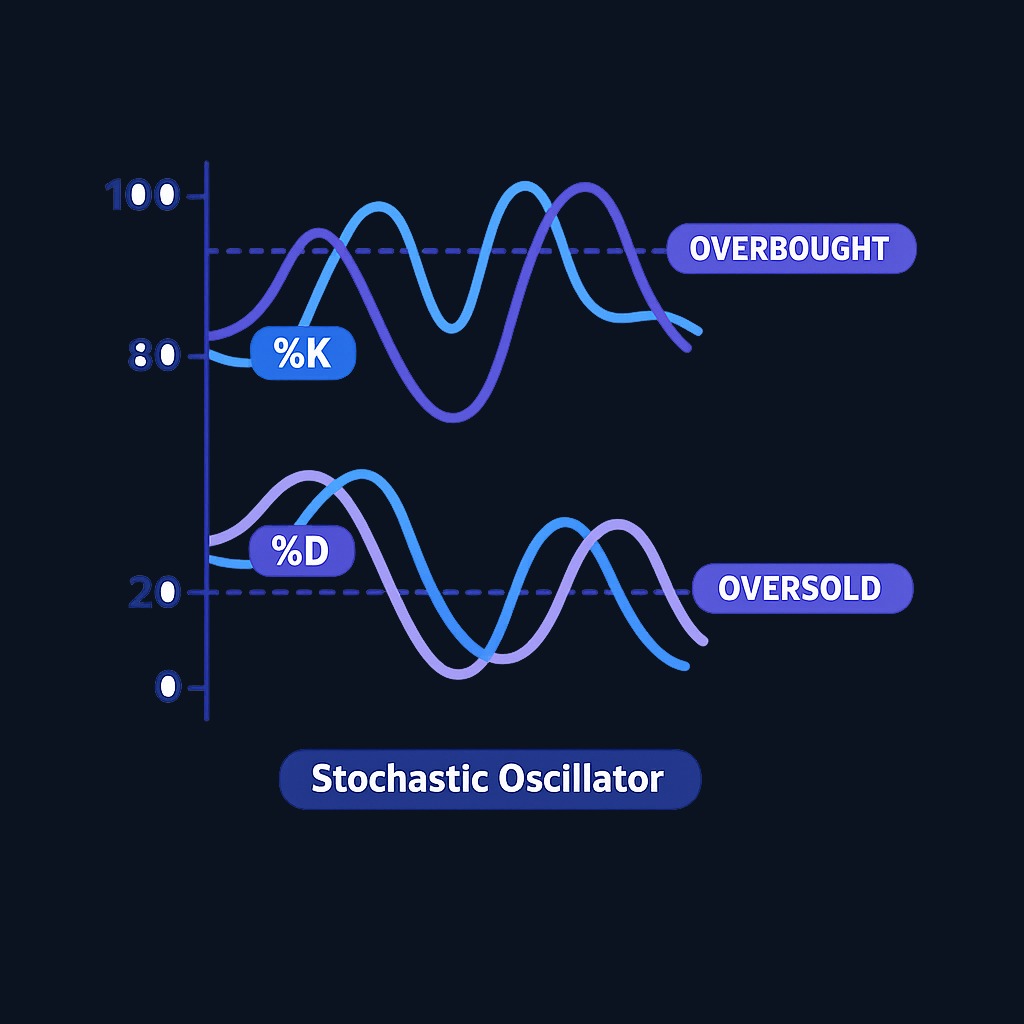
The stochastic oscillator is a momentum indicator that compares where a price closed relative to its high-low range over a lookback period, usually 14 bars. It prints two lines, %K and %D, on a scale from 0 to 100; readings above 80 are conventionally called overbought and readings below 20 oversold. This page is for traders and investing learners who want to understand how the indicator is built, what its signals actually mean, and how to avoid the mistakes that make new users lose money with it. Work through the calculation once, then practice reading signals on historical charts before risking capital.
The Stochastic Oscillator: A Key Tool for Traders

The stochastic oscillator is a momentum indicator that compares where a price closed relative to its high-low range over a lookback period, usually 14 bars. It prints two lines, %K and %D, on a scale from 0 to 100;…
14 min read
Practice trading with Finelo
Practice in a simulator, learn with bite-sized lessons, and build confidence before risking real money.
Want to learn more?
Practice in a simulator, learn with bite-sized lessons, and build confidence before risking real money.
Explore FineloExplore Finelo's 28-day challenges
Turn learning into a daily habit with guided challenge paths.
The guide covers the formula, the meaning of overbought and oversold readings, and how to turn an interpretation into a testable rule.
What the stochastic oscillator measures
The indicator answers one narrow question: within the recent trading range, how close did price finish to the top? The logic, popularized by George Lane in the late 1950s, is that momentum shifts before price does. In an uptrend, closes tend to cluster near the highs of the range; as buying pressure fades, closes start slipping toward the middle and bottom of the range even while the price itself is still rising. The stochastic oscillator turns that tendency into a number.
Because the output is bounded between 0 and 100, the stochastic oscillator belongs to the family of range-bound momentum tools, alongside the relative strength index. Bounded indicators are convenient: the same 80/20 reference levels mean roughly the same thing on any instrument and any timeframe, whether you trade stocks, ETFs, futures, or currencies. Unlike trend tools such as a moving average, the oscillator says nothing about direction on its own; it describes the position of the close within the range, and traders infer momentum from how that position changes.
It helps to keep the vocabulary straight from the start. %K is the raw stochastic line, the fast-moving one. %D is a moving average of %K, the slower signal line. Most of the classic signals come from the relationship between these two lines and the 80/20 zones.
How to calculate the stochastic oscillator
The standard formula uses a 14-period lookback, though the number is adjustable:
%K = 100 × (Current close − Lowest low of the last 14 periods) ÷ (Highest high of the last 14 periods − Lowest low of the last 14 periods)
%D = 3-period simple moving average of %K
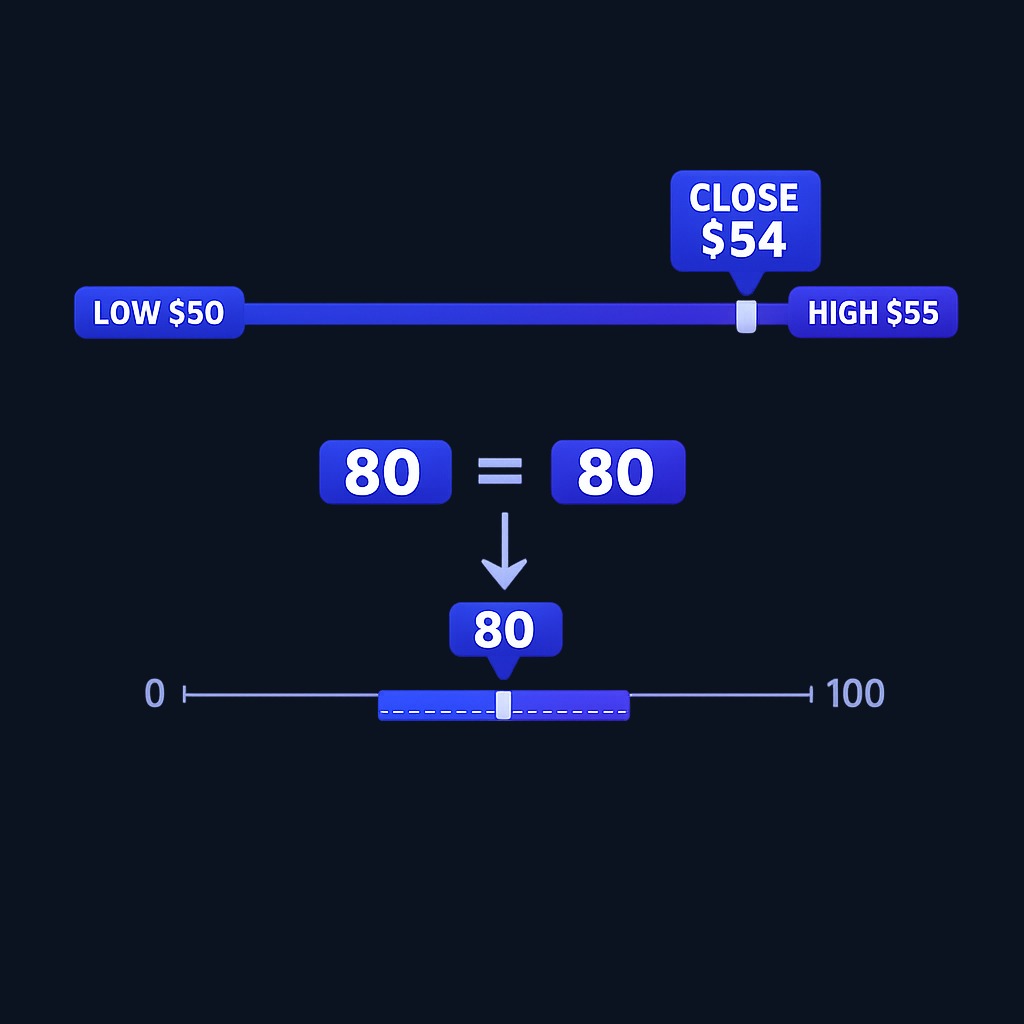
A worked example makes it concrete. Suppose a stock's highest high over the last 14 sessions is $55, the lowest low is $50, and today's close is $54. Then %K = 100 × (54 − 50) ÷ (55 − 50) = 80. The close sits at 80% of the recent range, right at the overbought threshold. If tomorrow's close drops to $52 while the range holds, %K falls to 40, and the oscillator has registered fading momentum even though price only slipped moderately.
Three practical notes on the math:
- The lookback window sets sensitivity. A 5-period stochastic reacts to every wiggle; a 21-period version smooths the noise but signals later. The 14-period default is a compromise, not a law.
- %D is where signals come from. Because %D averages three values of %K, crossovers between the two lines mark short-term momentum turns.
- The bounded scale can pin. In a strong trend, the oscillator can sit above 80 or below 20 for weeks. A high reading is a description of the range position, not an automatic sell instruction.
You rarely need to compute any of this by hand; every mainstream charting platform includes the indicator. Calculating it once in a spreadsheet, though, is the fastest way to understand why the lines behave the way they do.
Choosing settings for your timeframe
There is no single correct setting, only trade-offs between speed and reliability. These are common starting points:
| Trading style | Typical lookback | Smoothing | Behavior |
|---|---|---|---|
| Scalping and intraday | 5-9 periods | Fast or light smoothing | Many early signals, heavy noise |
| Swing trading | 14 periods | Slow stochastic (3,3) | Balanced default for most charts |
| Position trading | 21+ periods on daily or weekly bars | Full stochastic with extra smoothing | Few signals, each covering larger moves |
Whatever you pick, test it on the specific instrument you trade. A setting that behaves well on a calm large-cap index can be useless on a thin small-cap stock, because the indicator inherits the character of the price series it summarizes. Day traders and swing traders also read the oscillator on more than one resolution at once, which is covered in the multi-timeframe section below.
Types of stochastic oscillators
There are three standard variants, and they differ only in how much smoothing is applied:
| Variant | %K line | %D line | Character |
|---|---|---|---|
| Fast stochastic | Raw %K | 3-period SMA of %K | Most responsive, most false signals |
| Slow stochastic | Fast %D becomes the new %K | 3-period SMA of the new %K | Smoother, the most widely used default |
| Full stochastic | Raw %K smoothed by a user-chosen period | User-chosen SMA of smoothed %K | Fully customizable version of the same idea |
The fast stochastic suits very short-term traders who accept noise as the price of early signals. The slow stochastic filters one layer of noise and is what most platforms display by default. The full stochastic simply exposes all three parameters, lookback, %K smoothing, and %D smoothing, so you can tune the indicator to an instrument's typical volatility. Whichever variant you choose, use it consistently; comparing signals across differently smoothed versions creates confusion without adding information.
How the stochastic compares with other momentum tools
Bounded momentum indicators overlap, and understanding the differences prevents redundant analysis:
| Indicator | What it compares | Strength | Weakness |
|---|---|---|---|
| Stochastic oscillator | Close versus the high-low range | Early, responsive turns in ranges | Whipsaws in strong trends |
| RSI | Average gains versus average losses | Smoother, robust divergence signals | Slower to flag short-term turns |
| MACD | Two exponential moving averages | Combines trend and momentum | Unbounded scale, no fixed zones |
| Rate of change | Close versus a past close | Simple, transparent momentum | No range context, no smoothing |
Running the stochastic and the RSI side by side adds little, since both are bounded momentum gauges; most traders pair the stochastic with a trend tool instead, so the two inputs answer different questions rather than the same one twice.
Interpreting the stochastic oscillator
Overbought and oversold readings
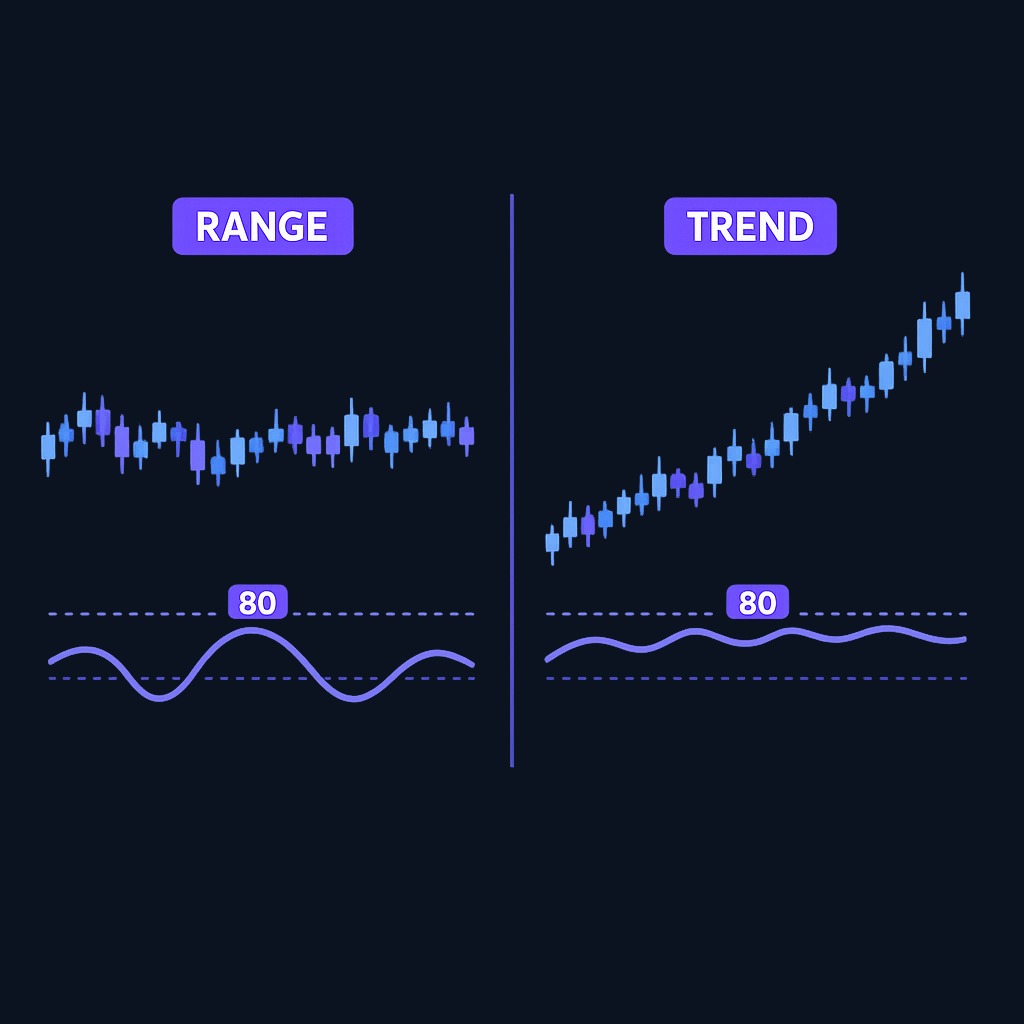
Above 80, the close is finishing near the top of its recent range; below 20, near the bottom. In a sideways market these zones often precede reversals, which is where the indicator earns its reputation. In a trending market the same readings mean something different: a stochastic that keeps tagging 90 is evidence of persistent buying strength, not an imminent collapse. The single most important interpretation rule is to establish the market's trend context first and only then read the zones.
%K and %D crossovers
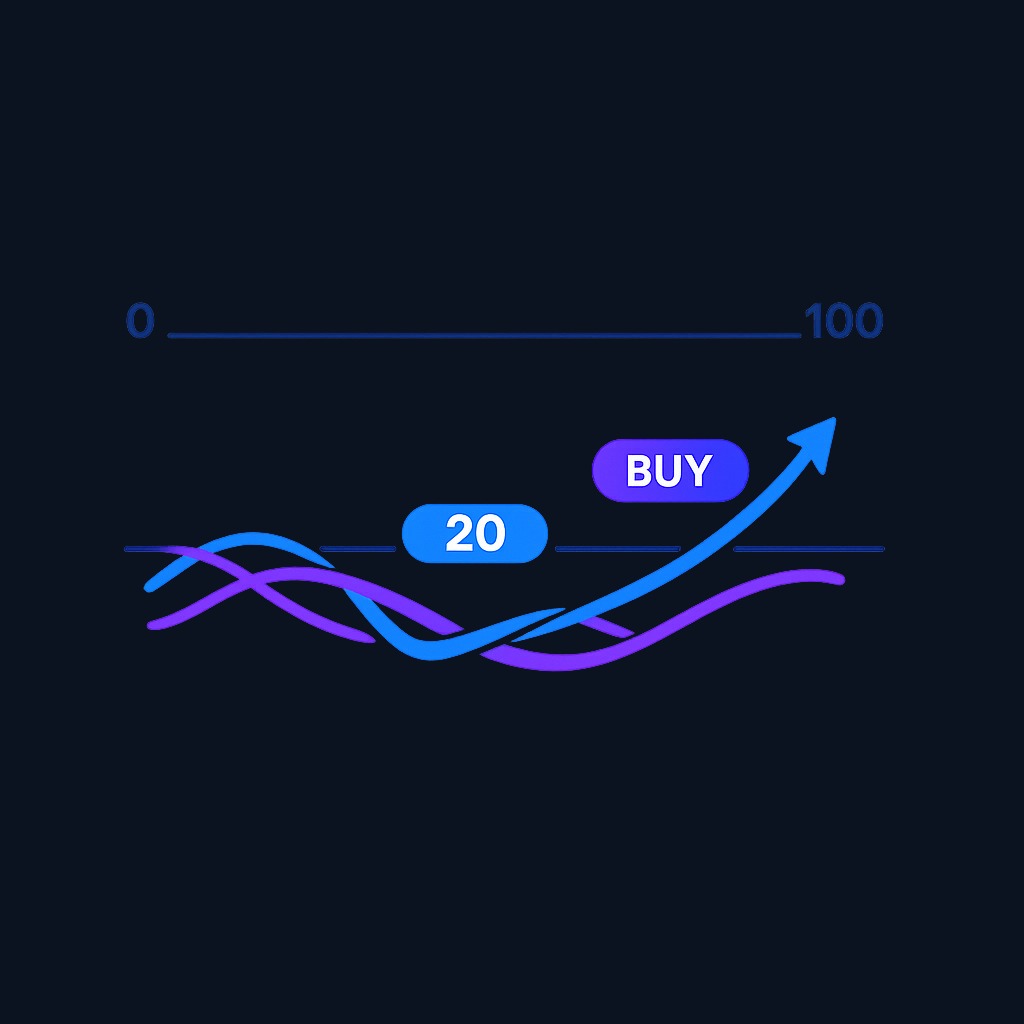
When the fast line crosses above the slow line while both sit below 20, traders sometimes interpret it as momentum turning up from an oversold condition. The mirror image is %K crossing below %D above 80. These are conventions rather than automatic orders: trends can keep the oscillator pinned near an extreme, and mid-range crossovers are not inherently meaningless. Test any threshold and confirmation rule on the market and timeframe you trade.
Divergence
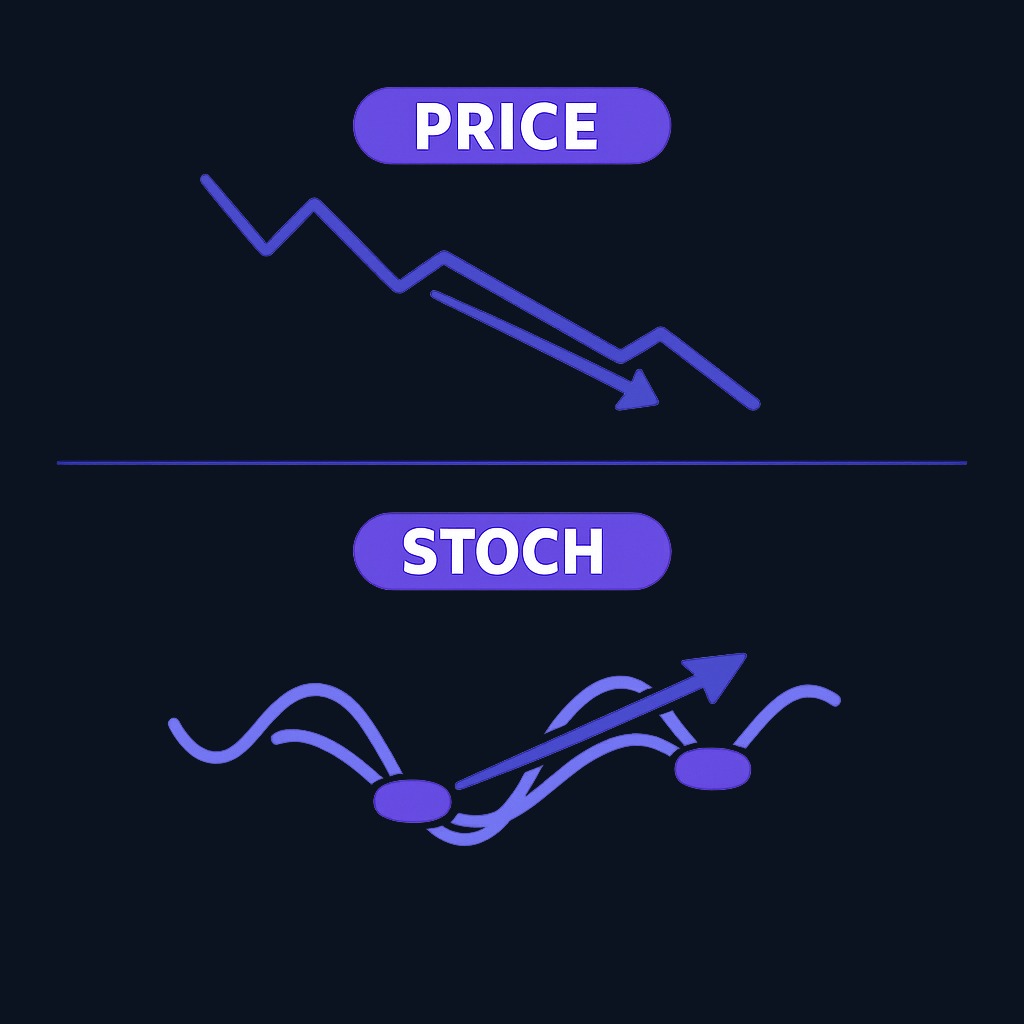
Divergence appears when price and the oscillator disagree. If price makes a lower low but the stochastic makes a higher low, traders describe it as bullish divergence. A bearish divergence is the reverse: higher price highs paired with lower oscillator highs. Divergence is a warning that momentum has changed, not a measured probability of reversal. Traders often wait for a crossover or a break of a price level before acting, but that confirmation rule also needs testing.
Bull and bear setups
George Lane's terminology distinguishes setups from ordinary divergence. A bull setup is a lower high in price paired with a higher high in the stochastic; traders then watch for a subsequent price pullback that may create a long setup. A bear setup is a higher low in price paired with a lower low in the stochastic; traders watch for a subsequent rally that may create a short setup. These unusual patterns are preparation signals, not entries, and sources do not always use the labels consistently. Confirm the definition used by your charting or education source before building rules around it. StockCharts' Stochastic Oscillator guide explains the calculation and interpretation conventions.
Using a trend filter
A common rule pairs the oscillator with a trend measure, such as a moving average. A trader might allow long setups only when price is above the average and short setups only when price is below it. This reduces the number of signals, but there is no universal claim about how many it removes or whether it improves results; both depend on the chosen market, parameters, and costs.
Practice trading with Finelo
Practice in a simulator, learn with bite-sized lessons, and build confidence before risking real money.
Practical applications and hypothetical examples
Hypothetical example: range-bound stock
Imagine a large-cap stock oscillating between $48 and $56 for several months. Several slow-stochastic turns occur near the range edges, then the stock breaks out and the oscillator remains above 80. The example shows why a range rule can stop working when market conditions change; it does not represent actual backtested performance.
Hypothetical example: trend continuation entries
Now imagine an index ETF in a sustained uptrend above its 200-day average. Selling every overbought reading would repeatedly oppose the prevailing trend, while a rule that only evaluates oversold pullbacks would align with it. Neither rule is guaranteed to work; the point is that the same oscillator reading can mean different things in a range and in a trend.
Multi-timeframe confirmation
Some traders require the next timeframe up to agree with the setup. One top-down structure uses the weekly chart for trend context, the daily chart for the setup, and an intraday chart for timing. This rule reduces signal frequency, but agreement across timeframes does not automatically make a signal reliable. Test it without look-ahead bias and include spreads, slippage, and missed fills.
Where the indicator fits in a workflow
In practice the stochastic oscillator works best as a timing layer, not a decision layer. The decision to be interested in an instrument comes from your strategy, your analysis of fundamentals or price structure, and your risk budget. The oscillator then helps you time the entry inside that decision. A useful habit is to write the full trade plan before looking at the oscillator at all: the instrument, the direction you would trade, the price level that proves you wrong, and the size that keeps a loss small. Only then consult the stochastic for timing. Traders who reverse the order, scanning for oscillator signals first and inventing a thesis afterward, tend to accumulate low-quality trades that share nothing but an indicator reading. Remember too that a signal on the chart is not a fill in your account: order handling, spreads, and execution speed sit between the two, and the SEC's investor publication on trade execution explains why your order may execute at a different price than the one on screen when you acted.
What to know before deciding
Common mistakes
- Trading every crossover. Mid-range crossovers are noise. Restricting signals to the outer zones removes most of them.
- Shorting strength and buying weakness in trends. "Overbought" is not a sell order. Pinned readings are a trend signature.
- Over-optimizing settings. Tuning the lookback until backtest results look perfect usually produces settings fitted to randomness.
- Using the oscillator alone. Momentum readings without price structure, volume, or trend context invite whipsaws.
- Ignoring costs. Fast settings generate many trades, and commissions plus spread can consume the edge entirely.
Limitations
The stochastic oscillator is a derivative of price with zero knowledge of earnings, news, or liquidity. It repaints nothing but predicts nothing either; it summarizes the recent past. False signals cluster exactly where markets are most dangerous, in transitions from range to trend. And because the formula is public and simple, obvious signal levels are widely watched, which erodes any mechanical edge. Treat it as a lens for reading momentum, not a system.
The deeper issue is regime change. Every oscillator strategy implicitly bets that the recent market character will continue: ranges keep ranging, trends keep trending. The stochastic cannot tell you when that bet expires. A range trader collecting steady wins from 80/20 reversals gives much of it back the day a breakout starts, unless position sizing and stops limit the damage. This is why experienced users define invalidation in price terms, a level where the range thesis is dead, rather than waiting for the oscillator itself to admit the mistake. Backtests share the same weakness: results harvested from one regime quietly assume that regime persists, so test any stochastic rule across bull markets, bear markets, and flat years before trusting it, and paper trade it in real time with a tool like a paper trading account first.
Decision framework: fitting the stochastic oscillator into a trading plan
| Your intent | Recommended approach |
|---|---|
| Learn technical analysis basics | Study the formula, then observe signals on historical charts without trading them |
| Trade a sideways, range-bound market | Use slow stochastic 80/20 signals with stops outside the range |
| Trade pullbacks within a trend | Combine oversold crossovers with a moving-average trend filter, long-only above the average |
| Build a mechanical system | Backtest across instruments and regimes, count costs, and expect the edge to be modest |
| Invest long-term with rare trades | Skip the oscillator; it answers questions on timeframes you do not trade |
Two rules travel across all of these. Confirm stochastic signals with at least one independent input, price structure, volume, or trend direction. And size positions so that a failed signal costs a fraction of a percent of your account, because a meaningful share of signals will fail regardless of skill.
FAQ
What is the stochastic oscillator in simple terms?
It is a 0-100 gauge showing where the latest close sits within the recent high-low range. High readings mean price closed near the top of the range, low readings near the bottom, and the speed of change hints at momentum shifts.
What do overbought and oversold mean on the stochastic oscillator?
Above 80 the close is near the top of the recent range, below 20 near the bottom. In sideways markets these zones often precede reversals; in trending markets they can persist for long stretches and signal strength rather than an imminent turn.
What is the difference between %K and %D?
%K is the raw stochastic value calculated from the range formula, while %D is a short moving average of %K. Crossovers between them, especially inside the outer zones, are the indicator's classic entry and exit signals.
Is the stochastic oscillator better than the RSI?
They measure momentum differently: the stochastic compares the close to the range, the RSI compares average gains to average losses. Neither is universally better. The stochastic reacts faster and suits range trading; RSI is smoother and often preferred for trend and divergence work. Most traders pick one and learn it deeply.
Where to go from here. The fastest way to internalize the stochastic oscillator is repetition without risk: scroll through historical charts, mark every 80/20 crossover, and grade what happened next in trending versus ranging conditions. The Finelo app builds this kind of pattern recognition with short interactive lessons on indicators, momentum, and chart reading, a low-stakes way to develop judgment before live trading.
Chart AnalysisTechnical AnalysisBeginner
Practice trading with Finelo
Practice in a simulator, learn with bite-sized lessons, and build confidence before risking real money.
About the author
Finelo Team
The Finelo Team creates practical investing and trading education designed to help beginners learn faster with structured challenges, simulator practice, and bite-sized lessons.
Keep reading — Related articles

Chart Analysis
Symmetrical Triangle Pattern: Identification, Breakouts, and Limits
A symmetrical triangle forms when lower highs and higher lows narrow the trading range. Learn to identify it, assess breakout confirmation, and recognize false signals.
Finelo Team

Chart Analysis
Hanging Man Candlestick: The Hammer’s Bearish Twin Explained
A hanging man is a bearish warning candle after an uptrend. Learn how its context differs from a hammer, why confirmation matters, and when the warning fails.
Finelo Team

Chart Analysis
Evening Star Pattern: How to Identify a Three-Candle Reversal
The evening star is a three-candle bearish reversal pattern that forms after an uptrend. Learn its anatomy, confirmation signals, and limitations before interpreting it on a chart.
Finelo Team


