The evening star is a three-candle bearish reversal pattern that forms at the top of an uptrend. It starts with a large bullish candle, follows with a small-bodied "star" that shows the rally stalling, and finishes with a large bearish candle that closes deep into the first candle's body.
Evening Star Pattern: How to Identify a Three-Candle Reversal

The evening star is a three-candle bearish reversal pattern that forms after an uptrend. Learn its anatomy, confirmation signals, and limitations before interpreting it on a chart.
8 min read
Practice trading with Finelo
Practice in a simulator, learn with bite-sized lessons, and build confidence before risking real money.
Want to learn more?
Practice in a simulator, learn with bite-sized lessons, and build confidence before risking real money.
Explore FineloExplore Finelo's 28-day challenges
Turn learning into a daily habit with guided challenge paths.
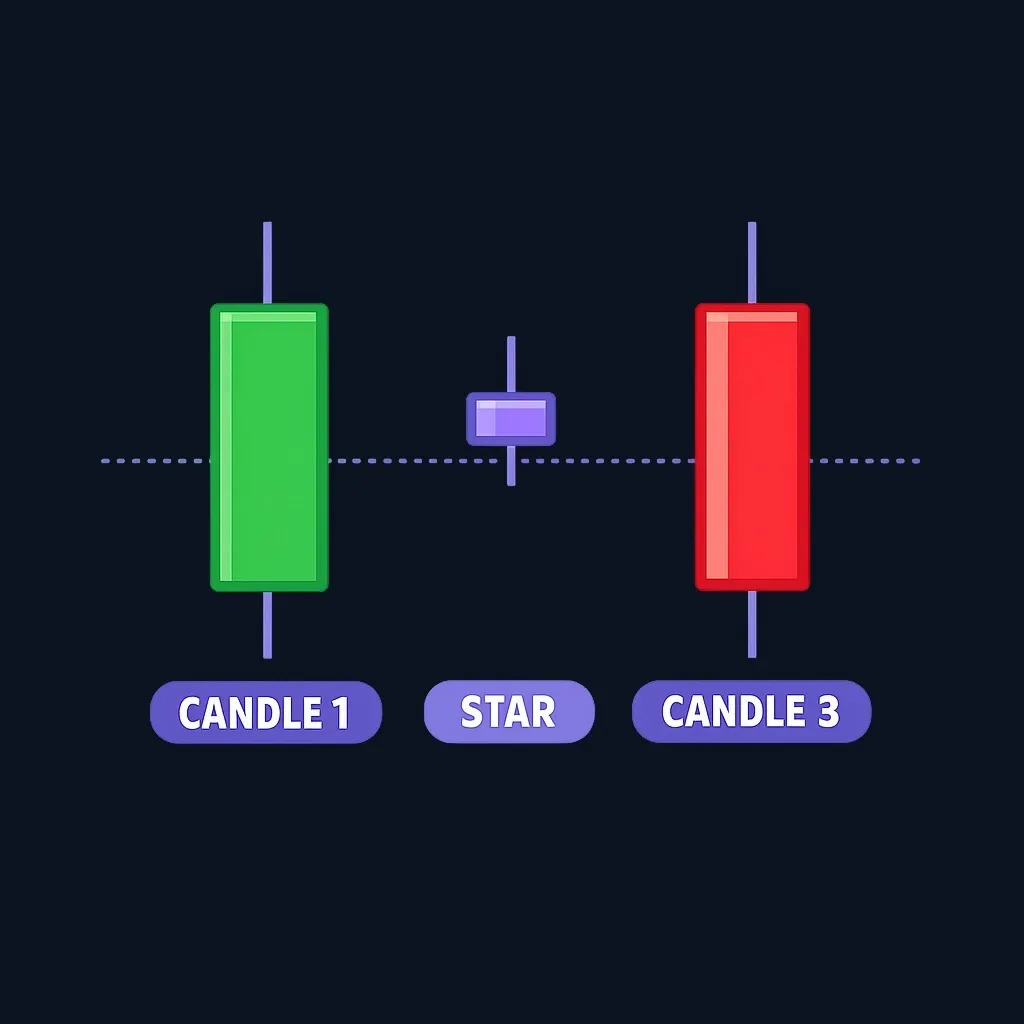
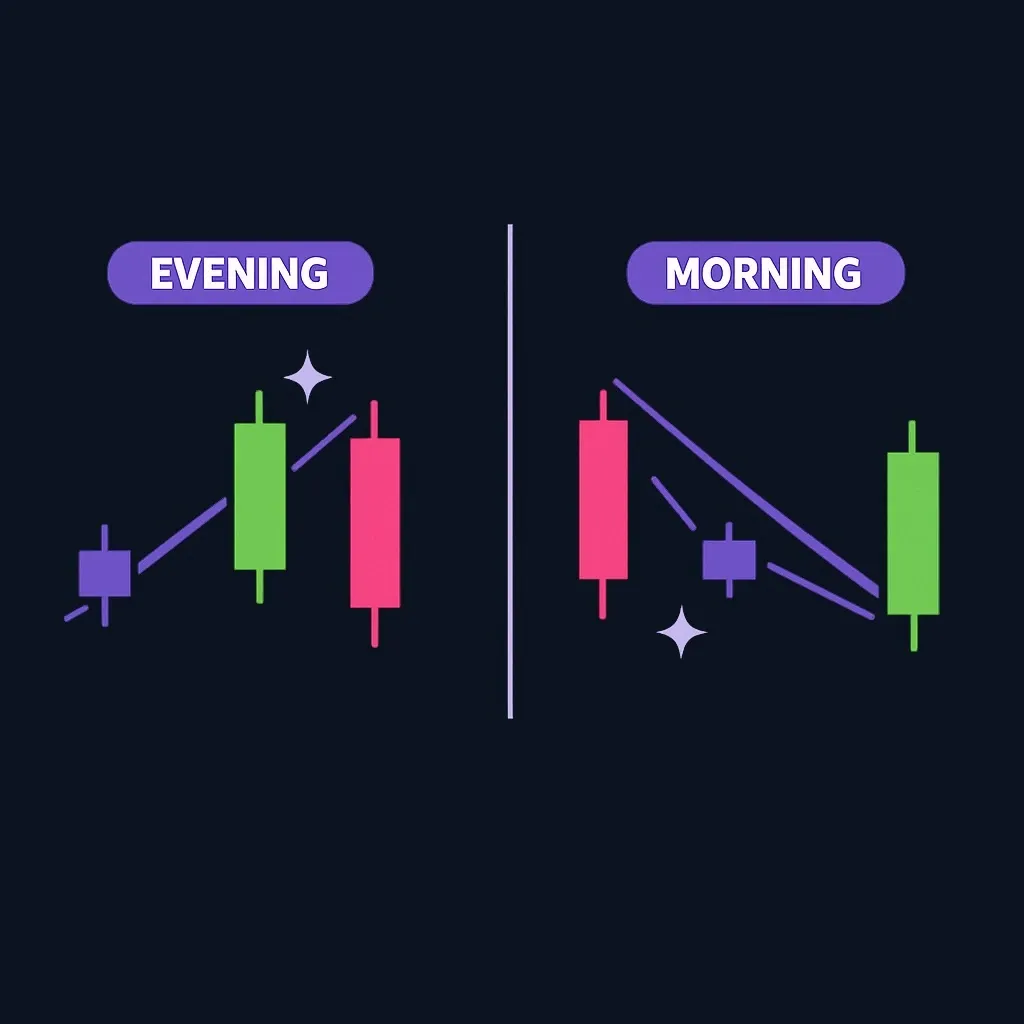
Read together, the three candles tell a short story: buyers were in control, then hesitated, then sellers took over. It is the mirror image of the morning star pattern, which forms at the bottom of a downtrend, the same structure flipped upside down.
Like every candlestick pattern, it is a warning rather than a verdict: it only counts after a clear uptrend, and traders wait for confirmation from the next candle before treating it as a genuine reversal signal.
This guide is part of Finelo's candlestick series. If you are new to reading candles, start with how to read candlesticks; this article assumes you already know what a body and a wick are.
The three candles, one by one
The name comes from Japanese candlestick tradition, where the star is the small candle that hangs above the trend. Each candle carries a specific message.
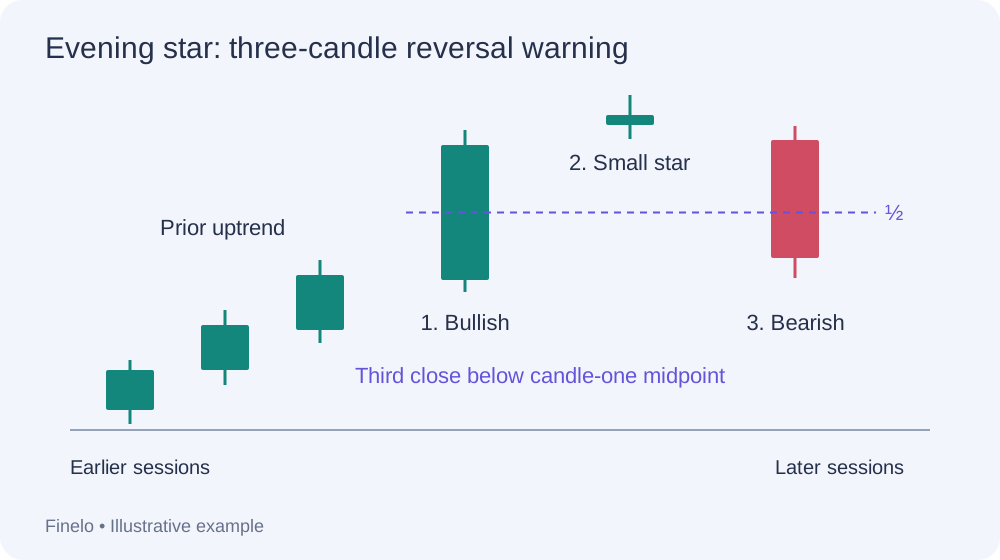
Candle 1: a large bullish candle. The uptrend is alive and well: buyers push price firmly higher and close near the high. Nothing here hints at trouble, which is exactly why the next candle matters.
Candle 2: the star. A small-bodied candle, bullish, bearish, or a doji, sitting near or above the top of candle one, often opening with a gap up on daily stock charts. The tiny body is the tell: despite the strong open, neither side could move price much, and the rally has stalled at the highs. When the star is a doji, the pattern is an evening doji star, and the indecision reads even louder.
Candle 3: a large bearish candle. Sellers take over. Price opens at or below the star and falls hard, closing well into the body of candle one, and the deeper it closes, the stronger the message. A close below candle one's midpoint is the common rule of thumb. This candle converts hesitation into a reversal in progress.
The psychology behind the pattern
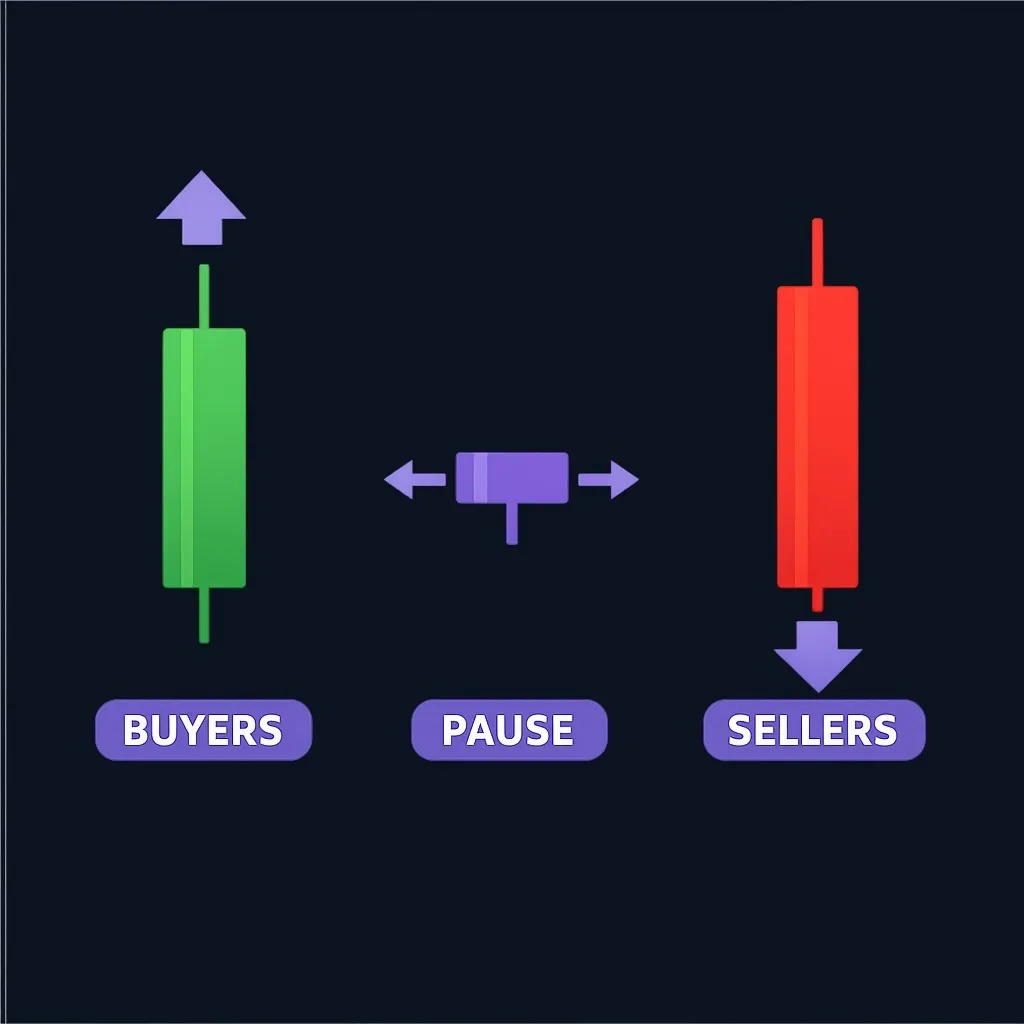
The evening star tells a three-day story about who is winning. The middle day is the hinge: price may open higher, but the follow-through never comes, early buyers take profits, and new buyers balk at top prices. By the third day, with buying exhausted, sellers press, stops get hit, and the decline accelerates into the close.
A rally almost never reverses in a single bar. It stalls first, and the evening star captures that stall and the rejection that immediately follows, which is why it belongs to the same "momentum, pause, reversal" family as the other candlestick reversal patterns.
You can watch control pass from buyers to sellers across the three candles, which is what makes this a good pattern to learn on.
How to identify the evening star: a checklist
Before calling three candles an evening star, check each of these:
- A prior uptrend. The pattern reverses something, so with nothing to reverse it is just noise. Look for a clear run of higher highs and higher lows into the pattern.
- A strong first candle. A wide-bodied bullish candle that continues the trend.
- A small star body. The second candle's body should be small next to its neighbors, a spinning top or doji, and ideally its body does not overlap the first candle's body.
- A decisive third candle. A wide-bodied bearish candle that closes into the lower half of candle one.
- Location and context. The pattern carries more weight at a known resistance level, after an extended run, or when momentum readings are stretched.
Do the candles need gaps?
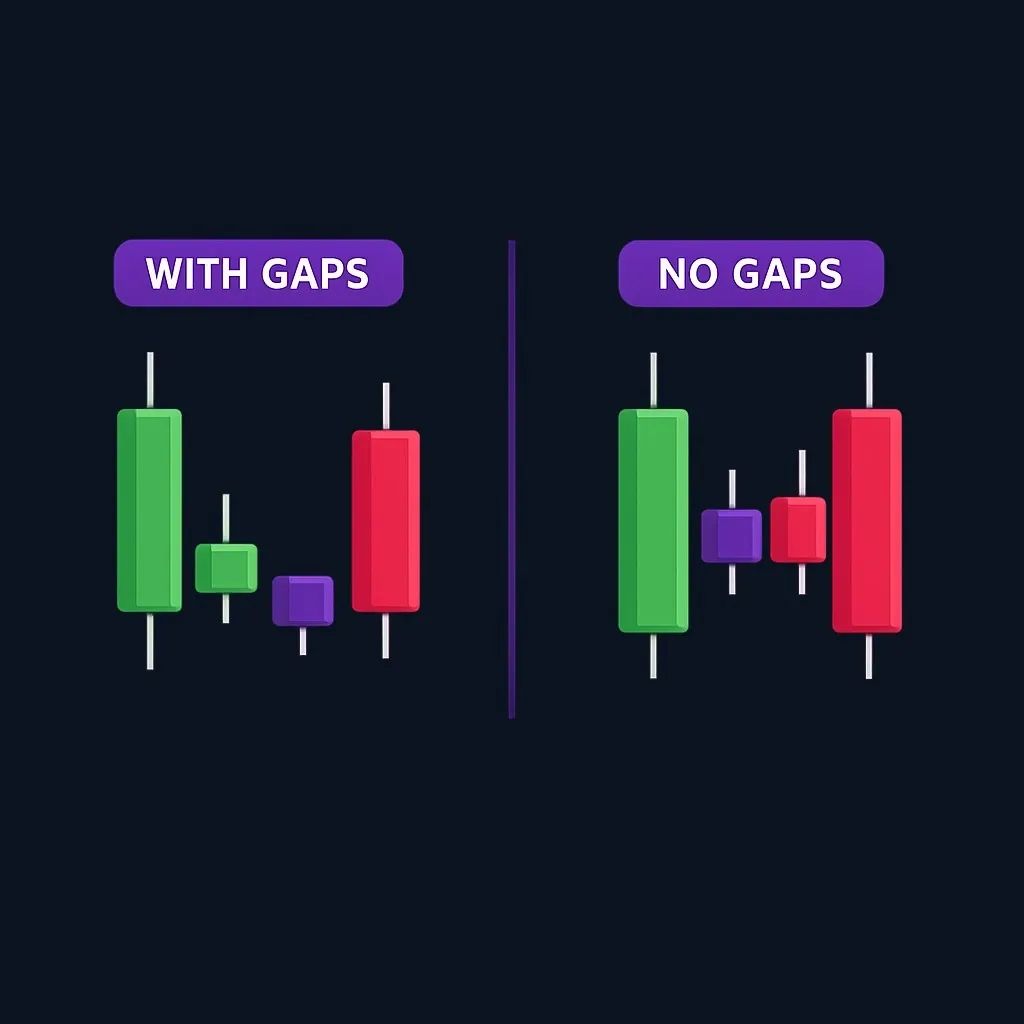
Definitions genuinely differ here, and the reason is worth understanding. The textbook evening star, defined on daily stock charts, expects the star to gap up above candle one's close and candle three to gap down below it. Stocks trade in sessions: the market closes overnight, news piles up, and the next open often jumps, so gaps are natural.
Forex and crypto trade around the clock, so one candle's open is usually the last candle's close, and gaps are rare by construction. On those markets, and on intraday charts generally, most traders accept an evening star without gaps, as long as the star's body is small and the third candle closes deep into the first. If you trade 24-hour markets, Finelo's guide to candlestick reversal patterns in forex covers how the classic patterns adapt.
Confirmation and invalidation
An evening star on its own is a warning, not a trigger, so traders usually look for confirmation before treating the reversal as real. The cleanest confirmation is follow-through: the next candle closes below the low of the third candle, extending the reversal instead of bouncing. Heavier volume on candle three and on that confirmation candle points to real selling rather than a quiet drift, and a pattern that prints at resistance or alongside a stretched momentum reading carries more weight still.
Invalidation matters just as much. If price stalls after candle three and then closes back above the star, the reversal story has failed and buyers have absorbed the selling. That is useful information in itself: it says the uptrend still has demand behind it. Whatever the outcome, position sizing and stop placement belong to risk management, not to the pattern.
It is the next candle that decides: it confirms the reversal or quietly cancels it.
Practice trading with Finelo
Practice in a simulator, learn with bite-sized lessons, and build confidence before risking real money.
Evening star vs shooting star
Beginners mix these two up constantly, partly because the names sound alike and partly because the patterns are genuinely related.
| Evening star | Shooting star | |
|---|---|---|
| Candles | Three | One |
| Where it forms | Top of an uptrend | Top of an uptrend |
| Signal | Bearish reversal | Bearish reversal (warning) |
| Key feature | Small star between two large opposite candles | Long upper wick, small body near the low |
| Built-in confirmation | Candle three is partial confirmation | None, needs the next candle |
The neat connection is that the star candle inside an evening star can itself be a shooting star, the single-candle warning nested inside the three-candle structure. The evening star is generally treated as the more complete signal, because its bearish third candle is already built in.
Evening star vs morning star
The morning star is the evening star's exact mirror: a large bearish candle, a small star below the trend, and a large bullish candle closing deep into the first, printed at the bottom of a downtrend instead of the top of an uptrend. Understand one and you understand both, because the psychology simply swaps buyers and sellers. Together they make one of the cleanest pattern pairs in candlestick analysis, alongside single-session mirrors like the engulfing pair.
A worked example
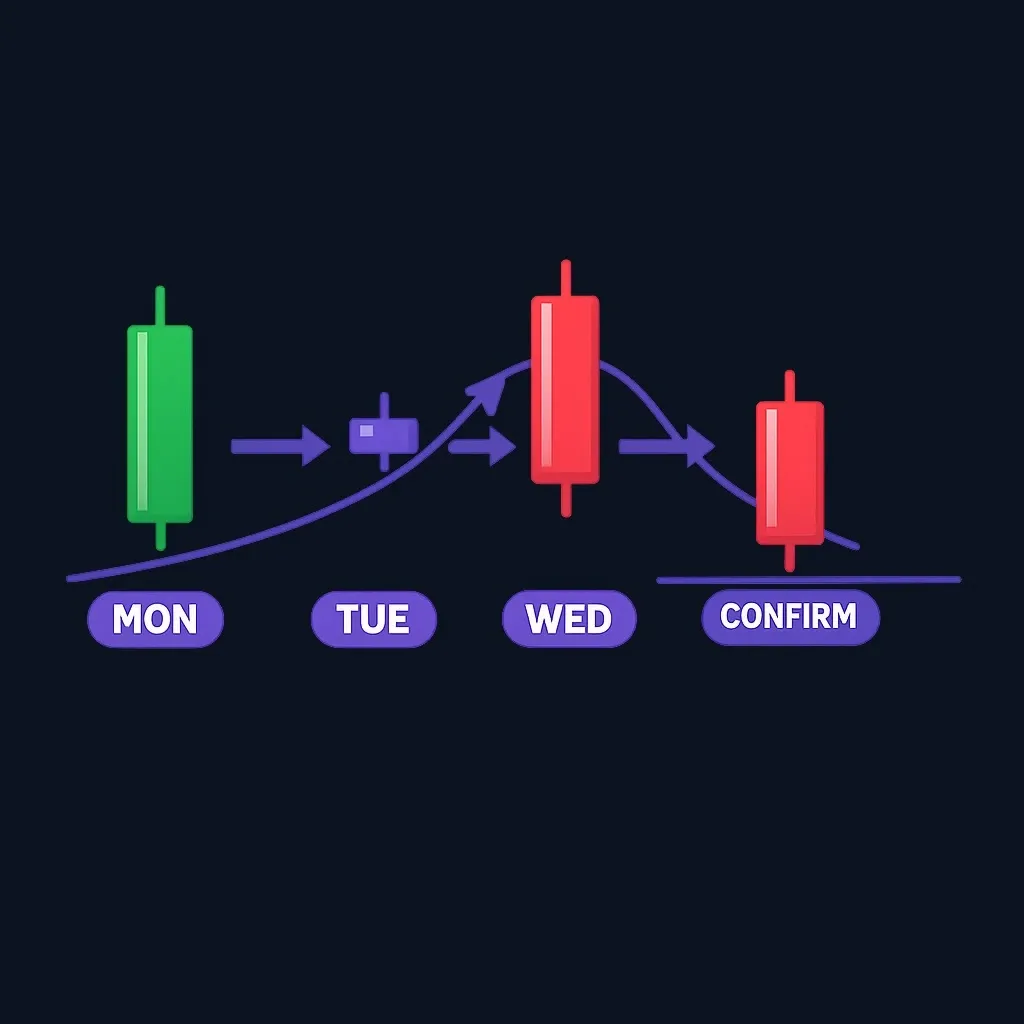
Picture a stock in a steady daily uptrend, closing higher for weeks. Monday prints a wide bullish candle and the trend looks healthy. Tuesday gaps up on eager buying but goes nowhere, chopping in a narrow range and closing near its open, leaving a small star above Monday's candle. Wednesday opens below Tuesday's close and sells off all session, finishing beneath the midpoint of Monday's candle on rising volume.
That is the evening star complete: conviction, stall, rejection. A cautious trader still waits, and when Thursday breaks below Wednesday's low the reversal is confirmed, graduating from a warning at the highs to a shift in control, though even then it describes probabilities, not certainties. Had Thursday instead closed back above the star, the pattern would have failed and the uptrend would keep the benefit of the doubt.
Limitations: when the evening star fails
An honest reading of the evening star includes its failure modes. It fails often in choppy markets, where lookalike sequences appear constantly and mean nothing, because with no real trend there is nothing to reverse. It can also mark a pause rather than a top: many evening stars resolve into a shallow pullback before the uptrend resumes, since the pattern signals that buyers stalled, not for how long.
It also has no dependable win rate. You will find pages quoting precise accuracy percentages, and they deserve skepticism: results vary enormously by market, timeframe, trend strength, and definition, and most quoted figures are unverifiable.
Finally, rarity cuts both ways: a strict evening star with gaps on a daily chart does not appear often, which makes clean examples more meaningful, but also makes it tempting to see the pattern where it is not.
Next steps
The fastest way to make the evening star stick is to study it beside its twin. Read Finelo's morning star pattern guide and notice how every element mirrors, then browse the candlestick patterns cheat sheet to see where the star patterns sit in the wider family, and practice spotting prior trends with how to read stock charts for beginners.
Inside the Finelo app, you can study real charts and practice buy, sell, and hold decisions on real market data with virtual funds. There are no deposits, no withdrawals, and no broker connection, it is a closed practice loop, so the only cost of a wrong read is the lesson. To go deeper, Finelo publishes educational material for beginners, and you can check Finelo reviews, the About Finelo page, or the Finelo support center.
Final decisions are always yours. The chart deals in odds and stories, never in certainties.
Educational note: This article is for educational purposes only and does not constitute financial, investment, legal, or tax advice. Finelo is an educational product, not a brokerage or adviser. Simulator practice uses virtual funds. Investing and trading involve risk, including possible loss of principal; verify account-specific requirements with your broker.
Sources and Further Verification
Frequently asked questions
Is the evening star pattern bullish or bearish?
Bearish. The evening star forms at the top of an uptrend and signals a potential reversal to the downside. Its bullish mirror, the same structure printed at the bottom of a downtrend, is the morning star. As always, it counts only after a genuine prior trend and with confirmation.
How reliable is the evening star pattern?
There is no trustworthy universal win rate. Its usefulness depends on context: a clear prior uptrend, a decisive third candle, supporting volume, and confirmation from the next candle. Treat it as a probabilistic warning that strengthens or weakens with that context, never as a standalone signal.
What is the difference between an evening star and a shooting star?
The shooting star is a single candle with a long upper wick; the evening star is a three-candle sequence. Both are bearish signals at the top of an uptrend, and the middle candle of an evening star can itself be a shooting star. The evening star is the more complete structure.
Do the candles have to gap?
On daily stock charts the textbook pattern includes gaps, with the star gapping up and the third candle opening lower. In forex and crypto, which trade continuously, gaps are rare, so traders accept the pattern without them as long as the star is small and the third candle closes deep into the first candle's body.
What is an evening doji star?
An evening star whose middle candle is a doji, meaning its open and close are nearly equal. Because a doji is the purest picture of indecision, many traders read the evening doji star as a slightly stronger version of the pattern. See our guide to the doji candle.
Is the evening star pattern rare?
The strict, textbook version is fairly uncommon, especially with gaps on daily charts. Looser versions without gaps appear more often, particularly on intraday and 24-hour markets. That relative rarity is one reason traders pay closer attention when a clean evening star prints after an extended rally.
Evening Star PatternChart AnalysisBeginner
Practice trading with Finelo
Practice in a simulator, learn with bite-sized lessons, and build confidence before risking real money.
About the author
Finelo Team
The Finelo Team creates practical investing and trading education designed to help beginners learn faster with structured challenges, simulator practice, and bite-sized lessons.
Keep reading — Related articles

Chart Analysis
Symmetrical Triangle Pattern: Identification, Breakouts, and Limits
A symmetrical triangle forms when lower highs and higher lows narrow the trading range. Learn to identify it, assess breakout confirmation, and recognize false signals.
Finelo Team

Chart Analysis
Hanging Man Candlestick: The Hammer’s Bearish Twin Explained
A hanging man is a bearish warning candle after an uptrend. Learn how its context differs from a hammer, why confirmation matters, and when the warning fails.
Finelo Team

Chart Analysis
SMT Divergence Trading: Learn the Concept & Risk Controls
In trading, SMT stands for Smart Money Technique, and it is almost always discussed as SMT divergence. It is a concept from the ICT (Inner Circle Trader) framework that describes one specific moment: two markets that normally move together stop confirming each other.
Finelo Team


