This candlestick patterns cheat sheet is a single reference that groups the most common candle formations by what traders commonly read into them: bullish, bearish, or neutral. The tables below list each pattern with the number of candles it takes to form, a plain-English note on what it is said to signal, and a link to a full explainer where one exists. Scan for the shape you are looking at, read the one-line meaning, then check the context before you treat it as anything more than a clue.
Candlestick Patterns Cheat Sheet: A Visual Guide to the Most Common Patterns

A beginner-friendly candlestick patterns cheat sheet grouping the most common formations by bullish, bearish, and neutral bias — with candle counts, plain-English meanings, and links to full explainers.
12 min read
Practice trading with Finelo
Practice in a simulator, learn with bite-sized lessons, and build confidence before risking real money.
Want to learn more?
Practice in a simulator, learn with bite-sized lessons, and build confidence before risking real money.
Explore FineloExplore Finelo's 28-day challenges
Turn learning into a daily habit with guided challenge paths.
This page is for beginners and early-intermediate learners who are still building chart literacy and want a reference they can come back to. Skim the tables below, download the free printable PDF to keep on hand, and use the links to go deeper on any pattern that keeps showing up in your charts.
A cheat sheet helps you name a pattern. It does not tell you what price will do next.
This article is for education only and is not financial advice.
How to read a candlestick in 30 seconds
Before the tables are useful, you need to know what one candle reports. Each candlestick summarizes four prices for a period: the open, the high, the low, and the close, usually shortened to OHLC. The thick rectangle is the real body, the distance between the open and the close. The thin lines above and below are the wicks, also called shadows, and they mark the highest and lowest prices reached during that period.
Color carries the direction. A candle is usually green or hollow when price closed above where it opened, and red or filled when it closed below. A long body means one side controlled the period. A small body means buyers and sellers finished close to even. Long wicks show price traveled to a level and was pushed back from it.
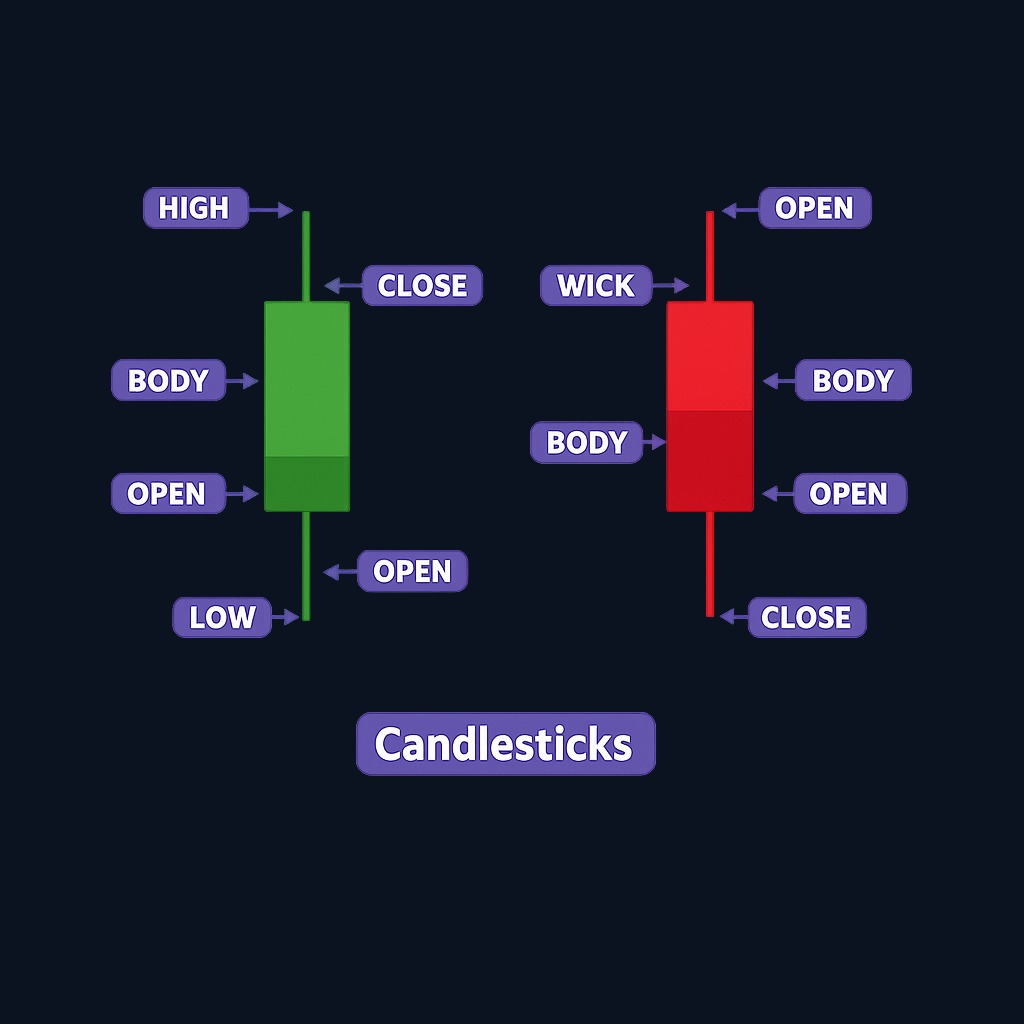
Every pattern in the tables below is just a specific arrangement of bodies and wicks, sometimes across two or three candles. If you want the longer version, see the full guide on how to read candlesticks.
How the patterns are organized
There are two useful ways to sort candlestick patterns:
By market bias, patterns fall into bullish, bearish, and neutral groups. Bullish patterns are commonly read as a possible move up, bearish as a possible move down, and neutral patterns carry no built-in direction until later candles resolve them.
By structure, patterns are sorted by how many candles they need: single-candle, double-candle, and triple-candle formations. Triple-candle patterns take longer to complete, so they arrive later but are generally treated as a firmer signal than a single bar.
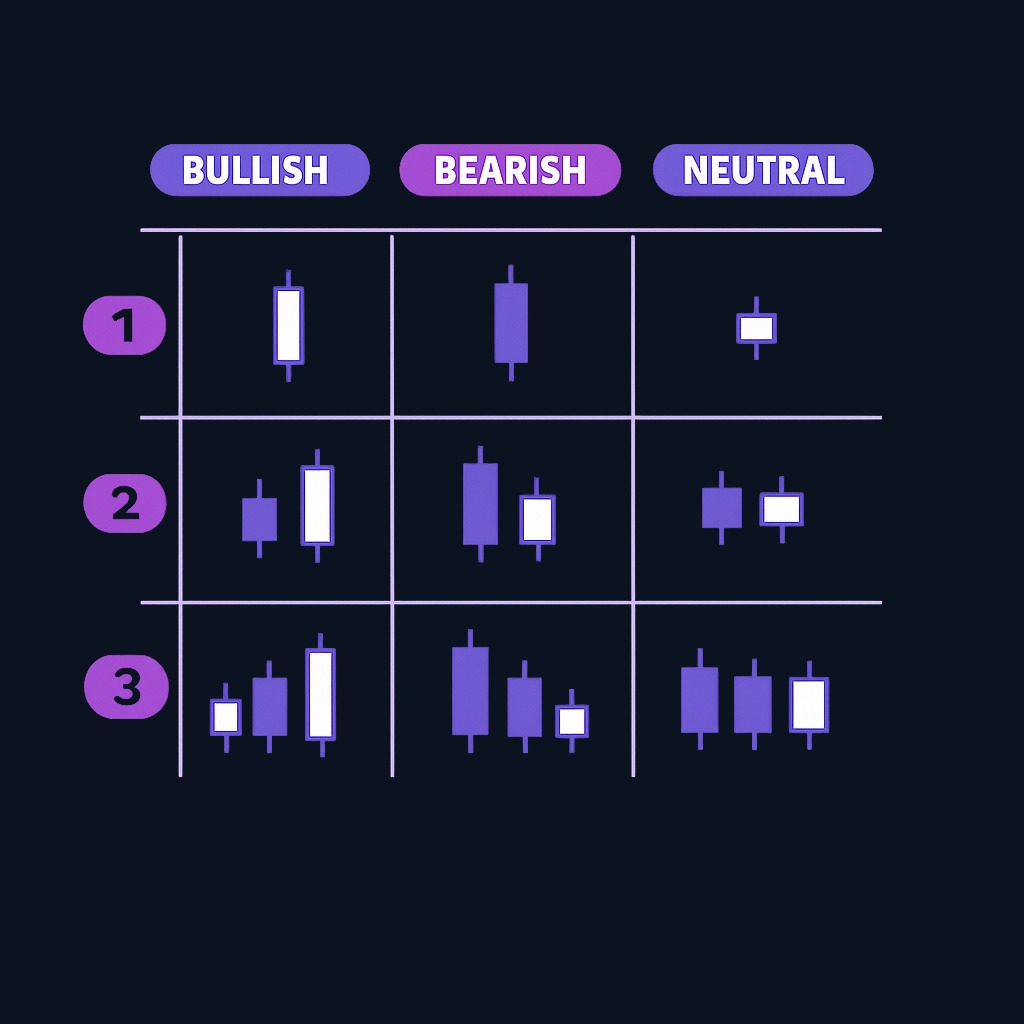
A second distinction runs underneath both: reversal versus continuation. Most of the named patterns below are reversal patterns, meaning they are read as a possible turn against the prior trend, and most of them require that prior trend to exist before the label means anything. The marubozu sits outside the pair, since it reports conviction within a single period and can appear anywhere. The three-candle momentum patterns are usually classified as reversals when they form at the end of a trend, though some traders also read them as continuation when they appear part-way through a move that is already running.
One reminder before the tables. A bias label describes what a pattern is conventionally said to signal, not what will happen. A bullish pattern in the wrong setting — mid-range, on thin volume, or against a strong trend — usually means very little.
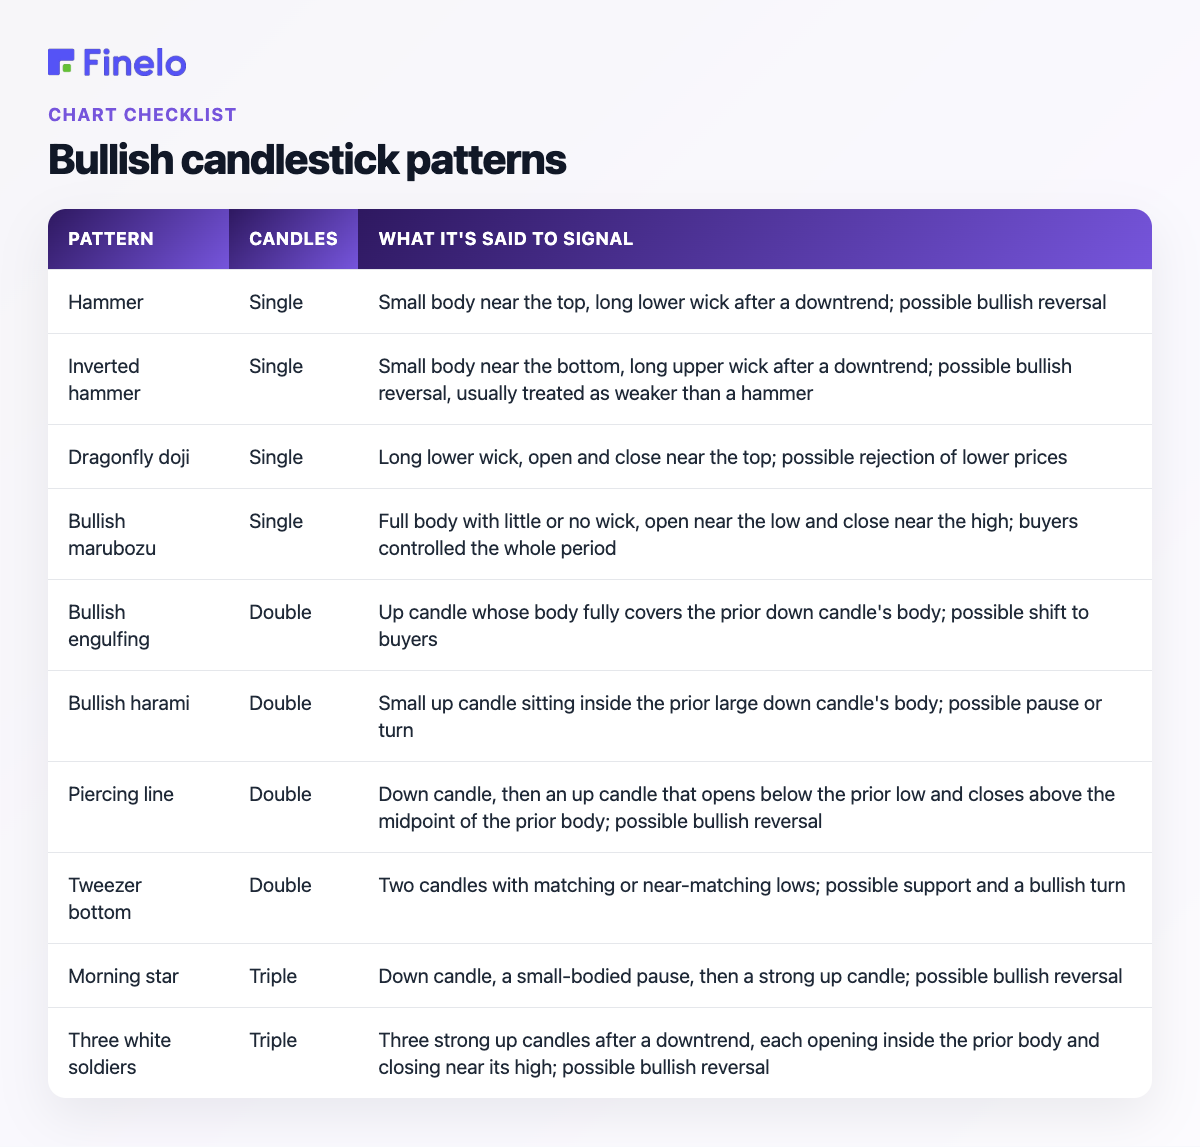
Bullish candlestick patterns
These are commonly read as possible upside reversals or as signs of buying strength. They carry the most weight after a decline or at a level price has respected before.
| Pattern | Candles | What it's said to signal |
|---|---|---|
| Hammer | Single | Small body near the top, long lower wick after a downtrend; possible bullish reversal |
| Inverted hammer | Single | Small body near the bottom, long upper wick after a downtrend; possible bullish reversal, usually treated as weaker than a hammer |
| Dragonfly doji | Single | Long lower wick, open and close near the top; possible rejection of lower prices |
| Bullish marubozu | Single | Full body with little or no wick, open near the low and close near the high; buyers controlled the whole period |
| Bullish engulfing | Double | Up candle whose body fully covers the prior down candle's body; possible shift to buyers |
| Bullish harami | Double | Small up candle sitting inside the prior large down candle's body; possible pause or turn |
| Piercing line | Double | Down candle, then an up candle that opens below the prior low and closes above the midpoint of the prior body; possible bullish reversal |
| Tweezer bottom | Double | Two candles with matching or near-matching lows; possible support and a bullish turn |
| Morning star | Triple | Down candle, a small-bodied pause, then a strong up candle; possible bullish reversal |
| Three white soldiers | Triple | Three strong up candles after a downtrend, each opening inside the prior body and closing near its high; possible bullish reversal |
Bearish candlestick patterns
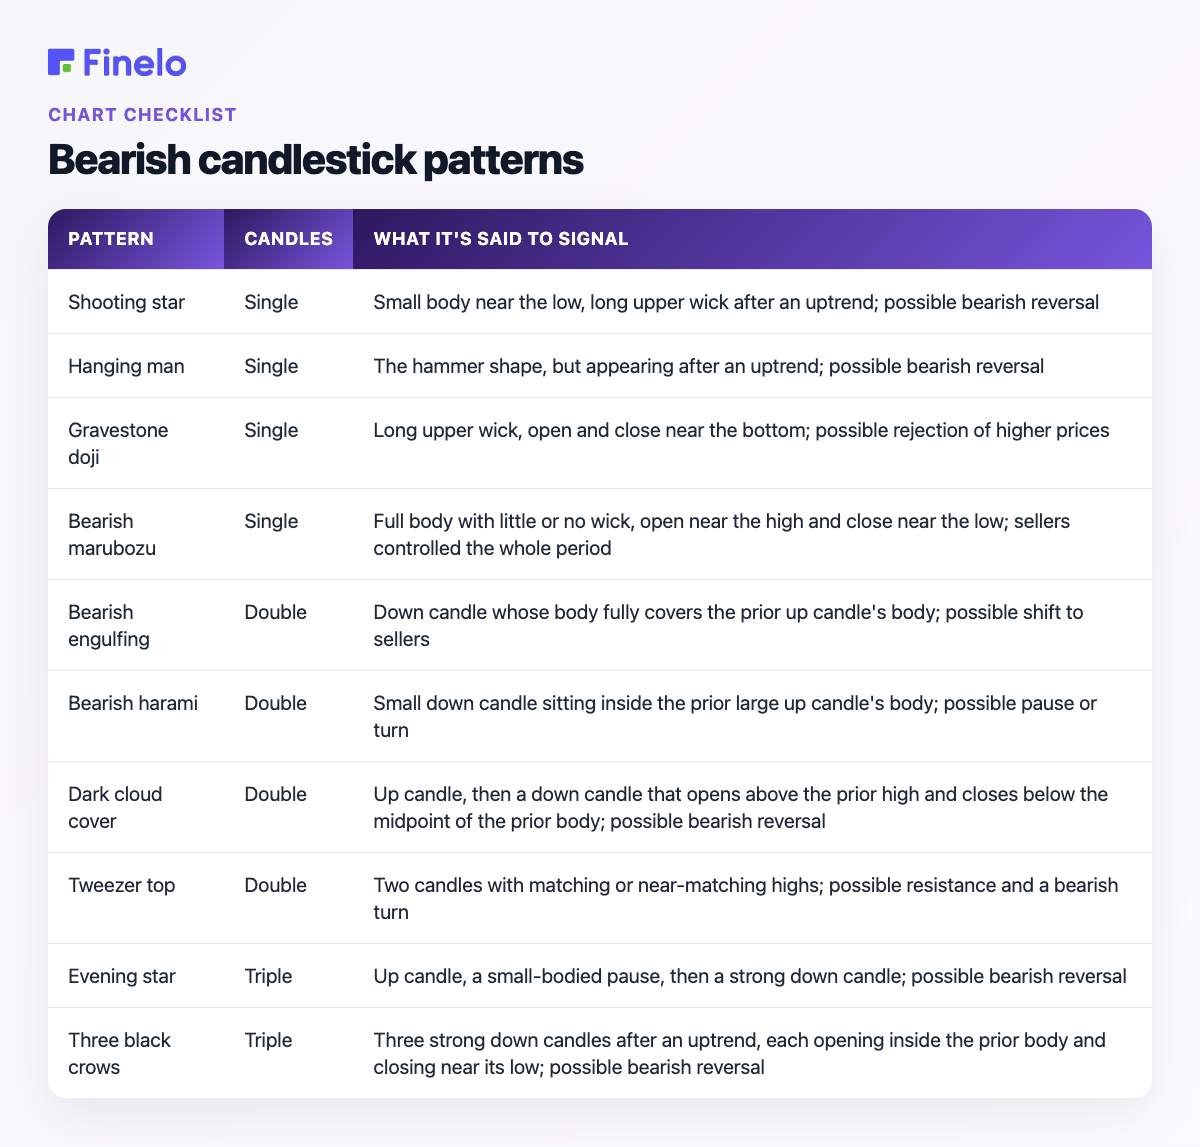
These are commonly read as possible downside reversals or as signs of selling pressure. They carry the most weight after an advance or at resistance.
| Pattern | Candles | What it's said to signal |
|---|---|---|
| Shooting star | Single | Small body near the low, long upper wick after an uptrend; possible bearish reversal |
| Hanging man | Single | The hammer shape, but appearing after an uptrend; possible bearish reversal |
| Gravestone doji | Single | Long upper wick, open and close near the bottom; possible rejection of higher prices |
| Bearish marubozu | Single | Full body with little or no wick, open near the high and close near the low; sellers controlled the whole period |
| Bearish engulfing | Double | Down candle whose body fully covers the prior up candle's body; possible shift to sellers |
| Bearish harami | Double | Small down candle sitting inside the prior large up candle's body; possible pause or turn |
| Dark cloud cover | Double | Up candle, then a down candle that opens above the prior high and closes below the midpoint of the prior body; possible bearish reversal |
| Tweezer top | Double | Two candles with matching or near-matching highs; possible resistance and a bearish turn |
| Evening star | Triple | Up candle, a small-bodied pause, then a strong down candle; possible bearish reversal |
| Three black crows | Triple | Three strong down candles after an uptrend, each opening inside the prior body and closing near its low; possible bearish reversal |
Neutral and indecision patterns
These show buyers and sellers finishing close to even. On their own they signal a pause, and the direction depends entirely on the surrounding trend and what the next candles do.
| Pattern | Candles | What it's said to signal |
|---|---|---|
| Doji | Single | Open and close at nearly the same price, leaving a tiny body; indecision |
| Long-legged doji | Single | Tiny body with long wicks on both sides; active disagreement within the period |
| Spinning top | Single | Small body with wicks on both sides, larger than a doji's; hesitation rather than direction |
Practice trading with Finelo
Practice in a simulator, learn with bite-sized lessons, and build confidence before risking real money.
Look-alike patterns that trip beginners up
Several of these shapes are identical to each other. What separates them is where they appear, which is the single most common source of beginner confusion with candlesticks.
| These look the same | Telling them apart |
|---|---|
| Hammer and hanging man | Same candle. After a downtrend it is a hammer and reads bullish; after an uptrend it is a hanging man and reads bearish |
| Inverted hammer and shooting star | Same candle. After a downtrend it is an inverted hammer and reads bullish; after an uptrend it is a shooting star and reads bearish |
| Engulfing and harami | Opposites. In an engulfing the second candle's body covers the first; in a harami the second sits inside the first |
| Doji and spinning top | Both show indecision. A doji has almost no body at all; a spinning top has a small but visible one |
| Gravestone doji and shooting star | Both have a long upper wick. The gravestone has essentially no body; the shooting star has a small one |
How reliable are candlestick patterns?
This is the part most cheat sheets skip, and it matters more than the list itself. On their own, candlestick patterns are modest signals, and every one of them fails regularly. A textbook shape can be followed by price doing the opposite, especially in choppy markets, on thin volume, or on very short timeframes where these formations appear constantly and contradict each other.
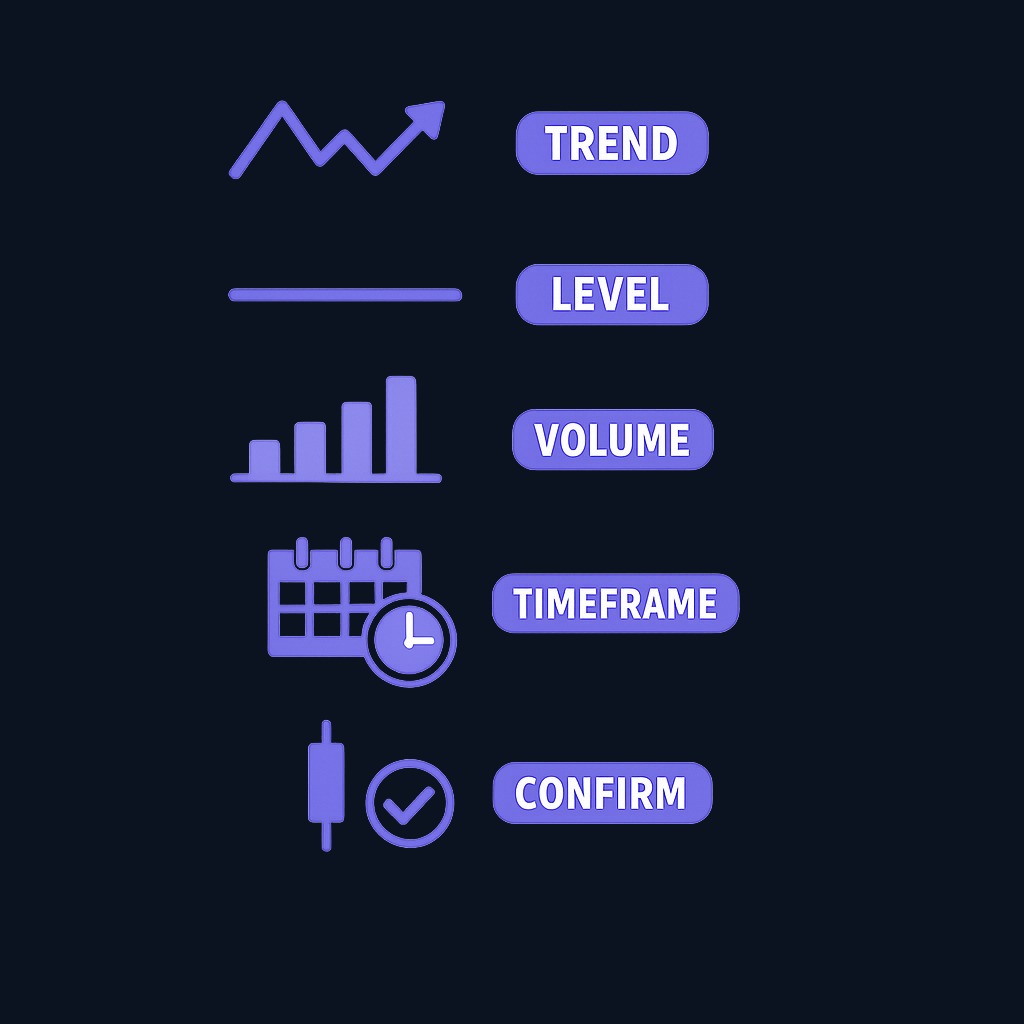
Patterns tend to carry more weight when several things agree: a clear prior trend for a reversal pattern to reverse, a meaningful level such as support or resistance, above-average volume, a higher timeframe such as daily or weekly, and a confirmation candle after the pattern completes. None of that turns a pattern into a certainty. It improves the quality of the clue, which is a different thing.
Be skeptical of any source quoting a precise success rate for a pattern without naming the market, the timeframe, the sample size, the confirmation rule, and the costs assumed. Without those, a percentage is decoration.
How to actually use this cheat sheet
A cheat sheet is a recognition aid, not a trading system. The most useful way to work through it is to build familiarity, not to memorize names and act on the first shape you spot.
- Identify: When you see a candle or group of candles you do not recognize, find the closest match in the tables above.
- Read the context: Check the prior trend, the level it formed at, and the volume. The same shape means different things in different places.
- Open the explainer: Follow the link to the full article for the psychology, the look-alikes, and the limits.
- Name the confirmation: Decide what the next candle would have to do to support your read, before it happens rather than after.
- Define invalidation: If you cannot name the level that would prove the read wrong, you have a chart, not a plan.
- Practice on history: Scroll back through old charts with the future hidden, judge each pattern on what was visible at the time, and record the misses as carefully as the hits.

The pattern gets your attention. The follow-through earns the decision.
Download the free candlestick patterns PDF
Want the sheet to keep? Download the original Finelo candlestick patterns cheat sheet (PDF) and save it or print it as a quick reference while you learn. It covers the same bullish, bearish, and neutral patterns shown above, grouped for fast scanning, with the same plain-English meanings.
Practice before you risk anything
Reading a list of patterns and recognizing one on a live chart under time pressure are different skills, and only the second one matters. The gap between them closes with repetition, not with more reading.
Inside the Finelo app, you can study candlestick structure and practice buy, sell, and hold decisions on real market data with virtual funds. There are no deposits, no withdrawals, and no broker connection — it is a closed practice loop, so the only cost of a wrong read is the lesson. Pair that with a review habit: log the patterns you spotted, what you expected, and what actually happened.
Final decisions are always yours. A pattern is a tool for thinking more clearly, not a substitute for judgment.
Where to learn more
A cheat sheet is a starting point, not a destination. Once a pattern catches your eye, open its explainer to learn the psychology behind it, the context that makes it meaningful, and the look-alikes that trip beginners up. Over time the goal is to read candles fluently enough that you rarely need the sheet at all.
Start with the individual guides linked in the tables above, such as the hammer candlestick, the doji candle, the engulfing candle, and the shooting star candlestick. For the multi-candle price structures that form above the candle level, see the chart patterns cheat sheet. To go deeper, Finelo publishes educational material for beginners, and you can check Finelo reviews, the About Finelo page, or the Finelo support center.
Finelo is an educational product. The simulator uses virtual funds and real market data and is not a brokerage. Final trading and investing decisions are yours and are made through your own brokerage account when you choose to act. Not financial advice.
Frequently asked questions
What are the main candlestick patterns?
The most common ones group by bias. Bullish examples include the hammer, bullish engulfing, morning star, and three white soldiers. Bearish examples include the shooting star, bearish engulfing, evening star, and three black crows. Neutral examples include the doji and the spinning top, which stay undirected until later candles resolve them.
Which candlestick patterns are bullish and which are bearish?
Bullish patterns usually appear after a decline and hint at buyers stepping in: hammer, bullish engulfing, piercing line, morning star. Bearish patterns usually appear after an advance and hint at sellers taking over: shooting star, bearish engulfing, dark cloud cover, evening star. Neutral patterns such as the doji depend entirely on context.
How do I read a candlestick?
Each candle shows four prices: open, high, low, and close. The body spans the open and close, and the wicks mark the high and low. Green or hollow usually means price closed above the open, red or filled below it. Long bodies show conviction; long wicks show rejection.
How reliable are candlestick patterns?
Modest on their own, and prone to false signals. They tend to matter more with a clear prior trend, at a key level, on higher timeframes, with volume, and after a confirmation candle. Treat any pattern as one clue among several, and be skeptical of unsourced win-rate claims.
What is the difference between single, double, and triple candlestick patterns?
It refers to how many candles form the shape. Single-candle patterns such as the doji, hammer, and shooting star are read from one bar. Double-candle patterns such as engulfing and harami need two. Triple-candle patterns such as the morning star need three, arriving later but generally treated as firmer.
Is there a free downloadable candlestick cheat sheet?
Yes. You can download the original Finelo candlestick patterns cheat sheet as a PDF from this page and keep it as a reference. It is an educational summary rather than trading advice, built to help you recognize patterns while you learn, not to tell you when to buy or sell.
candlestick patternscheat sheetchart analysistechnical analysisbeginner
Practice trading with Finelo
Practice in a simulator, learn with bite-sized lessons, and build confidence before risking real money.
About the author
Finelo Team
The Finelo Team creates practical investing and trading education designed to help beginners learn faster with structured challenges, simulator practice, and bite-sized lessons.
Keep reading — Related articles

Chart Analysis
Symmetrical Triangle Pattern: Identification, Breakouts, and Limits
A symmetrical triangle forms when lower highs and higher lows narrow the trading range. Learn to identify it, assess breakout confirmation, and recognize false signals.
Finelo Team

Chart Analysis
Hanging Man Candlestick: The Hammer’s Bearish Twin Explained
A hanging man is a bearish warning candle after an uptrend. Learn how its context differs from a hammer, why confirmation matters, and when the warning fails.
Finelo Team

Chart Analysis
Evening Star Pattern: How to Identify a Three-Candle Reversal
The evening star is a three-candle bearish reversal pattern that forms after an uptrend. Learn its anatomy, confirmation signals, and limitations before interpreting it on a chart.
Finelo Team


