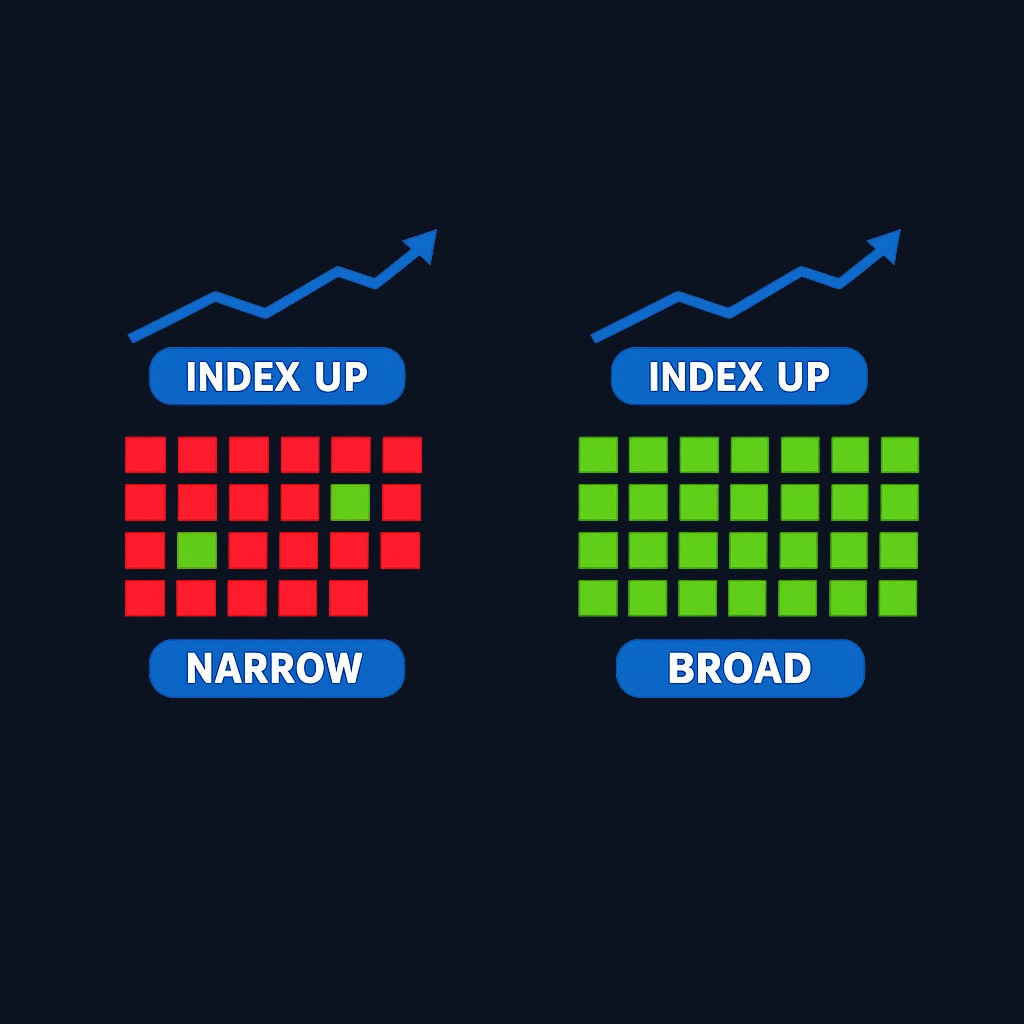
A market breadth indicator measures how many stocks are actually participating in a market move, rather than how far the index itself has traveled. If an index rises while most of its stocks fall, breadth is weak and the rally rests on a few large names. If most stocks rise together, breadth is strong and the move has broad support.
What is a Market Breadth Indicator and How Does It Work?
A market breadth indicator measures how many stocks are actually participating in a market move, rather than how far the index itself has traveled. If an index rises while most of its stocks fall, breadth is weak and…
7 min read
Practice trading with Finelo
Practice in a simulator, learn with bite-sized lessons, and build confidence before risking real money.
Want to learn more?
Practice in a simulator, learn with bite-sized lessons, and build confidence before risking real money.
Explore FineloExplore Finelo's 28-day challenges
Turn learning into a daily habit with guided challenge paths.
Traders and investors use breadth as a health check on trends: price tells you what the market did, breadth tells you how many stocks agreed. This guide explains the main indicators, how to read them, where they mislead, and a framework for using them sensibly. It is educational content, not financial advice.
Why market breadth matters
Major indexes are weighted by company size, so a handful of giant stocks can drag an index up or down almost alone. That creates a blind spot: an index at record highs can conceal a market where the average stock is already declining.
Breadth exposes that gap. When gains are spread across most sectors and sizes, an advance tends to be sturdier, because it does not depend on a few leaders staying perfect. When participation narrows, the market's foundation thins, and shocks to the leading names carry outsized consequences. Breadth analysis also works in reverse: after long declines, improving breadth beneath a still-falling index is one of the earlier signs that selling pressure is exhausting itself.

None of this makes breadth a crystal ball. Narrow markets can keep rising for a long time. Breadth is best treated as a measure of trend quality, a reason for more or less confidence, rather than a timing trigger on its own.
Common types of market breadth indicators
Advance-decline line. The most widely used breadth measure. Each day, count advancing stocks minus declining stocks, and add the result to a running total. A rising A/D line alongside a rising index confirms broad participation. An index making new highs while the A/D line flattens or falls is the classic warning of narrowing leadership.
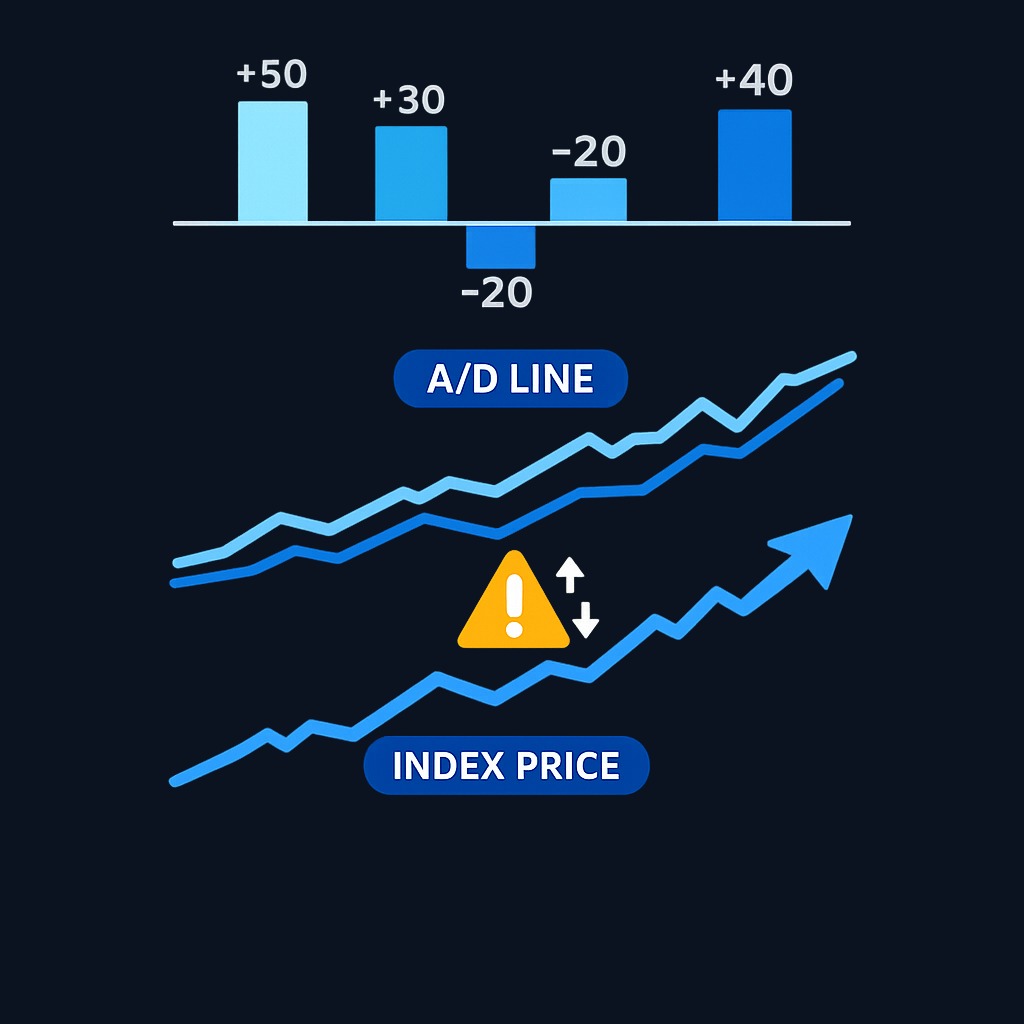
Advance-decline ratio and net advances. Simpler daily snapshots of the same data: the ratio of advancers to decliners, or the raw difference. Extreme one-sided days, where advancers or decliners overwhelm the other side, often mark moments of panic or euphoria.
New highs minus new lows. Counts stocks hitting 52-week highs versus 52-week lows. A healthy uptrend produces a steady stream of new highs. When new lows expand while the index holds up, deterioration is spreading beneath the surface.
Percentage of stocks above a moving average. Measures what share of stocks trade above their 50-day or 200-day moving averages. Readings near the extremes describe stretched conditions: very few stocks above their averages signals washed-out pessimism, while nearly all above signals a crowded advance.
Up-down volume measures. Compare the trading volume flowing into rising stocks against volume in falling ones. Volume-weighted breadth catches days when the crowd's money concentrates on one side of the market.
McClellan Oscillator and Summation Index. Smoothed versions of advance-decline data that translate raw breadth into momentum-style readings, making shifts in participation easier to spot at the cost of added complexity.
How to analyze market breadth data
The core technique is comparison: read the breadth measure against the index itself and look for agreement or divergence.
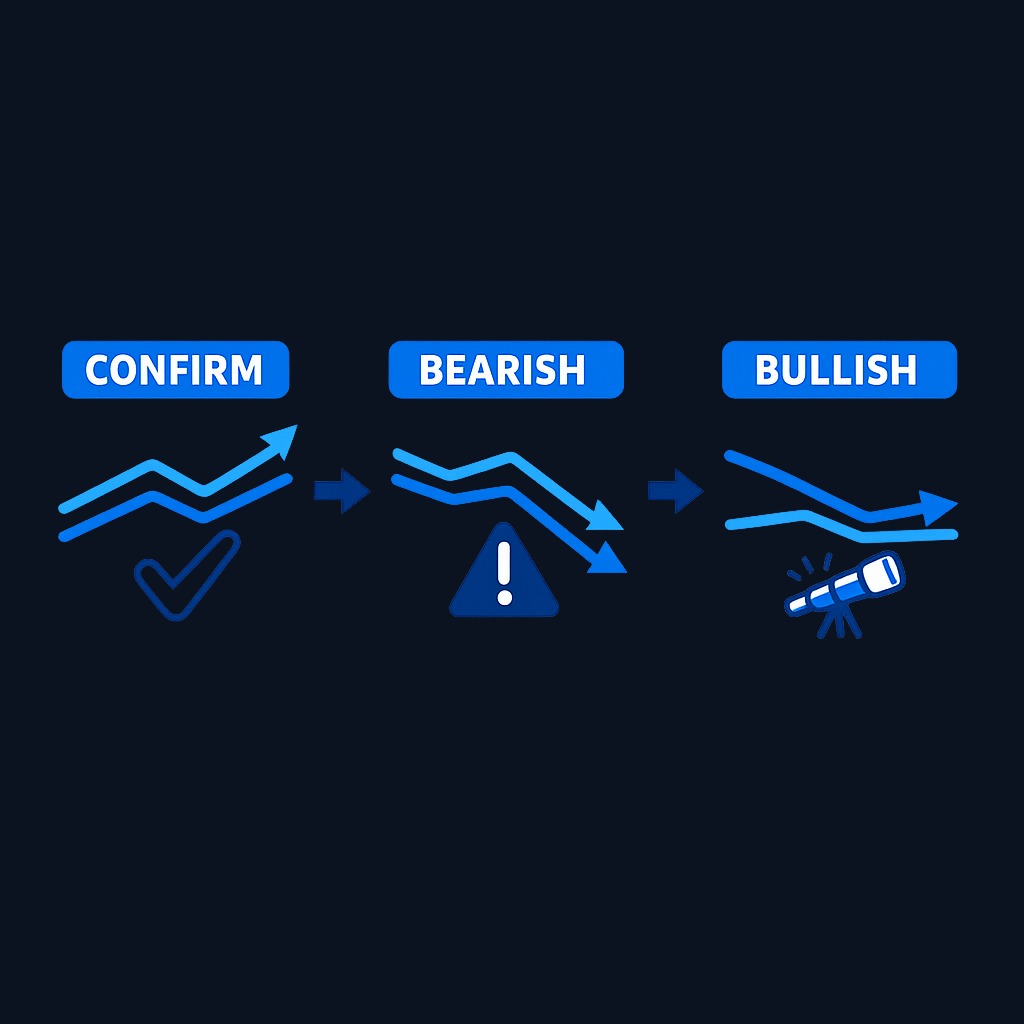
- Confirmation. Index rising, A/D line rising, new highs expanding: the trend is broadly supported, and pullbacks are more likely to be routine.
- Bearish divergence. Index rising while breadth measures weaken across weeks or months: leadership is narrowing. This does not date the top, but it lowers the quality of the trend and argues for tighter risk management.
- Bullish divergence. Index falling to new lows while fewer stocks make new lows and the A/D line holds above its prior trough: selling is losing reach, which often precedes stabilization.
- Extremes. Breadth statistics at rare one-sided levels, such as overwhelming down-volume days or very low percentages of stocks above their moving averages, describe stretched conditions that historically have not persisted long.
Three practical habits improve the reading. Use multiple breadth measures rather than one, since each captures a different slice of participation. Judge divergences over weeks, not days, because daily noise produces endless false alarms. And always anchor breadth to the price trend itself: breadth qualifies a trend, it does not replace it.
Limitations of market breadth indicators
- Divergences run early. Breadth can weaken many months before a market peak, and acting on the first signal means leaving a strong market long before it tops.
- Composition quirks. Exchange-level advance-decline data includes many interest-rate-sensitive listed securities that are not common stocks, which can distort the line during rate-driven periods.
- Structural narrowness. In eras dominated by a few giant companies, indexes can legitimately advance on narrow leadership for extended stretches. Weak breadth described those markets accurately and still made poor timing advice.
- No position sizing or levels. Breadth says nothing about where support sits or how much to risk; it is context, not a trading plan.
- Crowded interpretation. When everyone watches the same divergence, the obvious reading is often already priced in.
The honest summary: breadth indicators describe participation with real accuracy, but translating that description into profitable timing is the hard part, and it fails often enough to demand humility.
Practice trading with Finelo
Practice in a simulator, learn with bite-sized lessons, and build confidence before risking real money.
Market breadth in action
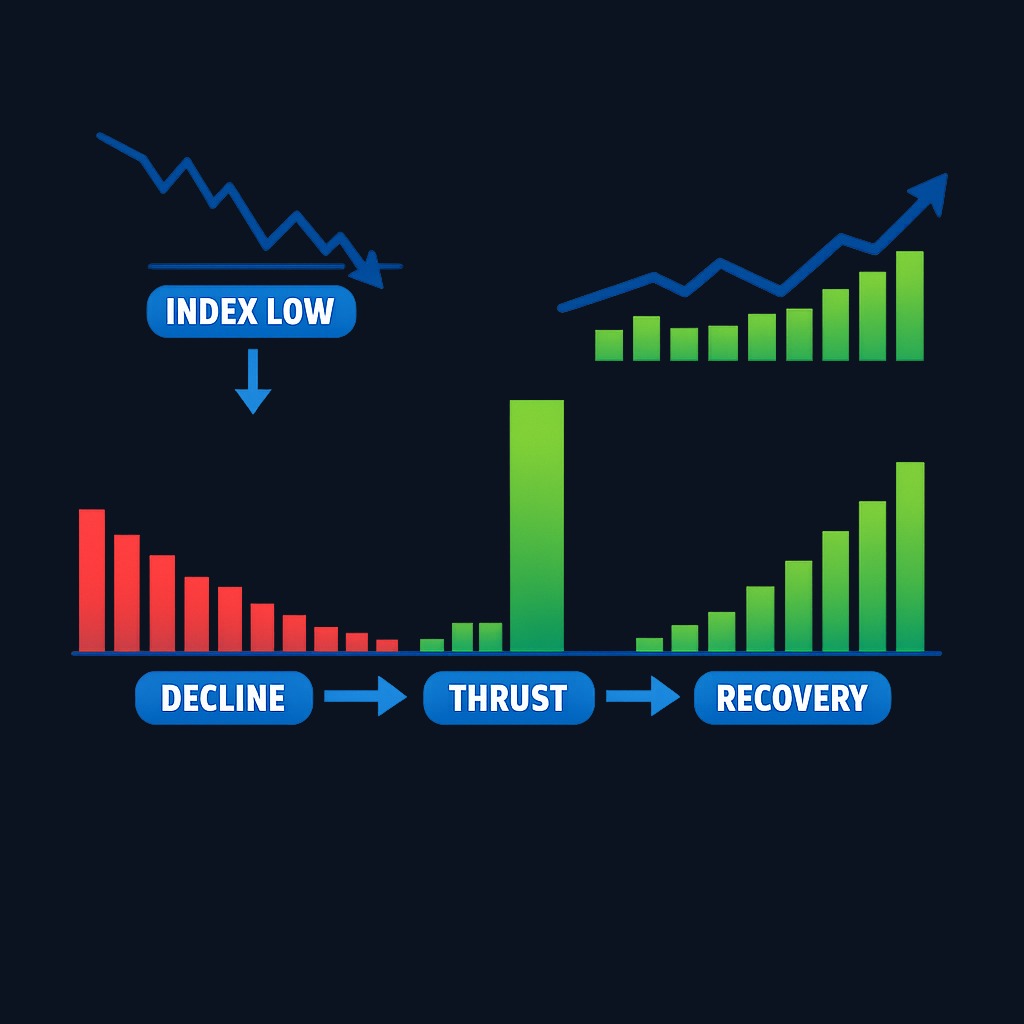
Two recurring patterns show the tool at its best. Ahead of several historical market peaks, indexes pressed to new highs while advance-decline lines had already rolled over and new-low counts crept upward; investors reading breadth had months of quiet warning that the advance was hollowing out, even though prices peaked later. The signal's value was not calling the top on a date, but justifying gradually reduced risk while headlines still celebrated records.
The mirror image appears near major bottoms. In late stages of severe declines, indexes made fresh lows while fewer individual stocks joined them, and single days arrived where advancing volume utterly dominated after months of the reverse. Those breadth thrusts, broad and violent surges in participation, have historically been among the more reliable signals that a new advance was beginning. Traders who waited for a thrust rather than guessing at bottoms let participation itself confirm the turn.
What to know before deciding
Before adding breadth analysis to your process, decide what role it plays. For long-term investors, breadth works best as a risk dial: strong participation supports staying fully invested, while persistent narrowing argues for rebalancing discipline and realistic expectations, not for wholesale exits. For traders, breadth extremes and thrusts are context for entries and exits, never standalone triggers. Choose two or three measures you understand, from data sources you trust, and study how they behaved across at least two full market cycles before letting them influence money. And accept the base rate: most divergences resolve harmlessly, so the tool earns its keep in the rare cases it flags something big.
Decision framework: using breadth in your process
- Define the market's trend first from price alone.
- Check participation. Does the A/D line, new highs-lows, and percent-above-average data confirm the price trend?
- Grade the trend's quality. Full agreement: normal risk. Mixed signals: watch. Persistent multi-measure divergence: reduce aggressiveness at the margin.
- Watch for extremes. Rare one-sided readings deserve attention as potential turning-point context.
- Act through your plan, not the indicator. Let breadth adjust position sizing, rebalancing timing, or alertness, while entries and exits follow your existing rules.
Conclusion and next steps
A market breadth indicator measures how many stocks stand behind a market move. Broad participation marks sturdy trends; narrowing participation marks fragile ones; rare extremes mark moments when crowds have run one-sided. The tools, from advance-decline lines to breadth thrusts, describe trend quality well, provided you read them over weeks, combine several, and resist treating early warnings as precise timing.
Next steps: pull up your preferred index alongside its advance-decline line and percent-of-stocks-above-200-day series, then practice grading the current trend's quality. Do that weekly for a quarter before letting it touch real decisions. For structured lessons on market signals and chart tools, Finelo offers beginner-friendly trading and investing education.
Frequently asked questions
What is the best market breadth indicator?
No single measure dominates. The advance-decline line is the standard starting point, and pairing it with new highs minus new lows plus the percentage of stocks above their 200-day average covers participation from three angles. The best setup is the small set you actually understand.
Can market breadth predict a crash?
No indicator predicts crashes reliably. Breadth deterioration preceded many historical peaks, but it also produced warnings that markets ignored for months or years. Treat weakening breadth as lowered trend quality, not a countdown.
What is a breadth thrust?
A breadth thrust is a sudden, overwhelming surge in participation, such as a day or short stretch where advancing stocks and volume dwarf declining ones after a downtrend. Historically such thrusts have often marked the early phase of durable recoveries.
Where can I find market breadth data?
Most charting platforms publish advance-decline statistics, new highs and lows, and percent-above-moving-average series for major exchanges and indexes. Exchange and index providers also publish daily participation statistics that feed these tools.
marketbreadthindicator
Practice trading with Finelo
Practice in a simulator, learn with bite-sized lessons, and build confidence before risking real money.
About the author
Finelo Team
The Finelo Team creates practical investing and trading education designed to help beginners learn faster with structured challenges, simulator practice, and bite-sized lessons.
Keep reading — Related articles

Chart Analysis
Symmetrical Triangle Pattern: Identification, Breakouts, and Limits
A symmetrical triangle forms when lower highs and higher lows narrow the trading range. Learn to identify it, assess breakout confirmation, and recognize false signals.
Finelo Team

Chart Analysis
Hanging Man Candlestick: The Hammer’s Bearish Twin Explained
A hanging man is a bearish warning candle after an uptrend. Learn how its context differs from a hammer, why confirmation matters, and when the warning fails.
Finelo Team

Chart Analysis
Evening Star Pattern: How to Identify a Three-Candle Reversal
The evening star is a three-candle bearish reversal pattern that forms after an uptrend. Learn its anatomy, confirmation signals, and limitations before interpreting it on a chart.
Finelo Team


