Bollinger Bands plot a moving average with an upper and lower band based on the recent standard deviation of price, so the envelope widens when measured volatility rises and tightens when it falls. Developed by John Bollinger in the 1980s, the bands show whether price is high or low relative to its own recent range; they do not assign a probability to the next move. This page is for beginning and intermediate traders who want a working understanding of the tool, not just a definition. Read the calculation and limitations below, then test any proposed use on historical and simulated data before risking capital. John Bollinger's official overview is the primary reference for the indicator's purpose and standard construction.
Bollinger Bands Explained: How the Indicator Works and How to Trade It
Bollinger Bands plot a moving average with an upper and lower band based on the recent standard deviation of price, so the envelope widens when measured volatility rises and tightens when it falls. Developed by John…
9 min read
Practice trading with Finelo
Practice in a simulator, learn with bite-sized lessons, and build confidence before risking real money.
Want to learn more?
Practice in a simulator, learn with bite-sized lessons, and build confidence before risking real money.
Explore FineloExplore Finelo's 28-day challenges
Turn learning into a daily habit with guided challenge paths.
The three components of Bollinger Bands
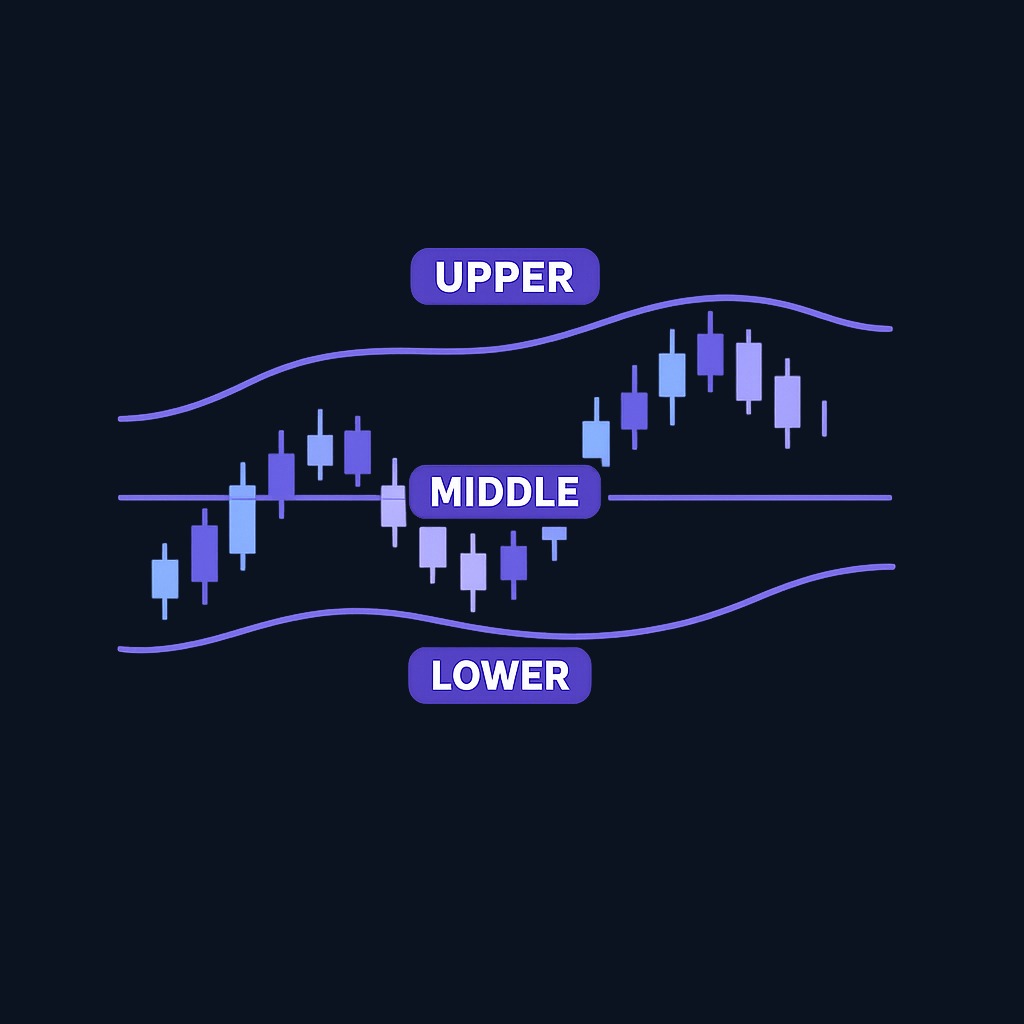
The indicator draws three lines over price:
- Middle band. A simple moving average, typically 20 periods. It represents the short-term consensus price and anchors the whole structure.
- Upper band. The middle band plus two standard deviations of price over the same lookback. It is a relative upper reference, not a price ceiling.
- Lower band. The middle band minus two standard deviations. It is a relative lower reference, not a price floor.
The familiar “about 95% within two standard deviations” rule applies to observations from a fixed normal distribution. It must not be read as a promise that 95% of prices will remain inside Bollinger Bands: market data are not normally distributed, and both the mean and the bands roll forward with every bar. A band touch therefore shows only that price has reached a relative extreme under the chosen lookback and settings. It is not, by itself, evidence of reversal or continuation.
How Bollinger Bands are calculated
The math takes three steps for each new bar:
- Compute the 20-period simple moving average of closing prices. This is the middle band.
- Compute the standard deviation of the same 20 closes, which measures how widely prices have scattered around that average.
- Add and subtract two standard deviations from the middle band to plot the upper and lower bands.
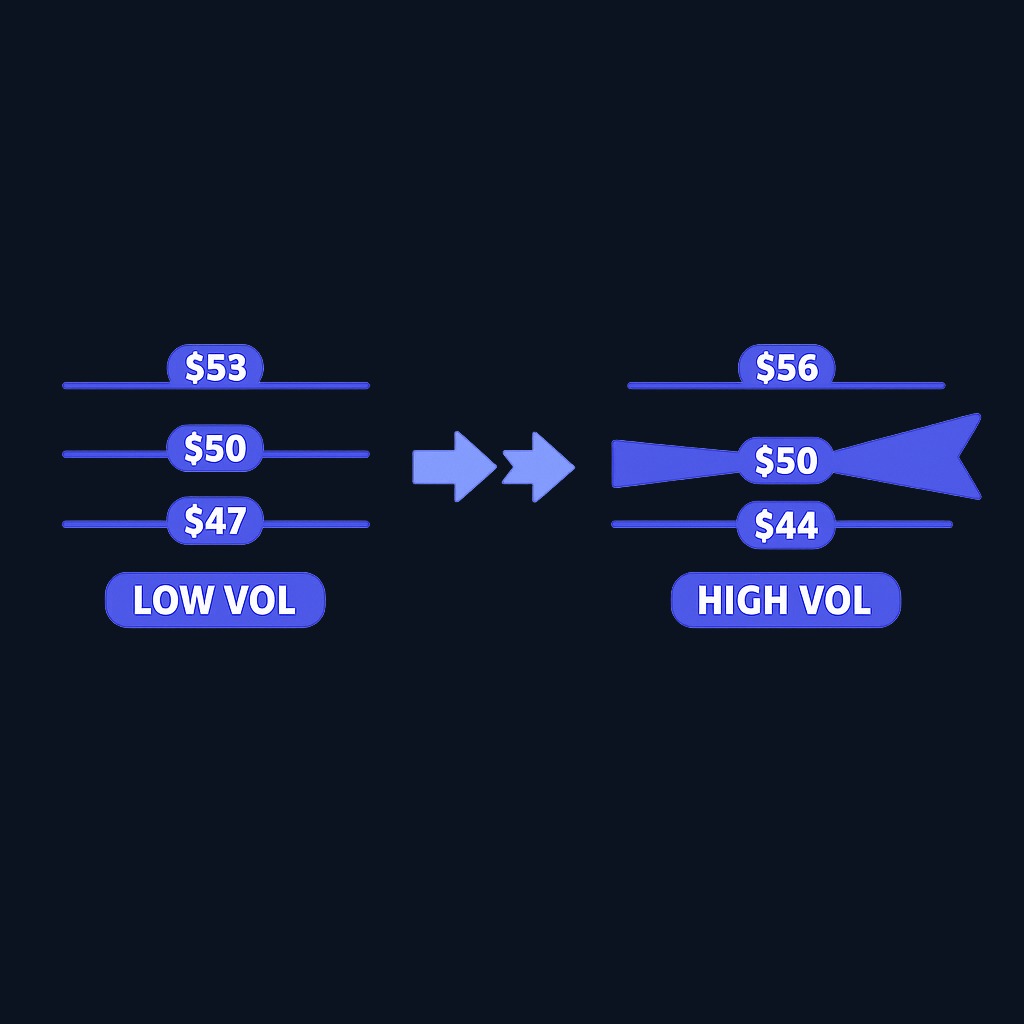
A compact example: if the 20-day average is $50 and the standard deviation is $1.50, the upper band sits at $53 and the lower band at $47. If volatility doubles, the same average produces bands at $56 and $44. Nothing about the average changed; only the dispersion did. That is the property that makes the bands adaptive where fixed-percentage envelopes are static.
Settings are adjustable, but changing the lookback or multiplier changes the question the indicator answers. The conventional reference configuration is a 20-period average with bands two standard deviations away. Any alternative should be selected before testing and evaluated out of sample rather than tuned until past charts look persuasive.
How to interpret the bands
Band width and the volatility cycle
The distance between the bands is a reading of recent price dispersion. Wide bands follow larger recent moves; narrow bands follow quieter stretches. A contraction describes what has already happened. It does not establish when volatility will expand, how large the next move will be, or which direction price will take.
The squeeze
A Bollinger Band “squeeze” is the informal name for unusually narrow bands relative to a chosen history. Some traders monitor what happens after a squeeze, but the pattern is not a directional forecast and does not guarantee an imminent expansion. A valid test must define “narrow,” the entry, the comparison benchmark, transaction costs, and how false breaks are handled before results are known.
Walking the band
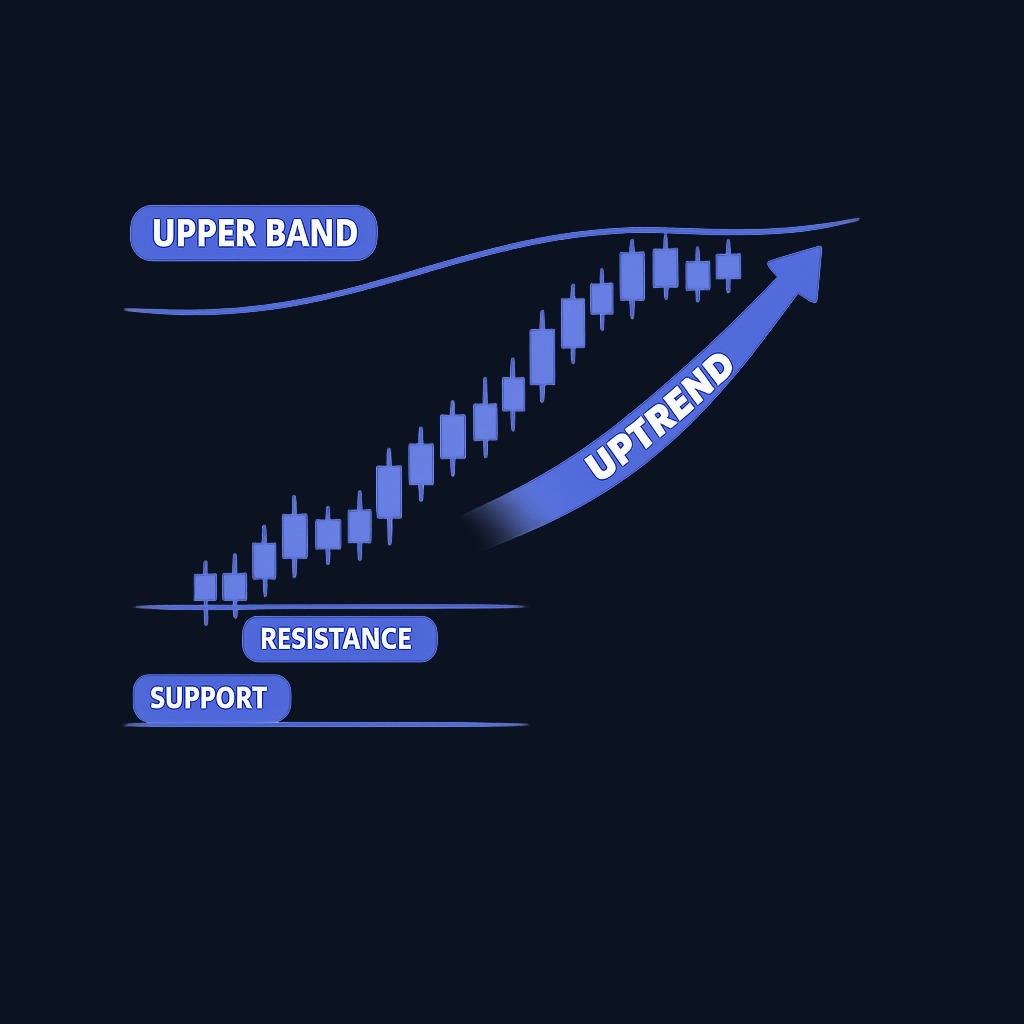
In strong trends, price can ride the upper band for many bars in a row. Each touch looks overbought, yet the market keeps climbing. This "walking the band" behavior is the single most important correction to the beginner's instinct that an upper-band touch means sell. In a confirmed uptrend, repeated upper-band contact is strength, not weakness.
Mean reversion signals
In a range, traders sometimes treat the outer bands as candidate extremes and the middle band as a reference point. That is a hypothesis about the market regime, not a property of the formula. A price can remain near or outside a band, and a move toward the middle band is never assured.
Trading strategies using Bollinger Bands
- Range hypothesis. Test whether reactions near an outer band add information after the range and exit rules are defined objectively.
- Compression hypothesis. Test whether a chosen band-width percentile followed by a defined close has useful results after false breaks and costs.
- Trend-context hypothesis. Evaluate whether the middle band adds information to a separately defined trend rather than assuming every pullback is an entry.
- Second-low hypothesis. Compare a second low inside the band with a first low outside it, but require independent confirmation and measure failures as carefully as successes.
Every strategy above needs an exit plan and position sizing before entry. The bands identify conditions; they do not manage risk for you. How your orders actually fill also affects results, especially on breakout entries in fast markets; the SEC's investor publication on trade execution explains why the price you click is not always the price you get.
A worked session example
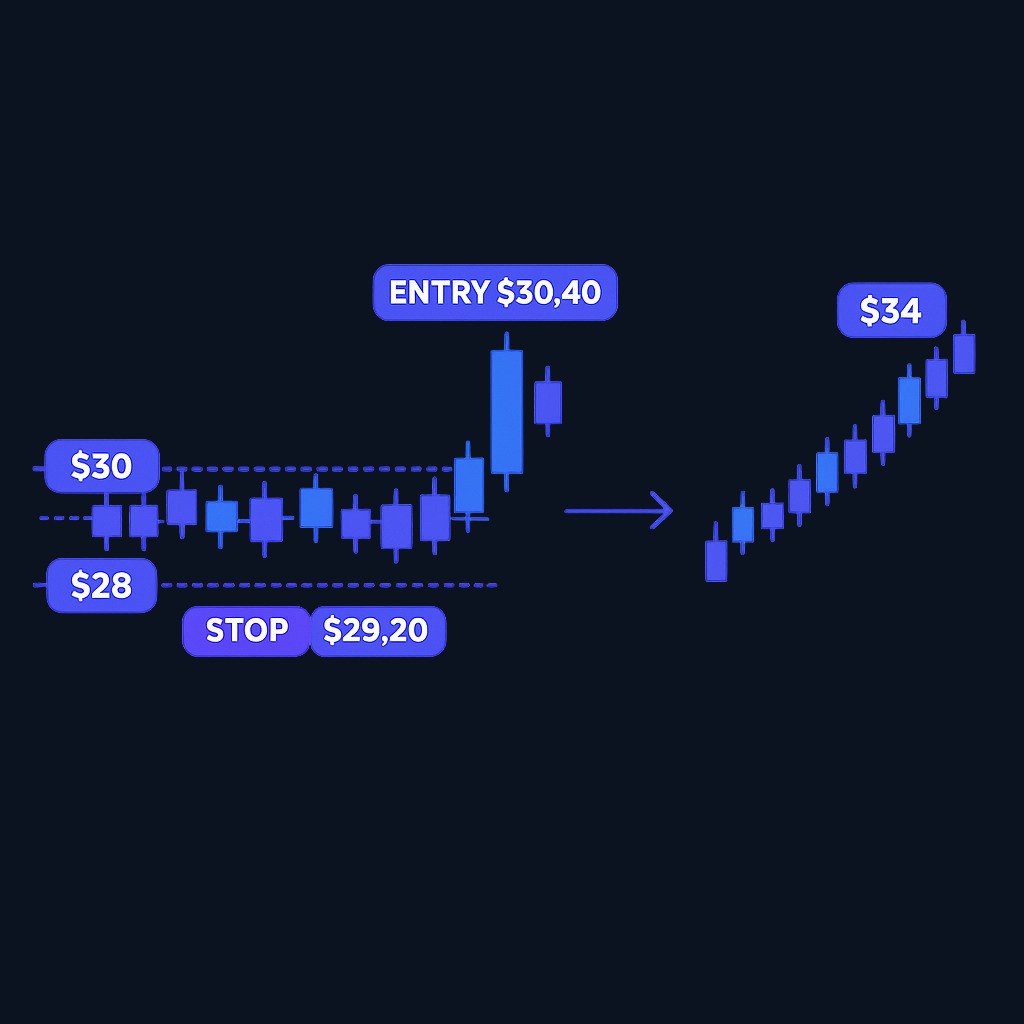
Hypothetical example: a stock trades between $28 and $30 for six weeks while its band width falls to the lowest reading of the year. It then closes at $30.40 above the upper band on unusually high volume. A predefined test might enter at that close, use $29.20 as an invalidation level, and trail a rule based on the middle band. If the stock later reaches $34 and the rule exits near $33, that is one successful observation—not proof of an edge. The same test must include failed breakouts, slippage, spreads, and every signal in the sample.
Practice trading with Finelo
Practice in a simulator, learn with bite-sized lessons, and build confidence before risking real money.
Common mistakes when using Bollinger Bands
- Treating every upper-band touch as a sell signal and every lower-band touch as a buy signal, ignoring the trend context entirely.
- Trading a squeeze before it resolves, then getting chopped by the head-fake move that often precedes the real breakout.
- Using the bands alone. John Bollinger himself recommends pairing them with independent confirmation such as volume or a momentum oscillator like RSI.
- Cranking the settings until past signals look perfect. An over-fitted 13-period, 1.7-deviation configuration describes history, not the future.
- Ignoring the timeframe mismatch: bands on a 5-minute chart answer a different question than bands on a weekly chart, and mixing their signals creates contradictions.
What to know before deciding
Bollinger Bands are free on every major platform, easy to read at a glance, and grounded in a simple statistical idea, which makes them one of the most approachable volatility tools available. Their weaknesses are equally clear. They lag because they are built on a moving average, they generate abundant false signals in trendless chop, and they say nothing about direction on their own. They tend to reward traders who use them as context and punish traders who use them as a signal machine. If you already track support and resistance, volume, and candlestick behavior, the bands will sharpen that picture. If you have no framework yet, learn those basics first so the bands have something to confirm.
Decision framework: are Bollinger Bands right for your trading?
| Your situation | Recommended next step |
|---|---|
| Range trader in sideways markets | Use band fades with the middle band as target and hard stops beyond the bands |
| Breakout trader | Hunt multi-week squeezes and demand a volume-confirmed close outside the band |
| Trend follower | Buy middle-band pullbacks and treat walking-the-band as confirmation, not exhaustion |
| Total beginner | Paper trade band setups for a month and log every false signal before going live |
FAQ
What do Bollinger Bands actually measure?
They measure how far price has scattered around its 20-period average. The band width is a live reading of volatility: wide means turbulent, narrow means quiet.
What does a Bollinger Band squeeze mean?
A squeeze means the bands are narrow relative to the comparison window. It does not establish that a larger move is imminent or that the first move outside a band will persist.
Can Bollinger Bands predict market trends?
No. The bands describe recent price behavior statistically. Traders combine them with volume, momentum, and trend analysis to build a forecast; the bands alone are context, not prophecy.
What settings should beginners use for Bollinger Bands?
Start with the defaults: a 20-period moving average and two standard deviations. Change them only after you understand what the defaults show, and avoid tuning settings to make past trades look good.
Conclusion and next steps
Bollinger Bands are a moving average with an adaptive envelope based on recent price dispersion. Narrow bands describe recent compression, wide bands describe recent expansion, and neither condition predicts the next move on its own. Use the bands to locate price relative to its recent history, then test any decision rule with a complete sample that includes failures and trading costs. Observation is useful; treating a rolling statistical display as a probability forecast is not.
Chart AnalysisTechnical AnalysisBeginner
Practice trading with Finelo
Practice in a simulator, learn with bite-sized lessons, and build confidence before risking real money.
About the author
Finelo Team
The Finelo Team creates practical investing and trading education designed to help beginners learn faster with structured challenges, simulator practice, and bite-sized lessons.
Keep reading — Related articles

Chart Analysis
Symmetrical Triangle Pattern: Identification, Breakouts, and Limits
A symmetrical triangle forms when lower highs and higher lows narrow the trading range. Learn to identify it, assess breakout confirmation, and recognize false signals.
Finelo Team

Chart Analysis
Hanging Man Candlestick: The Hammer’s Bearish Twin Explained
A hanging man is a bearish warning candle after an uptrend. Learn how its context differs from a hammer, why confirmation matters, and when the warning fails.
Finelo Team

Chart Analysis
Evening Star Pattern: How to Identify a Three-Candle Reversal
The evening star is a three-candle bearish reversal pattern that forms after an uptrend. Learn its anatomy, confirmation signals, and limitations before interpreting it on a chart.
Finelo Team


