This implementation guide is distinct from a general market-breadth overview. An advance–decline line is cumulative, so its shape depends on the security universe, advance/decline classification, unchanged issues, corporate actions, missing data, start date, and reset policy. Two vendors can publish different lines without either making an arithmetic error.
Building an Advance–Decline Line: Data Choices, Resets, and Divergence Tests
This implementation guide is distinct from a general market-breadth overview. An advance–decline line is cumulative, so its shape depends on the security universe, advance/decline classification, unchanged issues,…
7 min read
Practice trading with Finelo
Practice in a simulator, learn with bite-sized lessons, and build confidence before risking real money.
Want to learn more?
Practice in a simulator, learn with bite-sized lessons, and build confidence before risking real money.
Explore FineloExplore Finelo's 28-day challenges
Turn learning into a daily habit with guided challenge paths.
Define the dataset before calculating the line
Choose one fixed exchange or index universe and record membership changes. For each session, classify issues from comparable official closes, calculate net advances = advancing issues − declining issues, then add the result to the prior line value. State how unchanged, suspended, newly listed, delisted, and missing securities are handled. A rebased value changes the chart's level but not subsequent daily net advances.
For a divergence test, define the price index, lookback, peak/trough rule, confirmation window, and trade rule before seeing outcomes. Include transaction costs, false signals, and periods when breadth and price disagree for months. Divergence is descriptive until a reproducible test shows otherwise; it is not an early-warning guarantee.
The advance–decline line adds daily net advances to a cumulative series. It can summarize participation under a chosen universe, but its direction and divergences depend on constituent, close, missing-data, and reset rules. The implementation choices below come before any interpretation.
How the advance decline line is calculated
The math is simple addition:
Today's A/D line = Yesterday's A/D line + (Advancing stocks - Declining stocks)
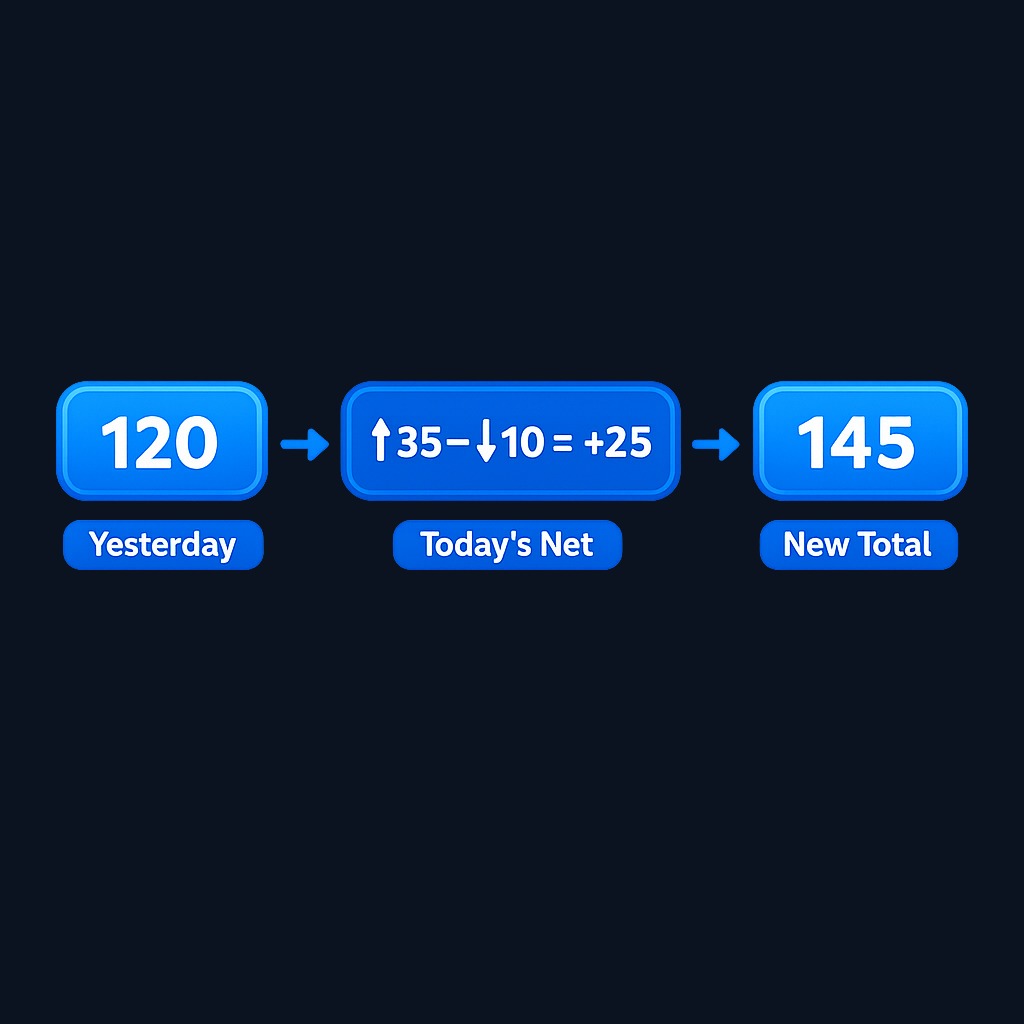
Advancing stocks closed higher than the prior day; declining stocks closed lower. Unchanged stocks are ignored. The absolute value of the line means nothing. Only its slope and its relationship to price matter.
A hypothetical worked example
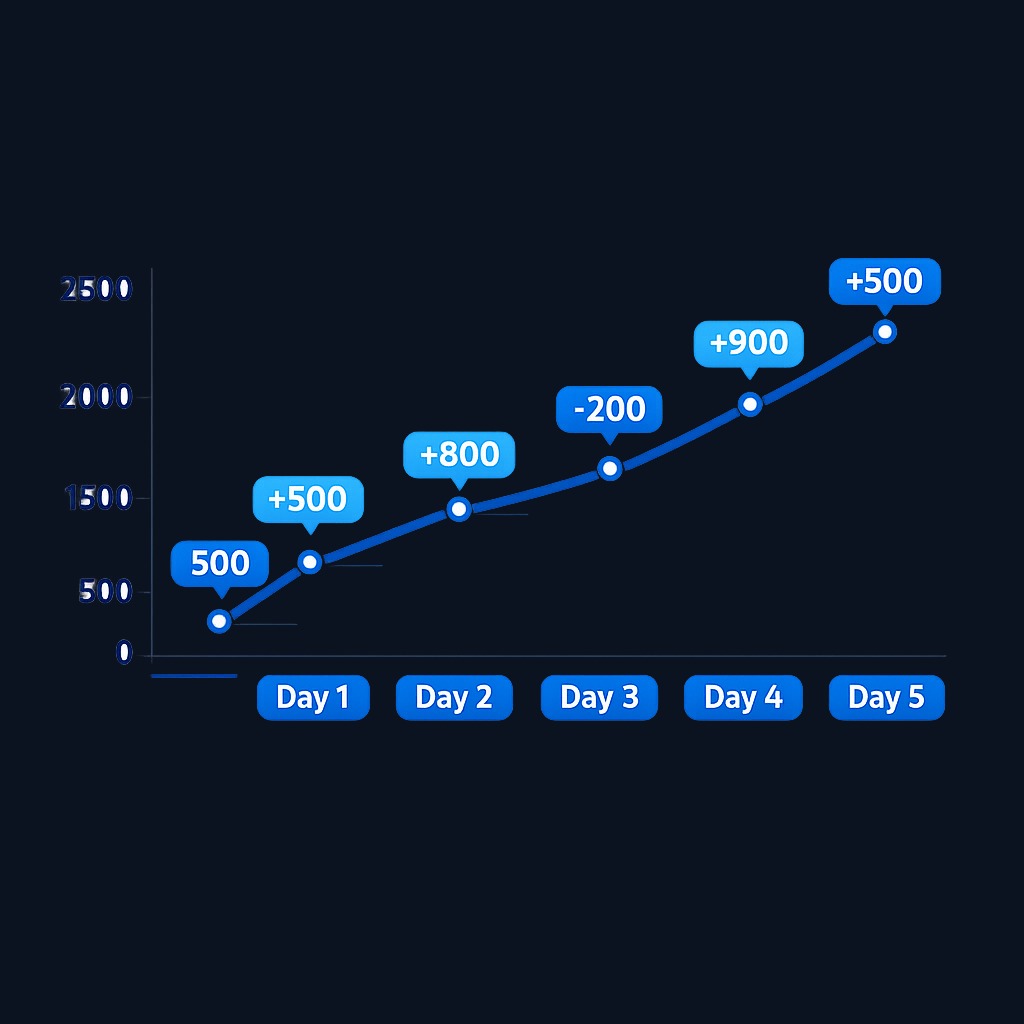
Track a five-day stretch on an exchange with 3,000 listed stocks, starting the line at zero:
| Day | Advancers | Decliners | Net breadth | A/D line |
|---|---|---|---|---|
| Mon | 1,900 | 1,000 | +900 | +900 |
| Tue | 1,700 | 1,200 | +500 | +1,400 |
| Wed | 1,100 | 1,800 | -700 | +700 |
| Thu | 1,750 | 1,150 | +600 | +1,300 |
| Fri | 2,050 | 850 | +1,200 | +2,500 |
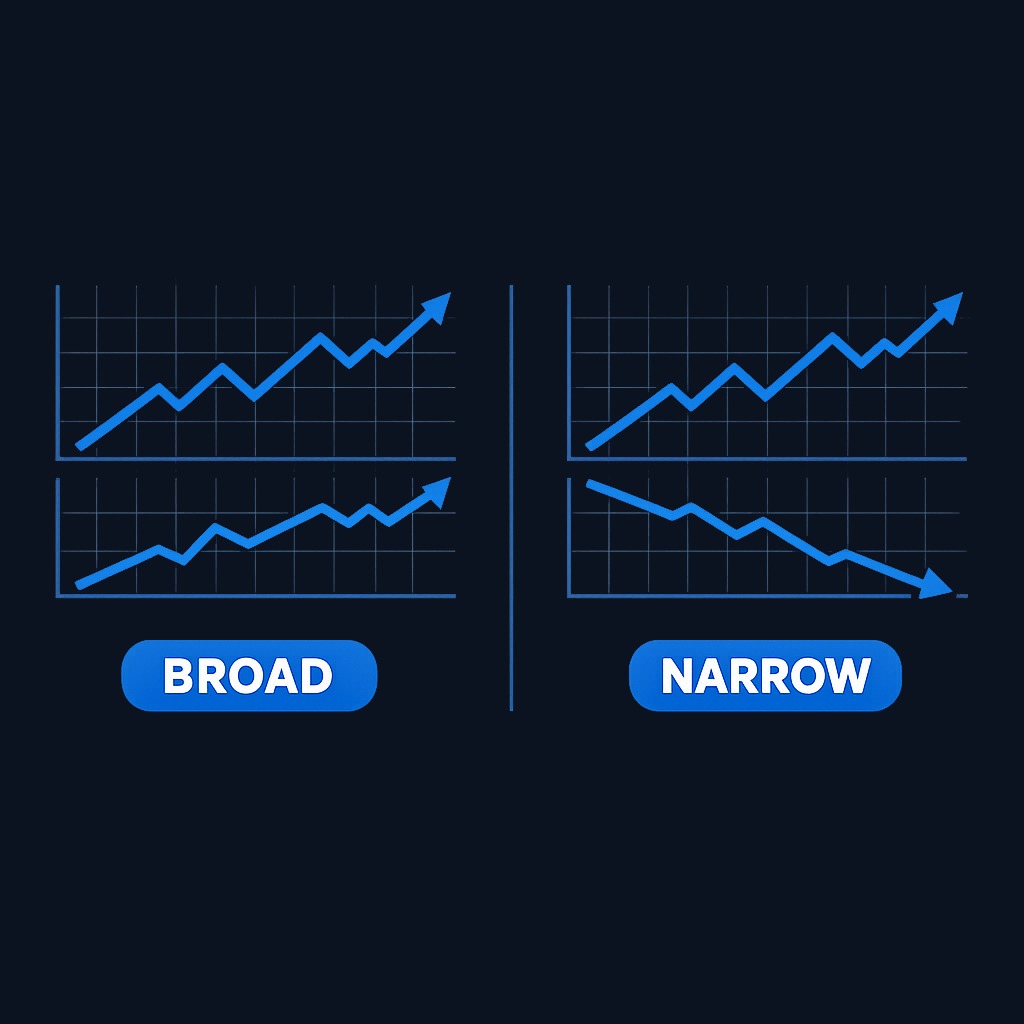
Now add context. Suppose the index rose 2.1% over these five days while the A/D line climbed from zero to +2,500. Breadth confirmed the move: most stocks pulled their weight. If instead the index had gained 2.1% while the line finished at -400, the advance rested on a narrow group of large names. Narrow rallies are more fragile, because there are fewer leaders left to fail.
How to interpret the A/D line
- Confirmation. Index up, A/D line up: the trend is broad-based and healthier. Index down, A/D line down: the decline is general, not a sector accident.
- Bearish divergence. The index prints a new high but the A/D line does not. Fewer stocks are carrying the advance. This pattern preceded several major tops, which is why breadth watchers treat it as an early warning rather than a sell trigger.
- Bullish divergence. The index makes a lower low while the A/D line holds a higher low. Selling pressure is narrowing, and the average stock has already stopped going down.
- Slope changes. A flattening line during a steady uptrend often precedes choppier conditions, even without a full divergence.
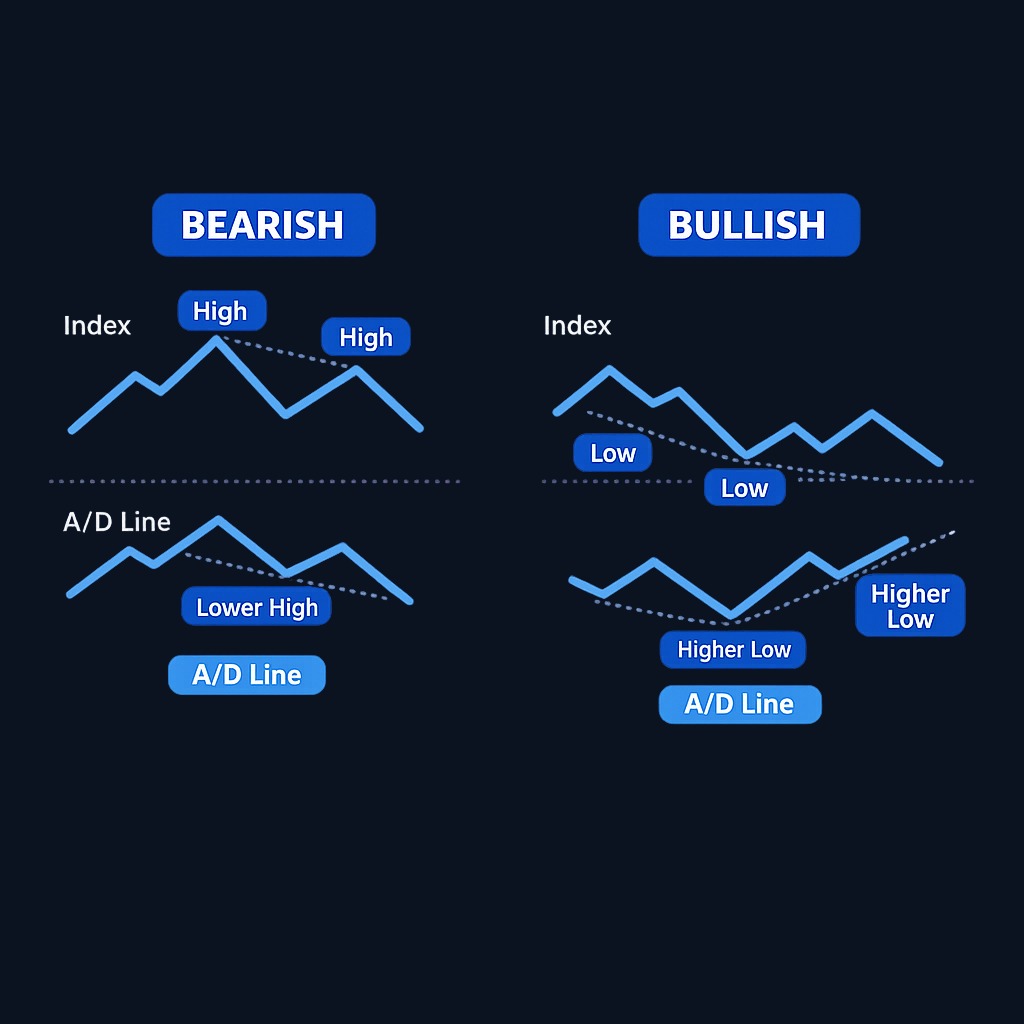
Divergences resolve on their own schedule. A breadth warning can run for months while the index grinds higher. The practical use is adjusting risk gradually, not calling exact turning points.
Practical applications for traders and investors
- Trend health check. Before adding to index exposure, glance at whether breadth is confirming new highs.
- Filter for breakout trades. Breakouts in individual stocks succeed more often when the broad market's A/D line is rising, since participation lifts most boats.
- Comparing exchanges. The NYSE A/D line covers a broad, larger-cap-tilted universe. The Nasdaq version leans toward smaller and speculative names. When the two disagree, risk appetite is often shifting.
- Cross-checking headline moves. A 1% index gain on negative breadth is a different event than a 1% gain with three advancers for every decliner. The line separates the two instantly.
- Pairing with volume-based tools. Some analysts prefer breadth measured in up-volume versus down-volume for confirmation. Reviewing both closes the gaps each one leaves.
Company-level research still matters after any breadth signal. Filings on the SEC's EDGAR database remain the primary source for judging the individual stocks you actually hold, whatever the market's breadth says.
Practice trading with Finelo
Practice in a simulator, learn with bite-sized lessons, and build confidence before risking real money.
What to know before deciding to rely on it
The A/D line has structural quirks:
- Every stock counts equally. A microcap advancing offsets a mega-cap declining. That equal weighting is the source of its insight and of its noise.
- Interest-rate-sensitive listings distort the NYSE version. Closed-end bond funds, preferred shares, and similar securities trade on the exchange. They advance and decline with rates, not the equity cycle, so the line can drift on rate moves alone.
- Divergences can persist or fail. Do not claim a performance effect without a reproducible test; define the signal, confirmation, holding rule, comparison index, and costs first.
- It says nothing about magnitude. A stock counts as an advancer whether it gained 0.1% or 10%. Percent-based or volume-weighted breadth measures fill that gap.
- Delistings and new listings quietly reshape the universe. Long-term comparisons across decades are looser than they appear.
Decision framework: fitting breadth into your process
| Your intent | How to use the A/D line |
|---|---|
| Confirming a new index high | Require the A/D line to be at or near its own high |
| Managing risk in an aging rally | Treat repeated bearish divergence as a cue to tighten stops or trim leverage |
| Hunting a market bottom | Look for bullish divergence plus improving up-volume before adding exposure |
| Day-to-day noise filtering | Ignore single-day breadth; judge the line over weeks |
| Building a full breadth dashboard | Combine the A/D line with new highs/lows and up/down volume |
FAQ
What does the advance decline line tell you?
It tells you how many stocks are participating in a market move. A rising line means advancers keep outnumbering decliners, so the trend is broad. A falling line during an index rally warns that leadership is narrowing.
What is the difference between the A/D line and the A/D ratio?
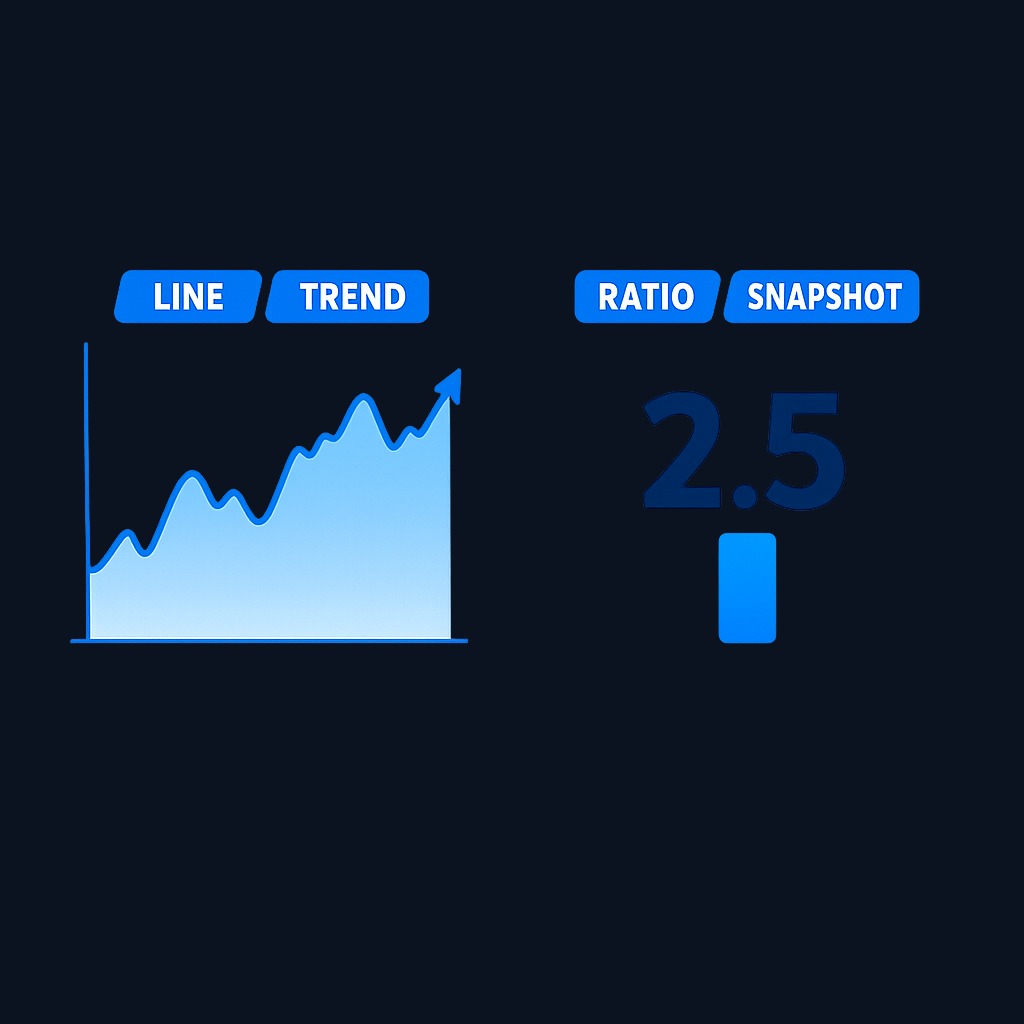
The line is a cumulative running total of net advancers. The ratio divides advancers by decliners for a single day. The ratio is a snapshot; the line is the trend of those snapshots.
Is the advance decline line a leading indicator?
It often turns before prices at major tops, which makes it leading in that narrow sense. But the lead time is irregular, from weeks to many months, so it works better as a risk gauge than a timing tool.
Which advance decline line should I watch?
Most analysts default to the NYSE A/D line for the broad market and add the Nasdaq line for risk appetite. Watching the S&P 500-only version removes the bond-fund distortion at the cost of a smaller sample.
Conclusion and next steps
The advance decline line compresses the whole market's daily wins and losses into one cumulative track. When it rises with the index, participation is broad and the trend earns more trust. When it stalls while the index climbs, leadership is thinning and risk deserves a second look. Start simple: chart the NYSE A/D line under your main index chart and note agreement or divergence once a week. To turn indicator-reading into a structured skill with interactive lessons, try the Finelo app. Plan details are on the pricing page, and questions go to support.
Chart AnalysisTechnical AnalysisBeginner
Practice trading with Finelo
Practice in a simulator, learn with bite-sized lessons, and build confidence before risking real money.
About the author
Finelo Team
The Finelo Team creates practical investing and trading education designed to help beginners learn faster with structured challenges, simulator practice, and bite-sized lessons.
Keep reading — Related articles

Chart Analysis
Symmetrical Triangle Pattern: Identification, Breakouts, and Limits
A symmetrical triangle forms when lower highs and higher lows narrow the trading range. Learn to identify it, assess breakout confirmation, and recognize false signals.
Finelo Team

Chart Analysis
Hanging Man Candlestick: The Hammer’s Bearish Twin Explained
A hanging man is a bearish warning candle after an uptrend. Learn how its context differs from a hammer, why confirmation matters, and when the warning fails.
Finelo Team

Chart Analysis
Evening Star Pattern: How to Identify a Three-Candle Reversal
The evening star is a three-candle bearish reversal pattern that forms after an uptrend. Learn its anatomy, confirmation signals, and limitations before interpreting it on a chart.
Finelo Team


