This article assumes the reader knows the conventional cup-and-handle shape. Its purpose is to diagnose failed or ambiguous formations, an intent distinct from Finelo's basic pattern guide. The shape is subjective and has no guaranteed breakout rate, so every rule should be tested on a defined universe with delisted securities, corporate actions, costs, and failed signals included.
Cup and Handle Failure Signals: False Breakouts and Risk Controls

This article assumes the reader knows the conventional cup-and-handle shape. Its purpose is to diagnose failed or ambiguous formations, an intent distinct from Finelo's basic pattern guide. The shape is subjective and…
9 min read
Practice trading with Finelo
Practice in a simulator, learn with bite-sized lessons, and build confidence before risking real money.
Want to learn more?
Practice in a simulator, learn with bite-sized lessons, and build confidence before risking real money.
Explore FineloExplore Finelo's 28-day challenges
Turn learning into a daily habit with guided challenge paths.
A failure taxonomy
- No prior trend: a rounded range after a long decline may be basing, but it does not meet a continuation thesis.
- Handle too deep for the rule: define the maximum depth before looking at the outcome; changing the rule afterward creates hindsight bias.
- Breakout without follow-through: specify the closing, volume, and time conditions that count as confirmation and the level that invalidates them.
- Gap through the exit: a stop is an instruction, not a guaranteed fill. Position size must tolerate an adverse gap.
- Broad-market contradiction: record market and sector conditions, but do not add discretionary exceptions after a loss.
- Survivorship bias: include failed, acquired, and delisted names when evaluating historical results.
A useful journal records every candidate before the breakout, including ones never traded. Track the denominator: candidates observed, signals triggered, fills obtained, rule violations, net returns after costs, and maximum adverse excursion.
The conventional cup-and-handle description is a rounded base followed by a shorter consolidation and a possible breakout. This article treats the description as a hypothesis and concentrates on invalidation, false breakouts, gaps, and unbiased testing rather than presenting the shape as a bullish fact.
What the cup and handle pattern is
The formation has two parts and a trigger:
- The cup. After an advance, price corrects and traces a rounded bottom. The dip typically gives back 12% to 33% of the prior move before price recovers to the old high. The shape should look like a teacup viewed side-on: gradual down, rounded base, gradual up. A sharp V-shaped recovery carries less predictive weight because it reflects panic and snapback rather than patient accumulation.
- The handle. Near the prior high, early buyers who bought the left rim take profits. Price drifts down modestly, usually less than 12% and staying in the upper half of the cup's range. The handle often slopes gently downward and can last from several days to a few weeks.
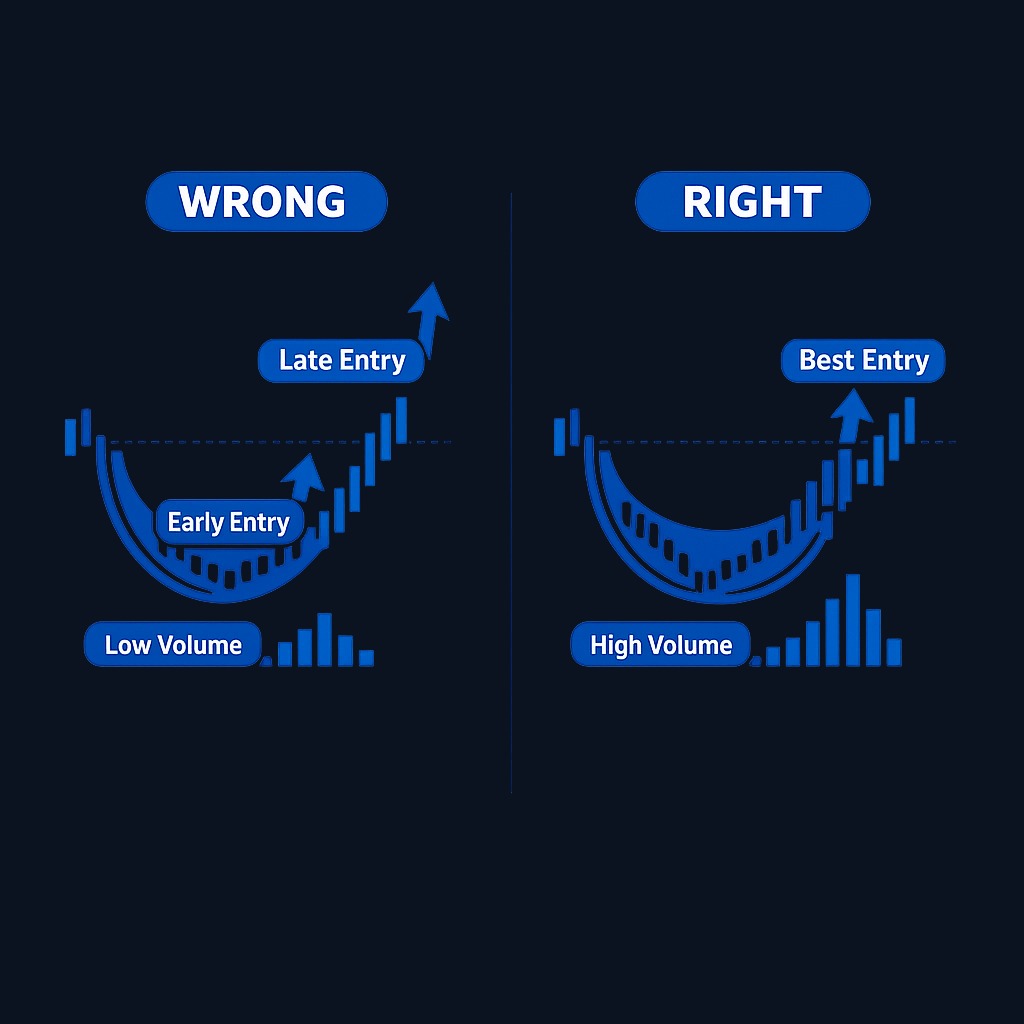
- The breakout. The buy signal fires when price clears the handle's high, with volume noticeably above its recent average confirming institutional demand.
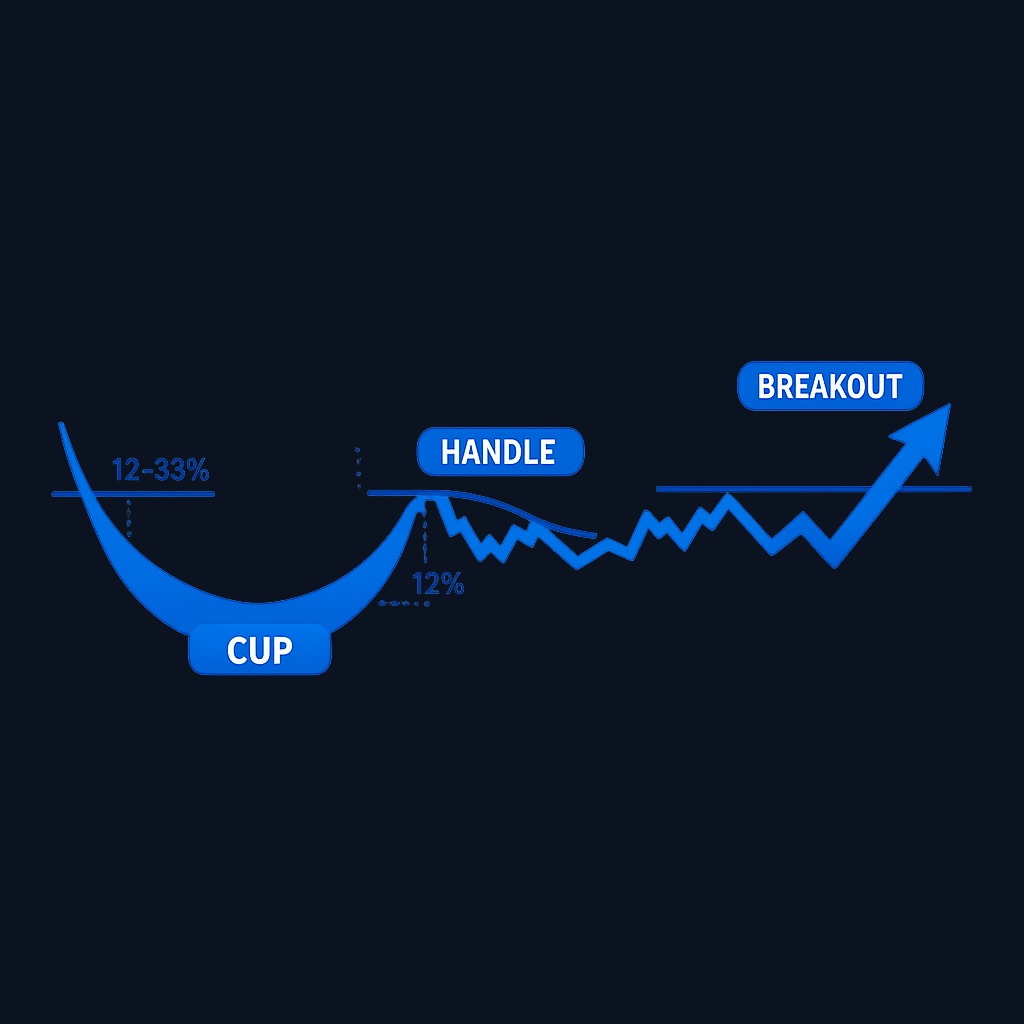
The psychological story explains why the shape matters. The cup shows supply being absorbed slowly - weak holders exiting, patient buyers accumulating. The handle is the final shakeout of short-term traders. When that last pocket of supply clears, demand meets little resistance, which is what produces the breakout thrust.
How to identify a valid formation
Checklist traders commonly apply before trusting the setup:
| Criterion | What to look for |
|---|---|
| Prior uptrend | An advance of at least ~30% preceding the cup; continuation patterns need something to continue |
| Cup depth | 12-33% pullback in typical markets; deeper cups weaken the signal |
| Cup shape | Rounded base over weeks to months (commonly 7-65 weeks), not a sharp V |
| Handle position | Forms in the upper half of the cup; drift stays above the 10-week trend area |
| Handle depth | Usually under 12%; a handle that collapses toward the cup low invalidates the setup |
| Volume signature | Quiet volume in the base and handle, expanding sharply on breakout day |
Reading the volume signature
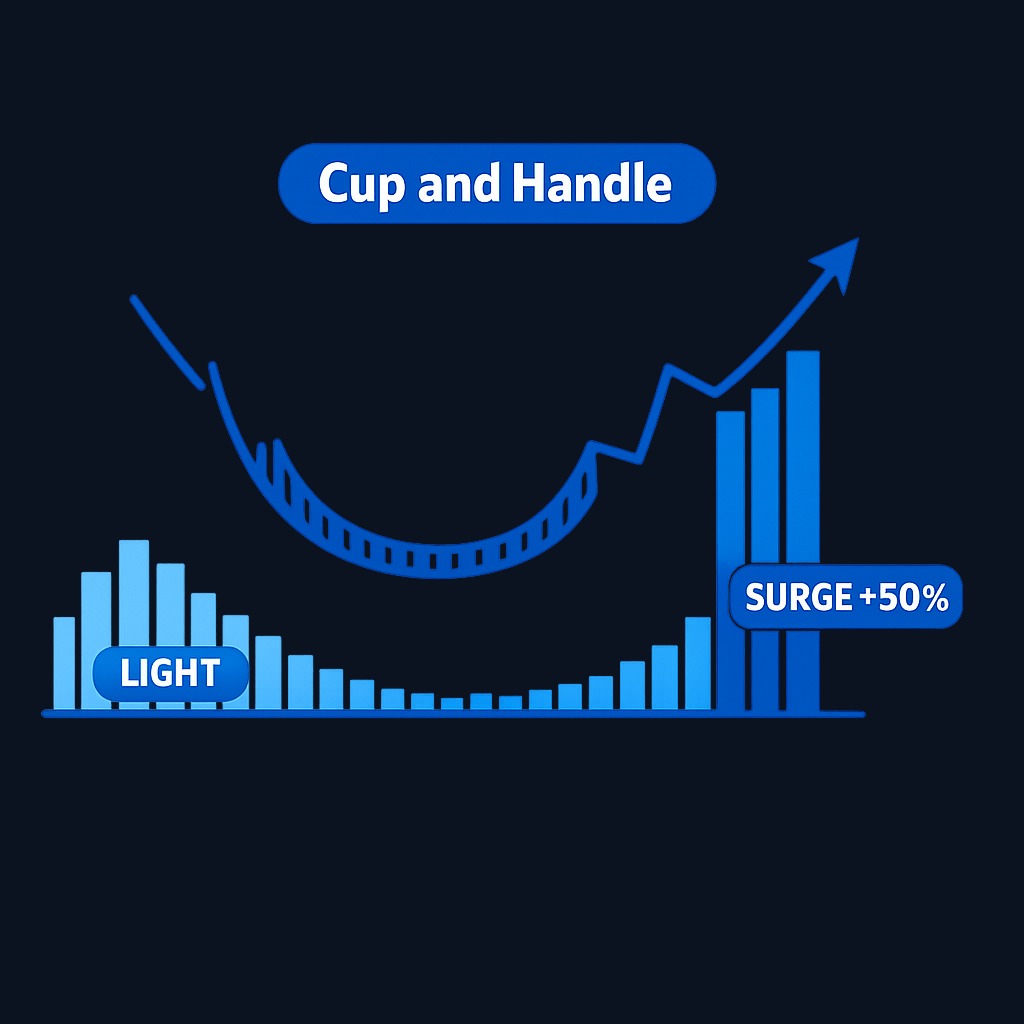
Volume is the difference between a genuine cup and handle and a random squiggle. The ideal sequence starts with declining volume as the cup bottoms, a sign sellers are exhausting. Volume stays modest on the right-side recovery. It turns very light in the handle, when nobody is left to sell. Then it surges at least 40-50% above the daily average on the breakout. A breakout on limp volume is a warning; these fail at a much higher rate and invite a quick reversal back below the rim.
A worked trade example with real numbers
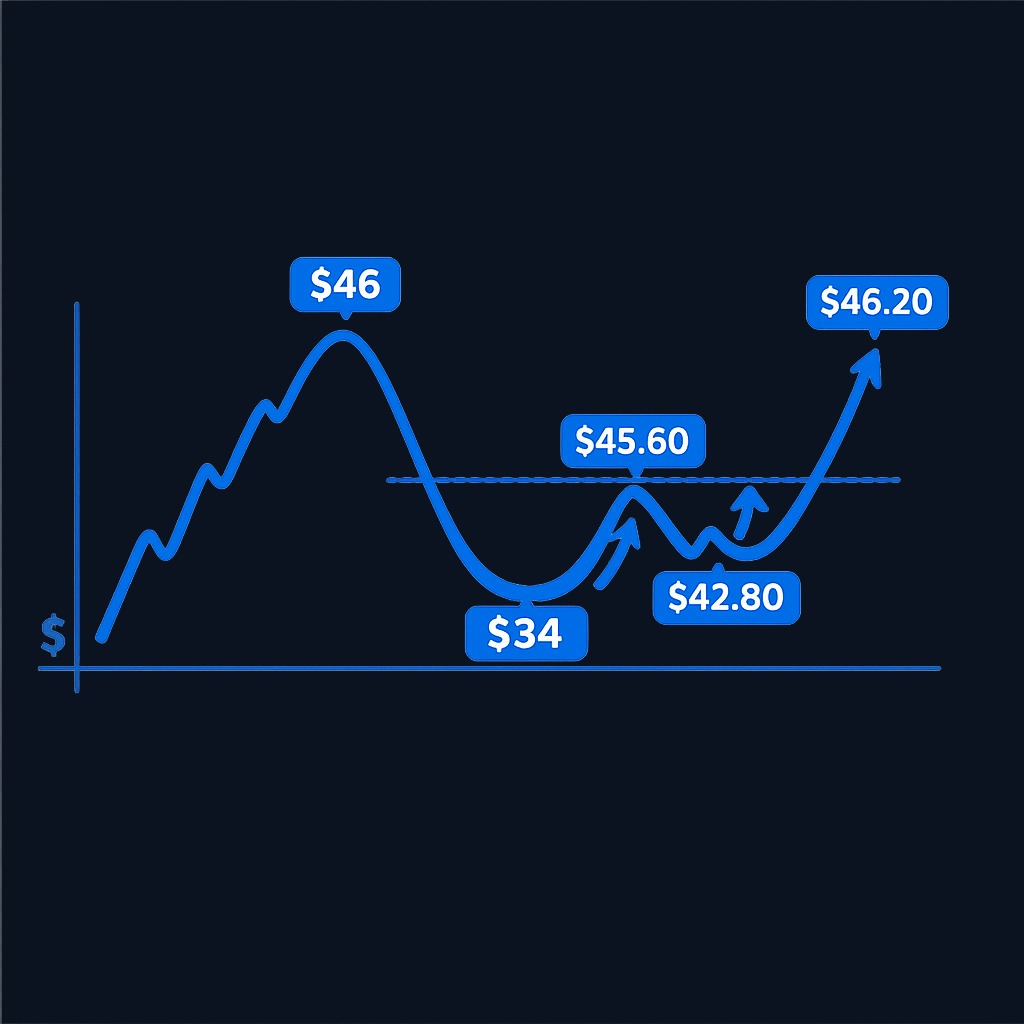
Suppose Meridian Robotics stock rallies from $28 to $46, then builds a base:
- The cup: price eases from $46 to $34 over eleven weeks, a 26% correction. It rounds out between $34 and $36 for a month. It then climbs back to $45.60 over the next nine weeks.
- The handle: over two weeks, price drifts from $45.60 to $42.80, a 6.1% dip that holds the upper half of the cup.
- The trigger: the handle's high sits at $45.60, so the buy point is $45.70 (a dime above resistance). On breakout day the stock prints $46.20 on volume 80% above its 50-day average.
A disciplined plan around that setup:
| Element | Level | Logic |
|---|---|---|
| Entry | $45.70 | First trade above handle resistance |
| Stop-loss | $42.30 | Just under the handle low; invalidation point |
| Risk per share | $3.40 | Entry minus stop |
| Measured target | $57.30 | Cup depth ($11.60) projected above the rim, roughly a 3.4R reward |
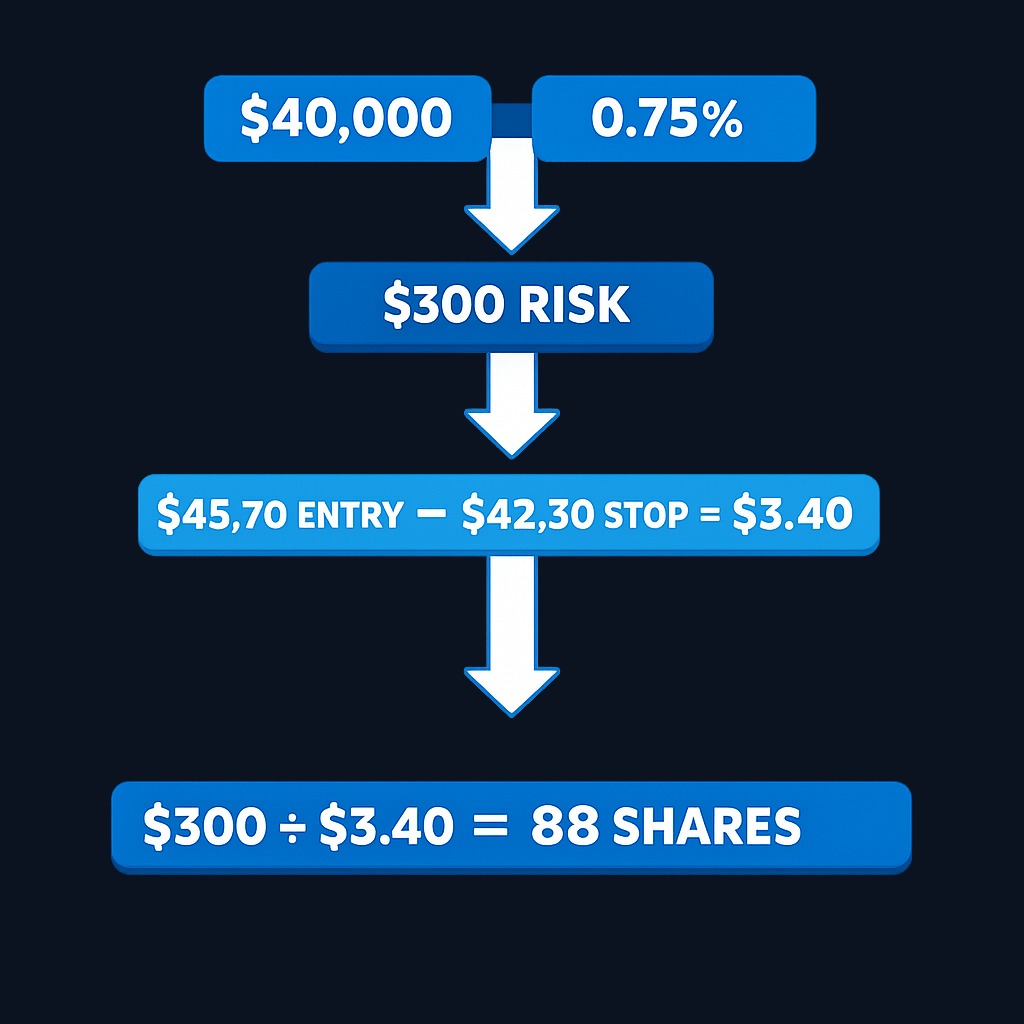
If the trader risks 0.75% of a $40,000 account, position size is $300 of risk divided by $3.40, or 88 shares. Writing these numbers down before entry is what separates a repeatable process from impulse trading.
Practice trading with Finelo
Practice in a simulator, learn with bite-sized lessons, and build confidence before risking real money.
Trading strategies and entry variations
- Standard breakout entry. Buy the move through the handle high, as in the example. Most conservative and most common.
- Handle-low anticipation entry. Aggressive traders buy inside the handle near support with a tighter stop. They accept the risk that the breakout never comes in exchange for a better price.
- Retest entry. Many breakouts pull back to the rim within days. Buying that successful retest offers confirmation and a clean stop just below the old resistance. The cost is missing runners that never look back.
- Scaling approach. Enter partial size at the breakout and add on the retest or on the first quiet pullback, smoothing the timing risk across the sequence.
Whichever entry you choose, the exit logic stays the same. The pattern is invalidated when price closes decisively below the handle low. The measured move, cup depth added to the breakout level, provides a rational first target for taking profits.
What to know before deciding to trade it
Common mistakes account for most losses with this pattern:
- Buying inside the base. A cup is only a cup after the breakout confirms it; jumping in early turns a defined-risk setup into a guess.
- Ignoring the volume check. Low-volume breakouts fail disproportionately often. If the surge is missing, treat the move with suspicion.
- Accepting malformed patterns. V-shaped recoveries, handles that form in the lower half of the cup, or handles deeper than the textbook range all degrade the odds.
- Chasing extended breakouts. Paying 8-10% above the buy point wrecks the risk-reward math; the stop distance balloons while the target stays fixed.
- Trading against the market. Continuation patterns work best when the broader indexes are also trending up; even clean setups struggle in downtrending markets.
- Forgetting failure statistics. No chart pattern approaches certainty. Failed breakouts, where price falls back through the rim and undercuts the handle, are common. That is why the stop-loss is not optional. Day-trading-style aggressive use of patterns like this carries real risk, as the SEC's guidance on day trading risks spells out.
Decision framework: is this setup worth taking?
| Your situation | Recommended approach |
|---|---|
| Clean cup, tight handle, strong market | Full planned position at the breakout with a handle-low stop |
| Valid shape but weak breakout volume | Half size or skip; demand confirmation on a retest |
| V-shaped cup or deep handle | Pass; wait for a better-formed base |
| Already broke out 8%+ ago | Skip the chase; add it to a watchlist for the next base |
| Learning stage, no live track record | Paper trade the rules for 20+ setups before committing capital |
FAQ
How reliable is the cup and handle pattern?
It is considered one of the stronger bullish continuation setups when all criteria align: proper depth, rounded base, tight handle, and a high-volume breakout. Even so, a meaningful share of breakouts still fail. Reliability comes from the stop-loss discipline, not the shape itself.
How long does a cup and handle take to form?
Bases typically run from about seven weeks to more than a year, with the handle adding several days to a few weeks. Patterns that form in a few sessions on intraday charts exist, but shorter timeframes produce noisier, less dependable signals.
What is the target after a breakout?
The conventional measured move adds the cup's depth to the breakout price. In the worked example above, an $11.60-deep cup breaking out at $45.70 projects roughly $57.30 as the initial objective.
Can the cup and handle appear as a bearish pattern?
An inverted version - a rounded top with an upward-drifting handle that breaks down - is tracked by some traders as a bearish counterpart. It is less studied and generally considered less reliable than the classic bullish formation.
Conclusion and next steps
The cup and handle pattern rewards patience twice. First, the rounded base proves that supply is exhausted. Then the handle shakes out the last weak holders before the breakout. Learn the checklist: prior uptrend, 12-33% cup depth, upper-half handle, quiet-then-surging volume. Let the handle high define your entry and the handle low define your risk. Pull up a year of charts for ten stocks you know. Mark every base that fits the rules, including the ones that failed. That single exercise teaches more than any description. To practice pattern recognition with structured, gamified lessons, try the Finelo app. Plans are compared on the pricing page, and the team is reachable via support.
Chart AnalysisTechnical AnalysisBeginner
Practice trading with Finelo
Practice in a simulator, learn with bite-sized lessons, and build confidence before risking real money.
About the author
Finelo Team
The Finelo Team creates practical investing and trading education designed to help beginners learn faster with structured challenges, simulator practice, and bite-sized lessons.
Keep reading — Related articles

Chart Analysis
Symmetrical Triangle Pattern: Identification, Breakouts, and Limits
A symmetrical triangle forms when lower highs and higher lows narrow the trading range. Learn to identify it, assess breakout confirmation, and recognize false signals.
Finelo Team

Chart Analysis
Hanging Man Candlestick: The Hammer’s Bearish Twin Explained
A hanging man is a bearish warning candle after an uptrend. Learn how its context differs from a hammer, why confirmation matters, and when the warning fails.
Finelo Team

Chart Analysis
Evening Star Pattern: How to Identify a Three-Candle Reversal
The evening star is a three-candle bearish reversal pattern that forms after an uptrend. Learn its anatomy, confirmation signals, and limitations before interpreting it on a chart.
Finelo Team


