Evidence note: Fibonacci retracement is a discretionary chart-annotation convention. The ratios determine where lines are drawn; they do not establish that support, resistance, or reversals are more likely. Swing-point selection is subjective, and any entry, stop, or “confluence” rule needs a preregistered test on the intended instrument, timeframe, and cost assumptions.
Fibonacci Retracement in Trading: Levels, Uses, and Limits
Fibonacci retracement is a charting tool that marks likely support and resistance levels by dividing a price move at fixed percentages: 23.6%, 38.2%, 50%, 61.8%, and 78.6%. Traders draw it between a swing high and a…
8 min read
Practice trading with Finelo
Practice in a simulator, learn with bite-sized lessons, and build confidence before risking real money.
Want to learn more?
Practice in a simulator, learn with bite-sized lessons, and build confidence before risking real money.
Explore FineloExplore Finelo's 28-day challenges
Turn learning into a daily habit with guided challenge paths.
Fibonacci retracement is a charting tool that marks likely support and resistance levels by dividing a price move at fixed percentages: 23.6%, 38.2%, 50%, 61.8%, and 78.6%. Traders draw it between a swing high and a swing low to estimate where a pullback may pause before the trend resumes. This page is for beginner and intermediate traders who keep seeing "fibonacci retracement" on charts and want a plain-English explanation of how the levels are calculated, what they signal, and where the tool breaks down. Read the walkthrough below, then practice drawing the levels on historical charts before risking real money.
What Fibonacci retracement is and the sequence behind it
The tool takes its name from the Fibonacci sequence, a number series where each value is the sum of the two before it: 1, 1, 2, 3, 5, 8, 13, 21, and so on. As the sequence grows, the ratio between neighboring numbers settles near 1.618, often called the golden ratio. Dividing a number by the next one in the series approaches 0.618, and dividing by the number two places ahead approaches 0.382.
Those two ratios, expressed as percentages, become the 61.8% and 38.2% retracement levels. The 23.6% level comes from dividing a number by the value three places ahead. The 50% level is not a Fibonacci ratio at all; it is included because markets often retrace about half of a strong move before continuing. The 78.6% level is the square root of 0.618 and marks a deep pullback.
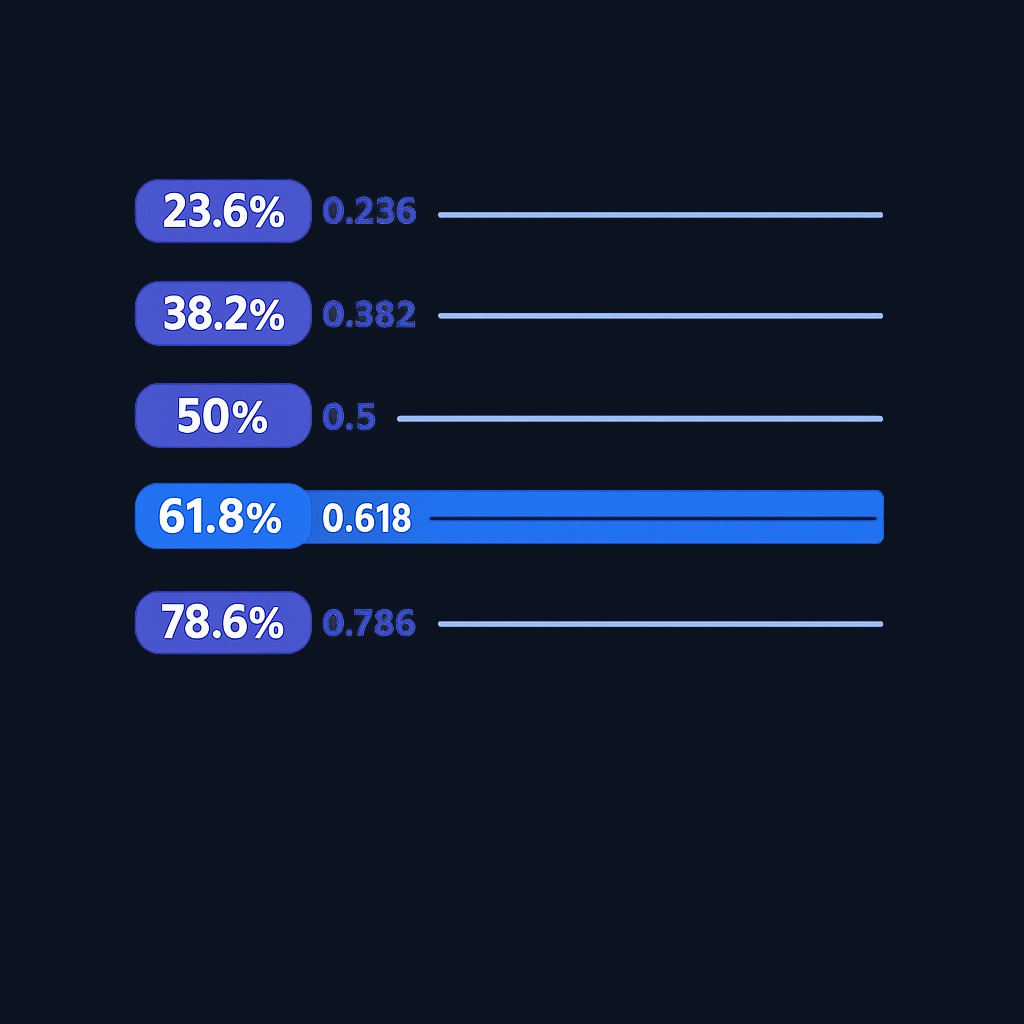
In trading terms, a retracement is a temporary move against the prevailing trend. Fibonacci retracement assumes that after a strong price move, the market tends to pull back to one of these percentage levels before the trend resumes. The tool does not predict anything on its own. It simply gives traders a consistent way to mark potential turning points on a chart.
How to calculate Fibonacci retracement levels
Most charting platforms draw the levels automatically, but the math is simple enough to do by hand:
- Identify a clear swing low and swing high on the chart. In an uptrend, draw from the low to the high. In a downtrend, draw from the high to the low.
- Take the difference between the two points. This is the size of the move.
- Multiply the move by each ratio (0.236, 0.382, 0.5, 0.618, 0.786).
- Subtract each result from the high in an uptrend, or add it to the low in a downtrend.
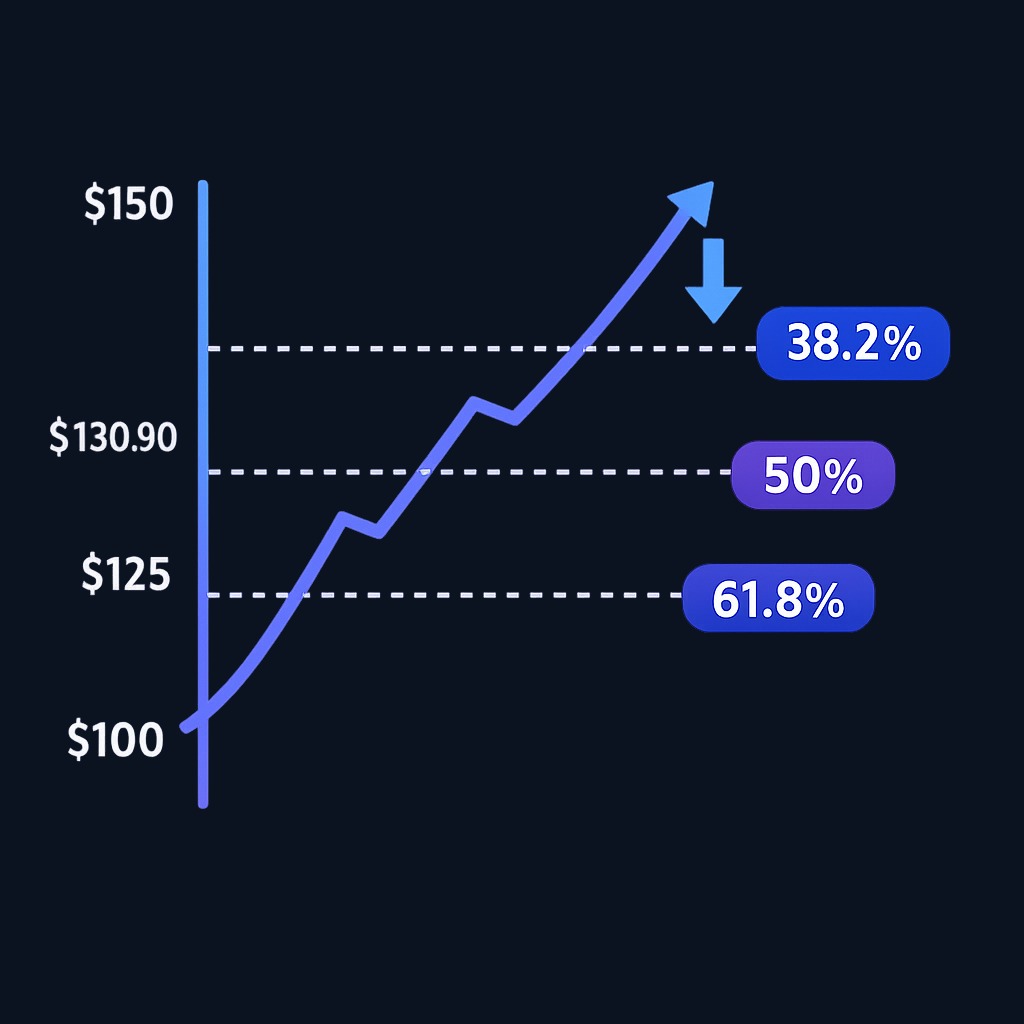
A quick example: a stock rallies from $100 to $150, a $50 move. The 38.2% retracement sits at $150 − ($50 × 0.382) = $130.90. The 50% level sits at $125, and the 61.8% level at $119.10. If the price pulls back after the rally, traders watch how it behaves around those three prices.
The levels only mean something when the swing points are obvious. If you have to squint to find the high and the low, other traders are probably drawing different lines, and the levels lose their self-fulfilling quality.
Key Fibonacci levels and what they signal
| Level | Depth of pullback | Common interpretation |
|---|---|---|
| 23.6% | Shallow | Strong trend; buyers or sellers barely let price retreat |
| 38.2% | Moderate line placement | No directional implication by itself |
| 50% | Half the move | Psychological midpoint; frequent bounce zone |
| 61.8% | Deeper line placement | Derived from the golden-ratio convention; no predictive status by itself |
| 78.6% | Very deep | Trend in question; often the final defense before full reversal |
No level guarantees a bounce. What traders actually watch is the reaction at a level: a slowdown in selling, a reversal candlestick, or rising volume near the line. A price that slices through 61.8% without hesitation tells you as much as a clean bounce would, just in the opposite direction.
How traders use Fibonacci retracement in practice
The most common use is timing entries in the direction of an existing trend. Instead of chasing a fast-moving price, a trend follower waits for the pullback to reach a retracement level, looks for confirmation, and enters closer to support with a tighter stop-loss below the next level down.
Confluence with other tools
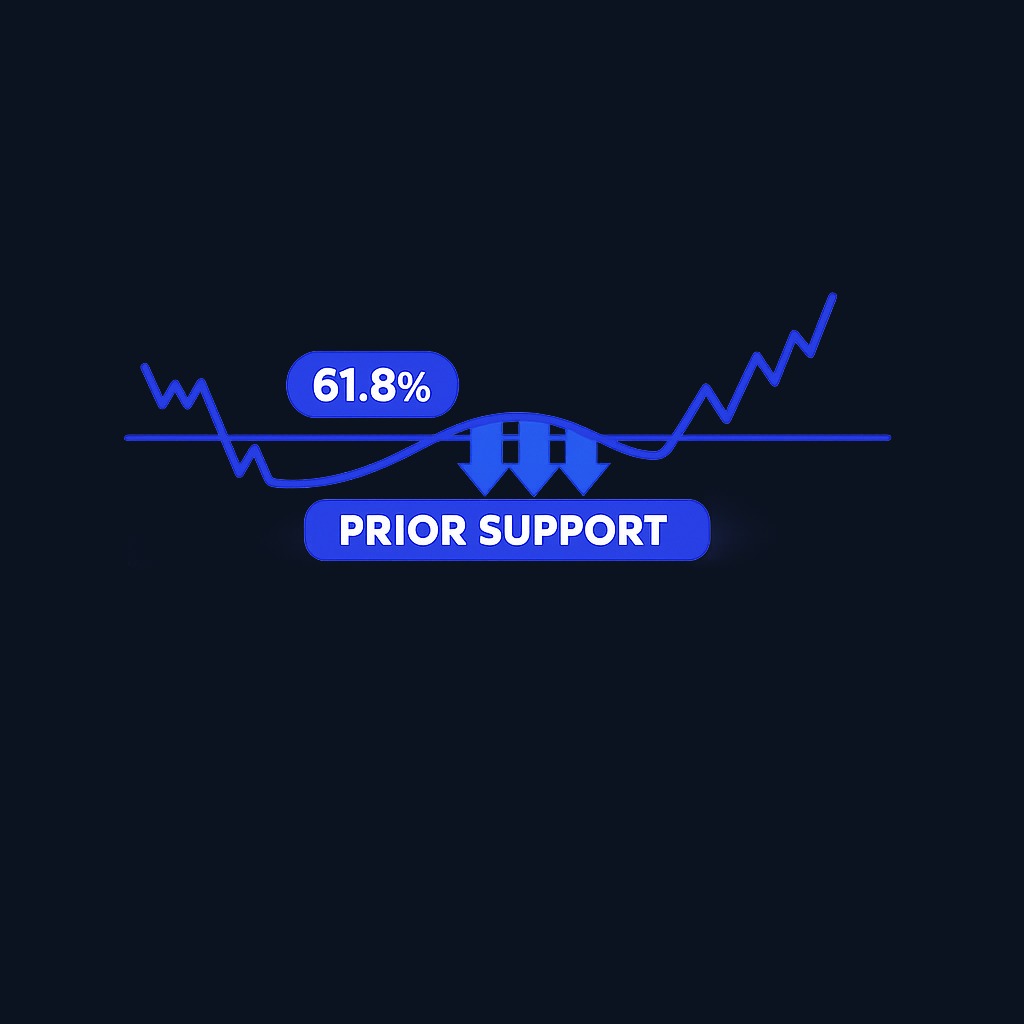
Fibonacci levels work best when they line up with independent signals. A 38.2% retracement that lands on a prior support and resistance zone, a rising moving average, or a round-number price carries more weight than a lone line on the chart. Many traders also check candlestick patterns at the level for reversal evidence before entering.
Setting targets and stops
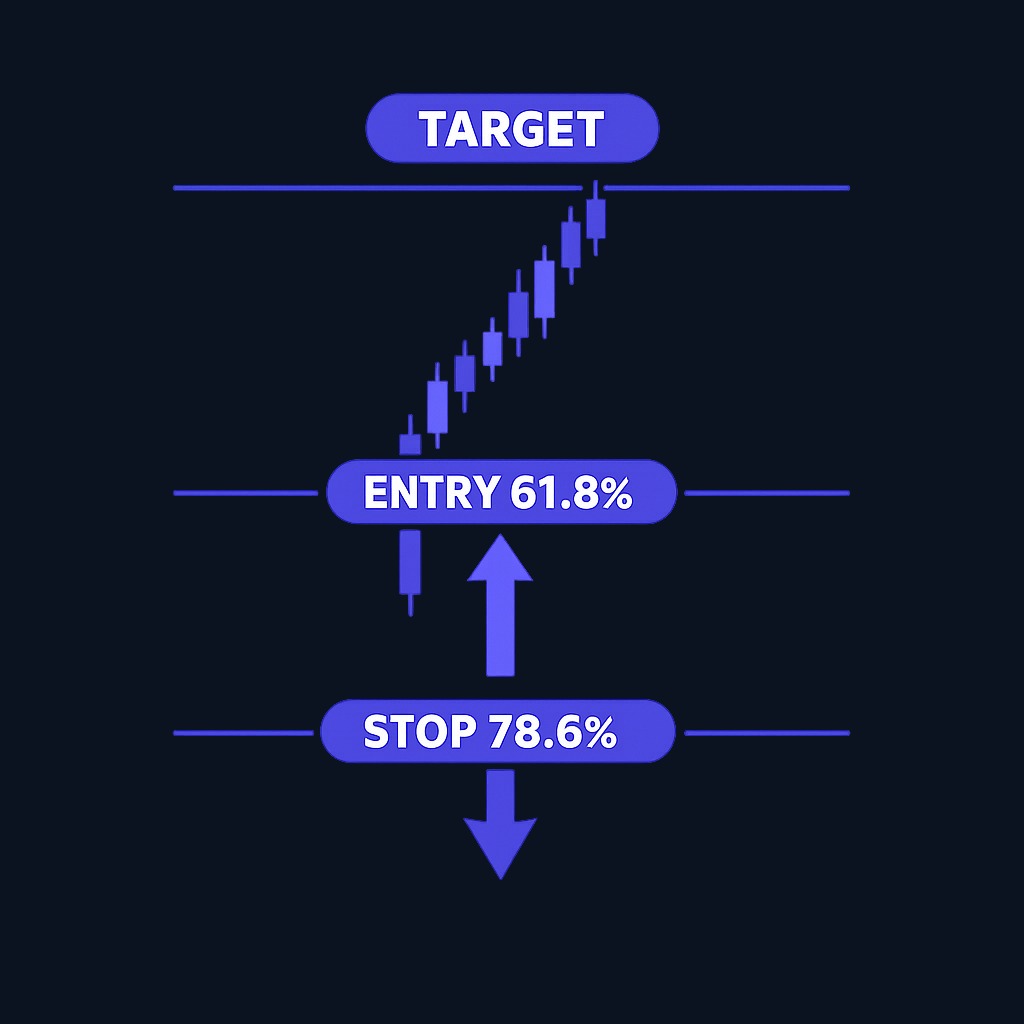
Beyond entries, the levels help place exits. A trader entering at the 61.8% level might target the prior swing high, while placing a stop just past the 78.6% line, keeping the potential loss small relative to the potential gain.
Common mistakes to avoid
- Drawing the tool on minor wiggles instead of clear swing highs and lows.
- Treating a level as a trade signal by itself, with no confirmation from price behavior or volume.
- Forcing the levels onto choppy, sideways markets where no real trend exists.
- Redrawing anchors after the fact until the chart agrees with the trade you already wanted to take.
- Ignoring risk management because a "golden ratio" level feels reliable.
Practice trading with Finelo
Practice in a simulator, learn with bite-sized lessons, and build confidence before risking real money.
What to know before deciding
Fibonacci retracement is a discretionary tool, and the research record on its predictive power is mixed. Levels often appear to work partly because many traders watch the same lines, creating self-fulfilling behavior around them. That effect is strongest in liquid, widely charted markets and weakest in thin ones.
Short-term technical trading is also an active, high-effort style. The U.S. Securities and Exchange Commission cautions that active short-term traders should only risk money they can afford to lose, as most face significant losses; its day trading risk bulletin is a sober companion to any technical tool. Fibonacci retracement can sharpen entries and exits within a tested plan, but it does not replace position sizing, stops, or an edge.
Time commitment matters too. Using the tool well means reviewing charts regularly, journaling which levels held or failed, and refining anchor selection. If you cannot commit that time, a passive approach may fit your goals better than level-to-level trading.
Decision framework: is Fibonacci retracement right for your strategy?
- You want a repeatable annotation framework. Possible fit. Define swing selection and confirmation objectively, then test the exact levels and stop rules before using them.
- You trade breakouts. Partial fit. Retracement levels help define invalidation points after a breakout pulls back.
- You invest long term and rebalance occasionally. Weak fit. Level-watching adds noise; fundamentals and asset allocation drive your results.
- You are brand new to charts. Learn candlesticks, trend, and support and resistance first, then add Fibonacci retracement on a practice account before trading it live.
- You dislike discretionary judgment. Consider rules-based indicators instead; anchor selection makes this tool inherently subjective.
FAQ
What is Fibonacci retracement in simple terms?
It is a set of horizontal lines drawn between a swing high and a swing low at 23.6%, 38.2%, 50%, 61.8%, and 78.6% of that move. Traders use the lines as a map of where a pullback might stall or reverse.
Which Fibonacci level is the most important?
Most traders treat 61.8% as the signature level because it comes directly from the golden ratio. In practice, the level that matters is the one where price actually reacts, especially when it overlaps other support or resistance evidence.
Does Fibonacci retracement work in all markets?
The tool can be drawn on stocks, indexes, forex, and crypto at any timeframe. It behaves best in liquid markets with clear trends and poorly in choppy or thinly traded conditions.
Can Fibonacci retracement predict prices?
No. The levels flag zones where a reaction is more likely, not certain. Treat them as context for a plan that includes confirmation signals, position sizing, and a stop-loss.
Conclusion and next steps
Fibonacci retracement gives structure to the messy middle of a trend: it turns "price is pulling back" into specific levels you can plan around. Learn the calculation once, draw the tool only on clear swings, demand confirmation at each level, and log the results so you learn how your markets respect the lines. Start on a simulator or small size, and treat every level as a hypothesis rather than a promise.
Chart AnalysisTechnical AnalysisBeginner
Practice trading with Finelo
Practice in a simulator, learn with bite-sized lessons, and build confidence before risking real money.
About the author
Finelo Team
The Finelo Team creates practical investing and trading education designed to help beginners learn faster with structured challenges, simulator practice, and bite-sized lessons.
Keep reading — Related articles

Chart Analysis
Symmetrical Triangle Pattern: Identification, Breakouts, and Limits
A symmetrical triangle forms when lower highs and higher lows narrow the trading range. Learn to identify it, assess breakout confirmation, and recognize false signals.
Finelo Team

Chart Analysis
Hanging Man Candlestick: The Hammer’s Bearish Twin Explained
A hanging man is a bearish warning candle after an uptrend. Learn how its context differs from a hammer, why confirmation matters, and when the warning fails.
Finelo Team

Chart Analysis
Evening Star Pattern: How to Identify a Three-Candle Reversal
The evening star is a three-candle bearish reversal pattern that forms after an uptrend. Learn its anatomy, confirmation signals, and limitations before interpreting it on a chart.
Finelo Team


