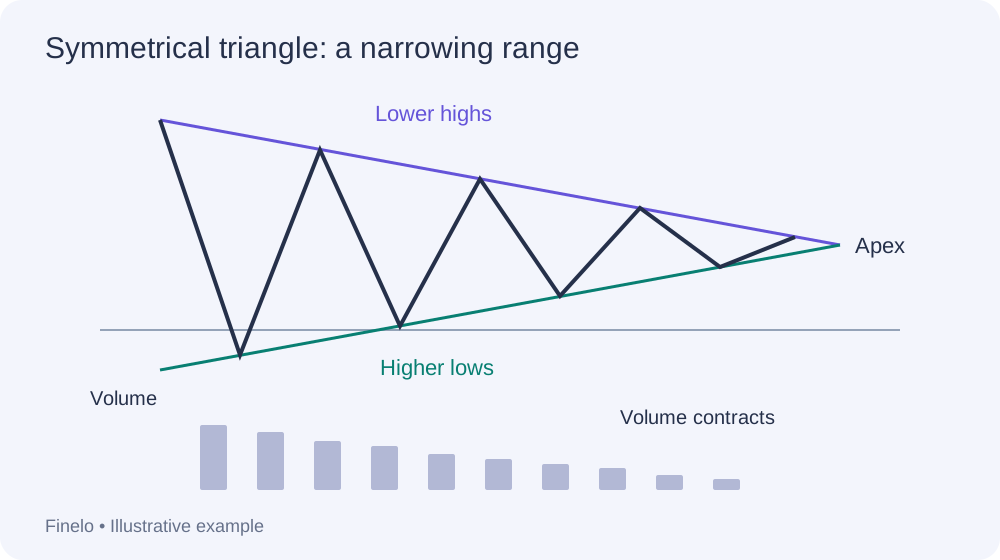
A symmetrical triangle is a chart pattern that forms when price makes lower highs and higher lows at the same time. Connect the highs and you get a falling trendline; connect the lows and you get a rising one.
Symmetrical Triangle Pattern: Identification, Breakouts, and Limits

A symmetrical triangle forms when lower highs and higher lows narrow the trading range. Learn to identify it, assess breakout confirmation, and recognize false signals.
9 min read
Practice trading with Finelo
Practice in a simulator, learn with bite-sized lessons, and build confidence before risking real money.
Want to learn more?
Practice in a simulator, learn with bite-sized lessons, and build confidence before risking real money.
Explore FineloExplore Finelo's 28-day challenges
Turn learning into a daily habit with guided challenge paths.
The two lines converge toward a point called the apex, squeezing price into a narrower and narrower range, which is why traders also call it a coil. The pattern reflects indecision: neither buyers nor sellers are in control, and the market is winding up for its next move. A symmetrical triangle is neither bullish nor bearish on its own.
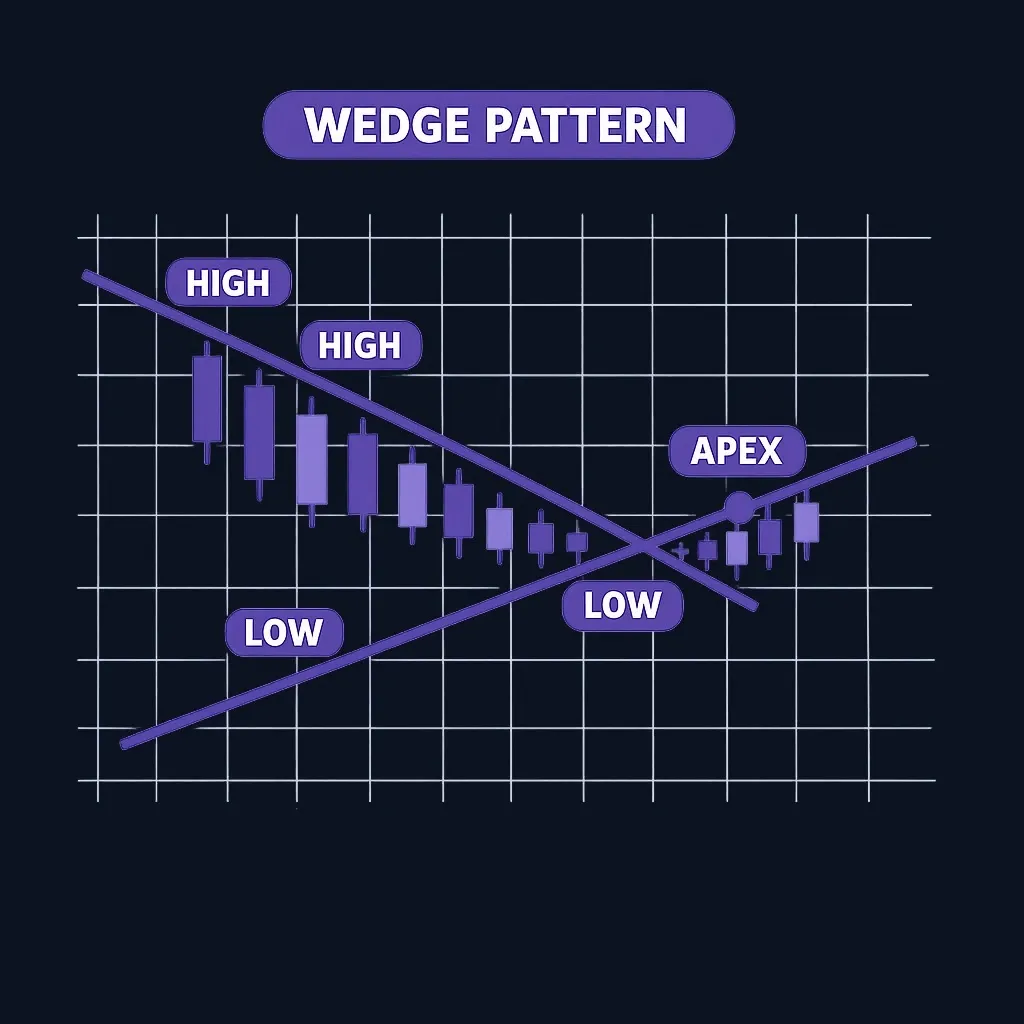
The direction only becomes known when price breaks out of one of the two trendlines, and even then a break can fail without a jump in volume to back it.
This guide covers how to spot the pattern, read the breakout, calculate the target, and place it alongside its two siblings, the ascending triangle and the descending triangle.
A symmetrical triangle tells you a move is coming, not which way it will go.
What a symmetrical triangle is
Three elements define the pattern. A falling upper trendline runs across at least two lower highs, showing sellers stepping in earlier each time. A rising lower trendline runs across at least two higher lows, showing buyers doing the same. The apex is the point where the two lines would meet if price never escaped.
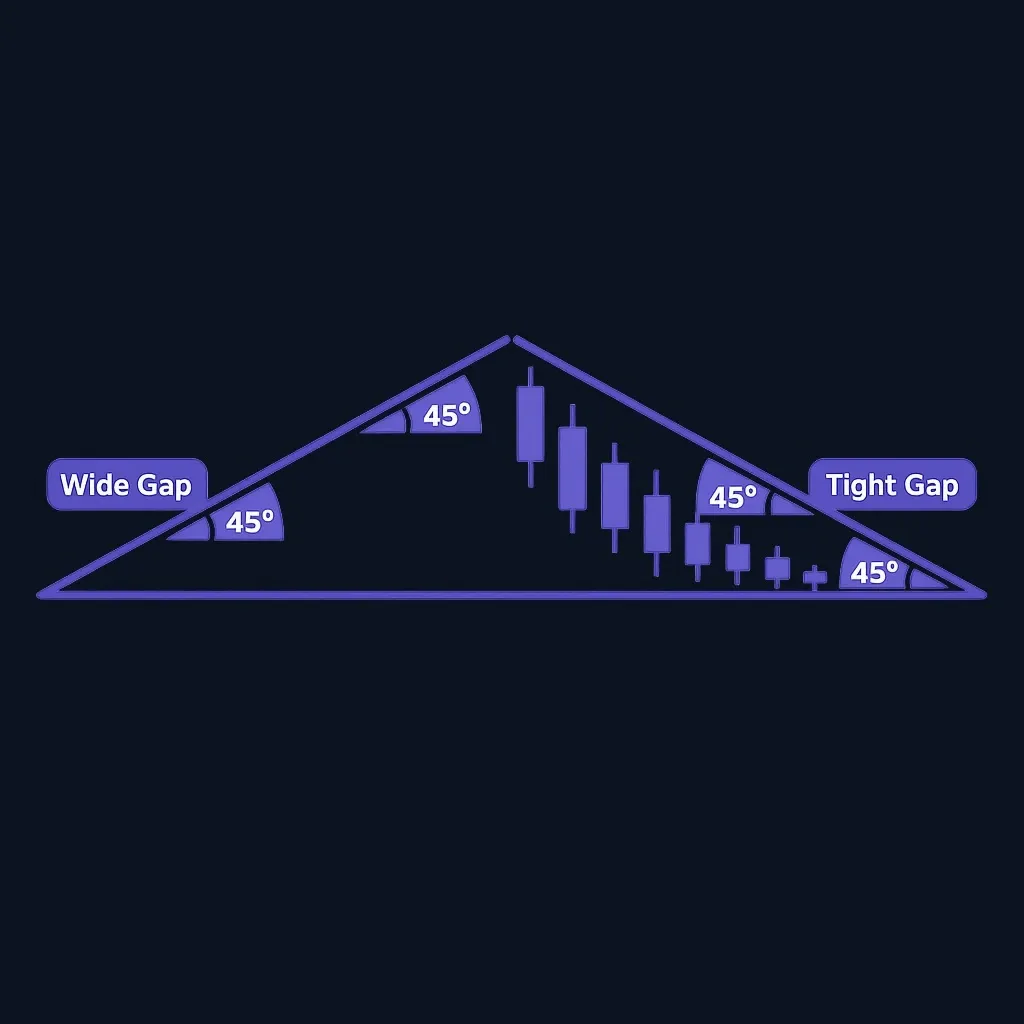
Because both sides give ground at a similar rate, the two trendlines carry roughly equal and opposite slopes. Each swing is smaller than the last, volatility contracts, and the price action visually coils. Like a spring compressed from both ends, the tighter it winds, the more energy the release tends to carry.
It helps to be comfortable reading a stock chart and reading candlesticks before you lean on a pattern like this.
How to identify a symmetrical triangle
Run this five-point check before calling anything a symmetrical triangle:
- At least two lower highs that connect into a clean falling line. Three touches are stronger than two.
- At least two higher lows that connect into a clean rising line. Four touch points across both lines is the minimum; six is ideal.
- Roughly symmetrical slopes. If the top line is flat, you are looking at an ascending triangle; if the bottom is flat, a descending one.
- Shrinking volume. Activity should visibly dry up as the range narrows. Steady or rising volume inside the pattern is a warning that it may not be a triangle at all.
- Enough time. Formations that resolve in under about three weeks are usually classified as pennants; a typical symmetrical triangle takes several weeks to around three months to form.
Get through all five and you have a candidate. Miss one, especially the volume contraction, and you probably have noise dressed up as a pattern.
What the pattern means, honestly
A symmetrical triangle is a stalemate tightening toward a verdict. Buyers refuse to wait for lower prices; sellers refuse to wait for higher ones. Something has to give.
Classic technical analysis often treats the symmetrical triangle as a continuation pattern, but it can also mark a reversal. Published success rates depend on how the pattern is defined, the market, the timeframe, and the sample; no single percentage should be treated as the odds of the next breakout.
A triangle inside an uptrend breaks upward somewhat more often than not, and that is a tendency, not a promise.
The pattern forecasts volatility far better than it forecasts direction. A long contraction is typically followed by an expansion, which is why experienced traders treat the triangle as a "get ready" signal rather than a directional call.
Trading the breakout
Traders separate the signal from the confirmation, and the gap between them is where most beginner mistakes live.
The signal is a close beyond one of the trendlines. A close carries more weight than an intraday poke through the line, which reverses often. Some traders add stricter filters, requiring the move to clear the line by about 3% or hold for three days, taking a later entry in exchange for fewer fakeouts.
The confirmation is volume. A genuine breakout usually arrives with a clear expansion in volume, often back above the levels seen before the triangle formed. A break on quiet volume, an upside one especially, deserves suspicion.
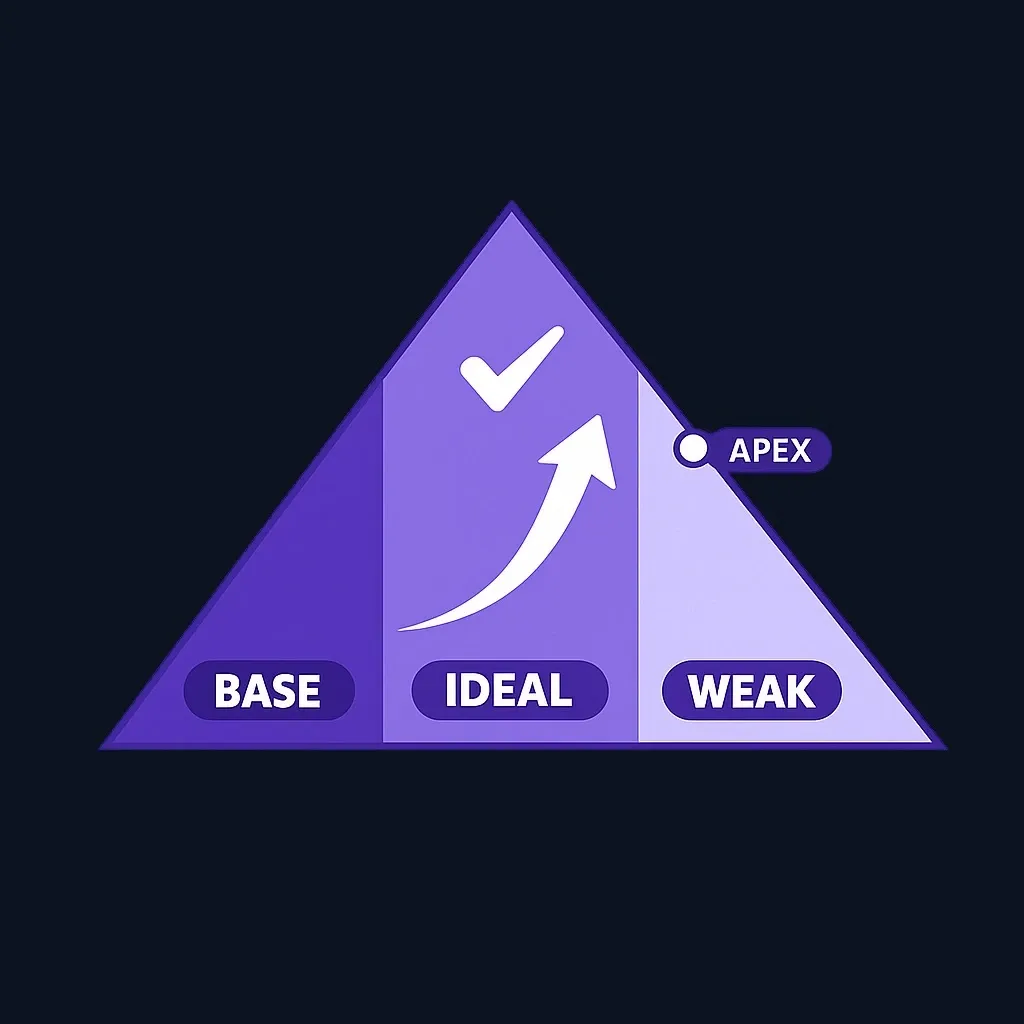
Timing matters too. Breakouts that occur roughly half to three-quarters of the way from the base to the apex are considered the most reliable. Let price drift all the way into the apex without breaking and the coil has lost its spring; moves from there tend to be weak and choppy.
There are two common ways in. Some traders enter immediately on the confirmed break, earlier but more exposed to fakeouts. Others wait for a retest, when price returns to the broken trendline, now flipped from resistance to support or the reverse, for a second entry with a tighter stop just beyond the line.
Either way, position sizing and stops belong to a broader risk management plan, because the pattern itself is only a probability.
The measured-move target
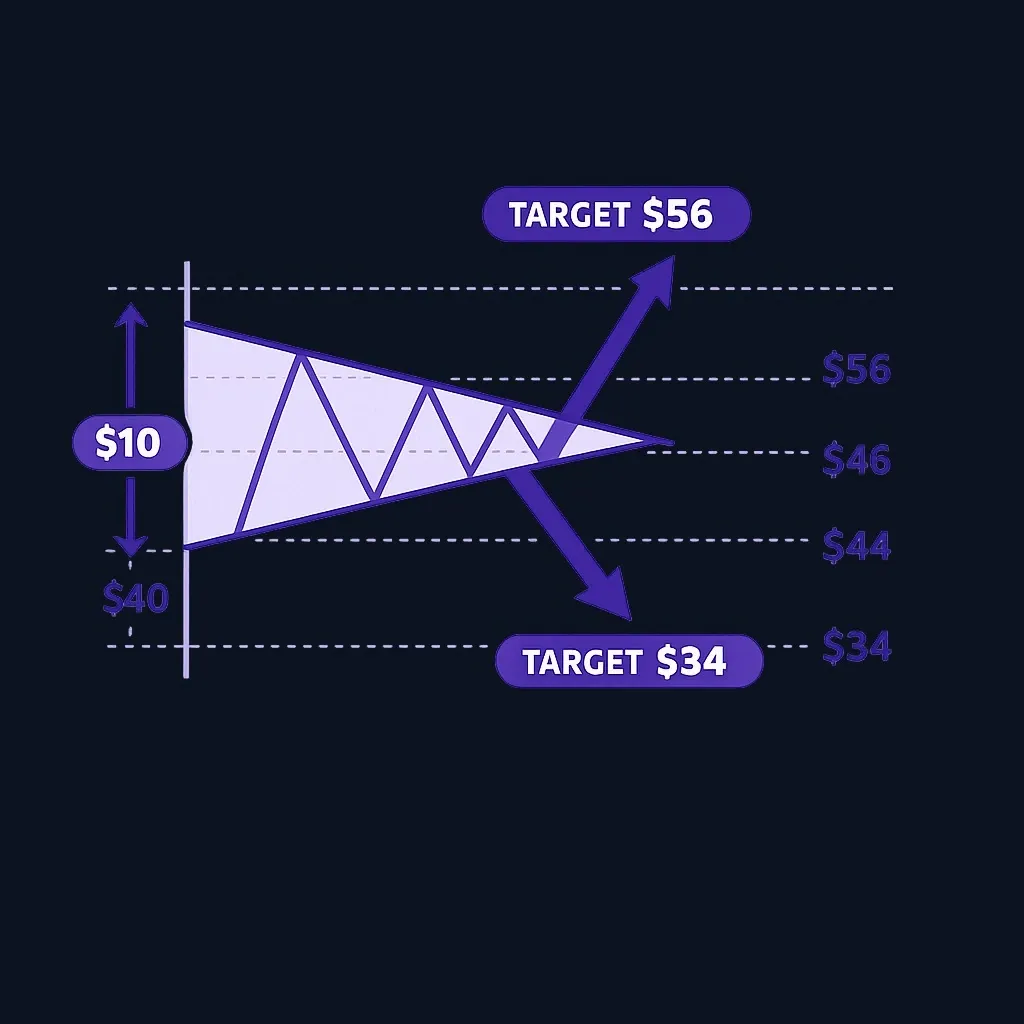
The conventional target uses the triangle's own size. Measure the height of the pattern at its widest point, then project that distance from the breakout level in the direction of the break. The numbers below are one illustrative example with round figures.
- The first swing runs from a high of $50 to a low of $40, so the pattern height is $10.
- If price breaks upward through the falling trendline near $46, the target is about $56, the $46 break plus the $10 height.
- If price instead breaks downward through the rising trendline near $44, the target is about $34, the $44 break minus the $10 height.
The same triangle produces both targets, because it never knew which way it would break, and neither did anyone watching it. The measured move is a way to frame expectations, not a forecast; price can fall short of it or run straight through it.
A worked example, step by step
Picture that same illustrative pattern as a full life cycle, not a real historical chart. A stock rallies from $30 to $50, then stalls. Over about eight weeks it prints a high of $50, a low of $40, a lower high near $48, a higher low near $42, and a third lower high near $46: five touches across two converging lines. Volume, heavy during the rally, shrinks week after week inside the pattern.
About two-thirds of the way to the apex, price closes above the falling trendline near $46 on the heaviest volume in a month. The next day it dips back, tags the broken line from above, and holds: the retest. From there the advance resumes toward the measured target near $56.
That is the textbook sequence: formation, contraction, confirmed break, retest, follow-through. Real charts rarely run it so cleanly, which is why each step here waited for confirmation before trusting the last.
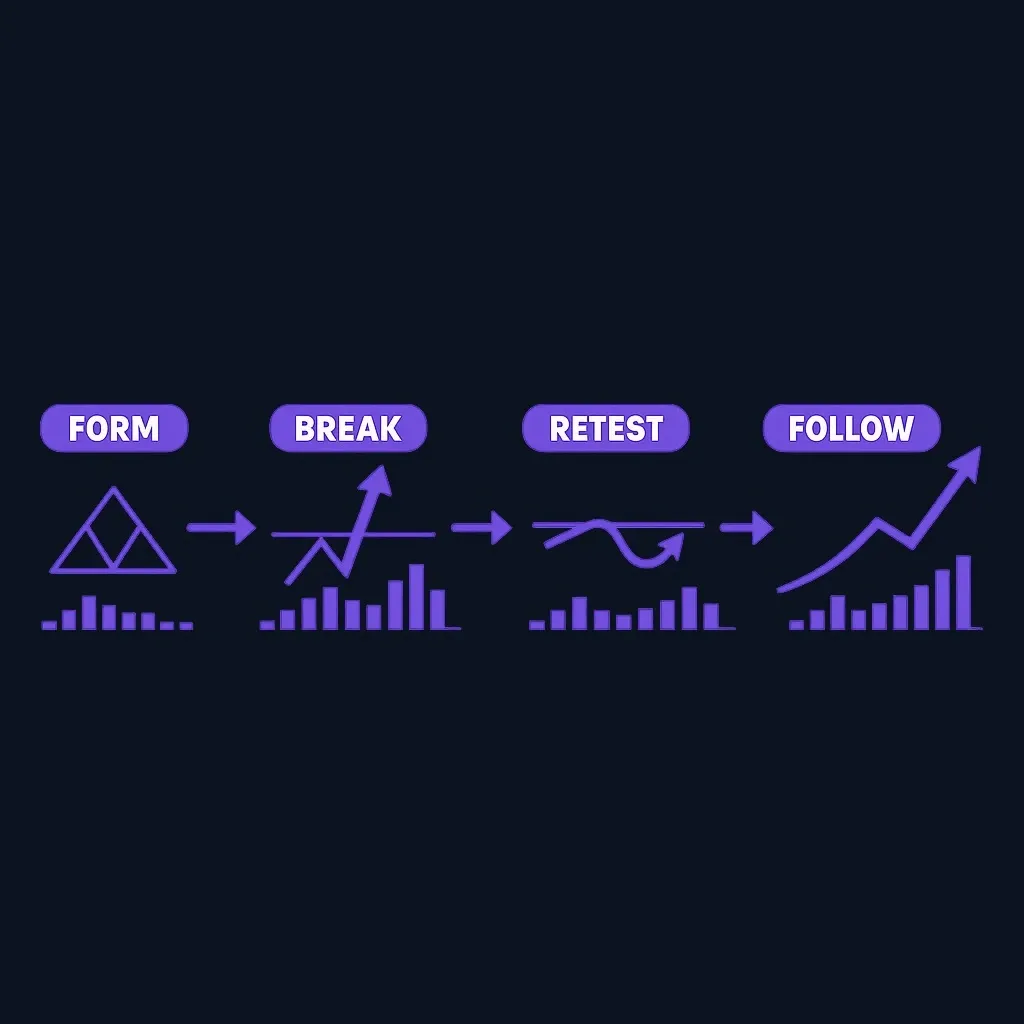
These figures are illustrative, not a prediction.
Practice trading with Finelo
Practice in a simulator, learn with bite-sized lessons, and build confidence before risking real money.
False breakouts
The symmetrical triangle's biggest practical hazard is the fakeout: price pierces a trendline, pulls in breakout traders, then snaps back inside and often runs the other way. Warning signs include a break on below-average volume, a reversal within the next one to three candles, and choppy action after the move. Late-stage patterns near the apex fake out disproportionately.
This is the same trap mechanic covered in Finelo's guide to the bull trap vs bear trap, worth reading alongside this page, because a failed triangle breakout is one of the most common ways those traps form.
Symmetrical vs ascending vs descending triangle
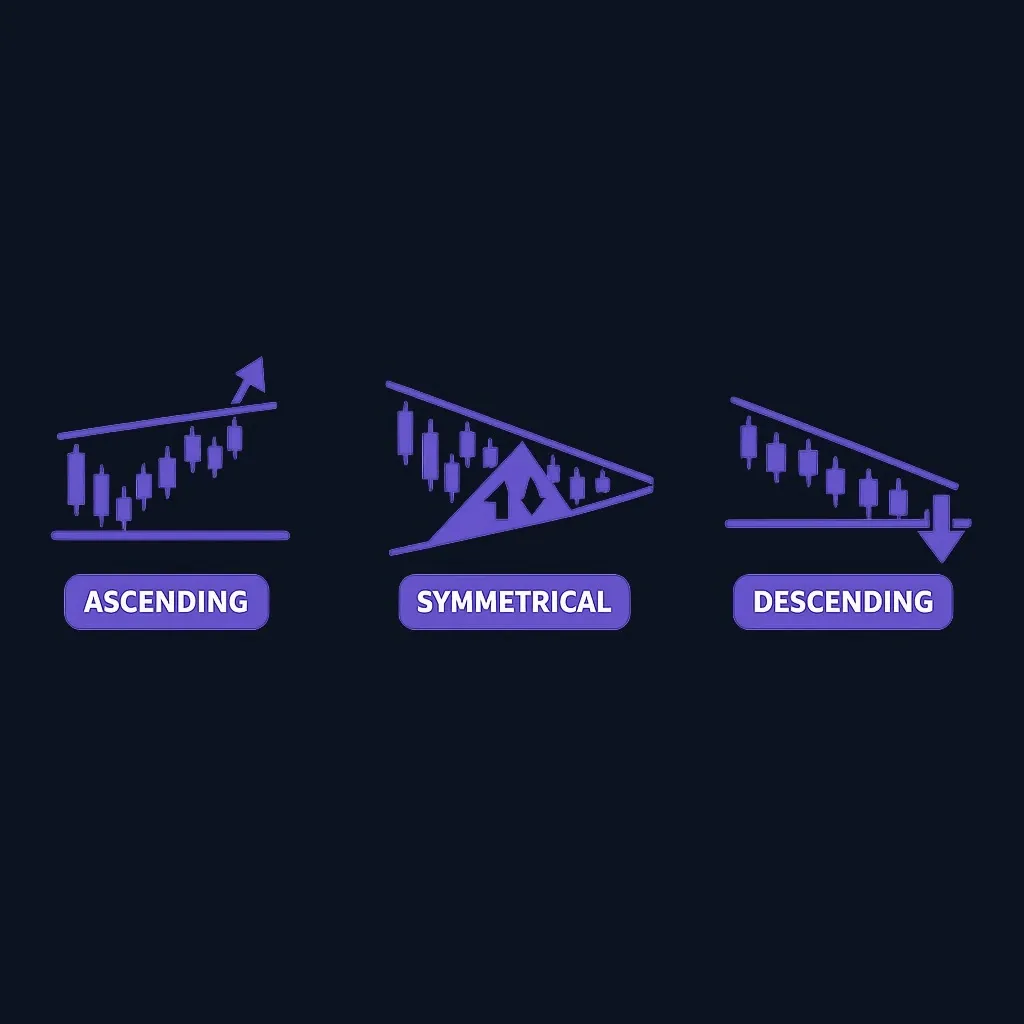
All three triangles share the same grammar, trendlines, contraction, breakout, measured move, so learning one deepens the other two. What separates them is the trendline shape and the bias it implies.
| Symmetrical triangle | Ascending triangle | Descending triangle | |
|---|---|---|---|
| Upper trendline | Falling (lower highs) | Flat (equal highs) | Falling (lower highs) |
| Lower trendline | Rising (higher lows) | Rising (higher lows) | Flat (equal lows) |
| Built-in bias | None, direction unknown | Leans bullish | Leans bearish |
| What it shows | Two-sided indecision | Buyers pressing a ceiling | Sellers pressing a floor |
| Typical resolution | Either way; prior trend favored | Often, not always, upward | Often, not always, downward |
With this page, the trio is complete: the ascending triangle for the bullish lean, the descending triangle for the bearish lean, and the symmetrical triangle for the undecided middle. A close cousin worth knowing is the falling wedge, where both trendlines slope the same way rather than tilting toward each other from opposite directions.
Limitations
Be clear-eyed about what the pattern cannot do. It cannot predict breakout direction; anyone claiming otherwise is selling a certainty the pattern does not contain. It grows unreliable near the apex, where the coil's energy has dissipated. No chart pattern survives contact with a surprise earnings report. A macro shock resolves a triangle in whatever direction it pleases, however clean the lines looked. Counter-trend triangles, forming against the larger trend, tend to underperform with-trend ones. And like every chart pattern, it suffers from hindsight bias: obvious on a historical chart, far messier while forming in real time.
Practice before you risk anything
If you are still learning to spot these, do not start on a live chart with real money. Collect examples first: clean triangles, ones that broke and ran, and ones that faked out and reversed. Mark the two trendlines, watch the volume contract, and write down what a confirmed breakout would have looked like.
Inside the Finelo app, you can study chart structure and practice buy, sell, and hold decisions on real market data with virtual funds. There are no deposits, no withdrawals, and no broker connection, it is a closed practice loop, so the only cost of a wrong read is the lesson.
A pattern is a tool for thinking more clearly, not a substitute for judgment.
Where to learn more
Chart patterns are widely taught, but that does not make them certain; a good source explains what a signal represents, when it matters, and where it fails. To learn more, Finelo publishes educational material for beginners; you can also read Finelo reviews, the About Finelo page, or the Finelo support center.
Educational note: This article is for educational purposes only and does not constitute financial, investment, legal, or tax advice. Finelo is an educational product, not a brokerage or adviser. Simulator practice uses virtual funds. Investing and trading involve risk, including possible loss of principal; verify account-specific requirements with your broker.
Sources and Further Verification
Frequently asked questions
Is a symmetrical triangle pattern bullish or bearish?
Neither by itself. The converging trendlines show balanced indecision, and the pattern only takes on a direction when price breaks out of one line. Context can add a lean, since triangles within an uptrend have historically resolved upward more often, but the direction is unknown until the breakout is confirmed.
What is a symmetrical triangle pattern?
It is a consolidation pattern formed by two converging trendlines, one falling across lower highs and one rising across higher lows, that squeeze price into a narrowing range. It signals shrinking volatility and market indecision, usually resolved by a breakout in either direction and ideally confirmed by rising volume.
What is the price target for a symmetrical triangle?
The conventional target is the measured move: take the height of the triangle at its widest point and project it from the breakout level in the direction of the break. A triangle $10 tall that breaks upward near $46 points toward roughly $56. It frames expectations rather than guaranteeing them.
What is the most powerful pattern in trading?
There is not one, and that is the honest answer. Every pattern, triangles included, is a probabilistic tendency whose usefulness depends on context, confirmation, and risk control. A trader with a modest pattern and disciplined risk management will usually outlast one with a "powerful" pattern and none.
How is a symmetrical triangle different from a pennant?
Mainly duration and context. A pennant is a small, fast consolidation, typically under three weeks, that forms after a sharp near-vertical move. A symmetrical triangle is larger and slower, usually taking several weeks to a few months, and does not require that preceding spike.
How reliable is a symmetrical triangle breakout?
Reliability varies with volume, timing, and trend context, not a fixed win rate. Breakouts backed by a volume expansion, occurring half to three-quarters of the way to the apex, and moving with the larger trend tend to hold better. Quiet-volume breaks near the apex fail most often.
Symmetrical Triangle PatternChart AnalysisBeginner
Practice trading with Finelo
Practice in a simulator, learn with bite-sized lessons, and build confidence before risking real money.
About the author
Finelo Team
The Finelo Team creates practical investing and trading education designed to help beginners learn faster with structured challenges, simulator practice, and bite-sized lessons.
Keep reading — Related articles

Chart Analysis
Hanging Man Candlestick: The Hammer’s Bearish Twin Explained
A hanging man is a bearish warning candle after an uptrend. Learn how its context differs from a hammer, why confirmation matters, and when the warning fails.
Finelo Team

Chart Analysis
Evening Star Pattern: How to Identify a Three-Candle Reversal
The evening star is a three-candle bearish reversal pattern that forms after an uptrend. Learn its anatomy, confirmation signals, and limitations before interpreting it on a chart.
Finelo Team

Chart Analysis
SMT Divergence Trading: Learn the Concept & Risk Controls
In trading, SMT stands for Smart Money Technique, and it is almost always discussed as SMT divergence. It is a concept from the ICT (Inner Circle Trader) framework that describes one specific moment: two markets that normally move together stop confirming each other.
Finelo Team


