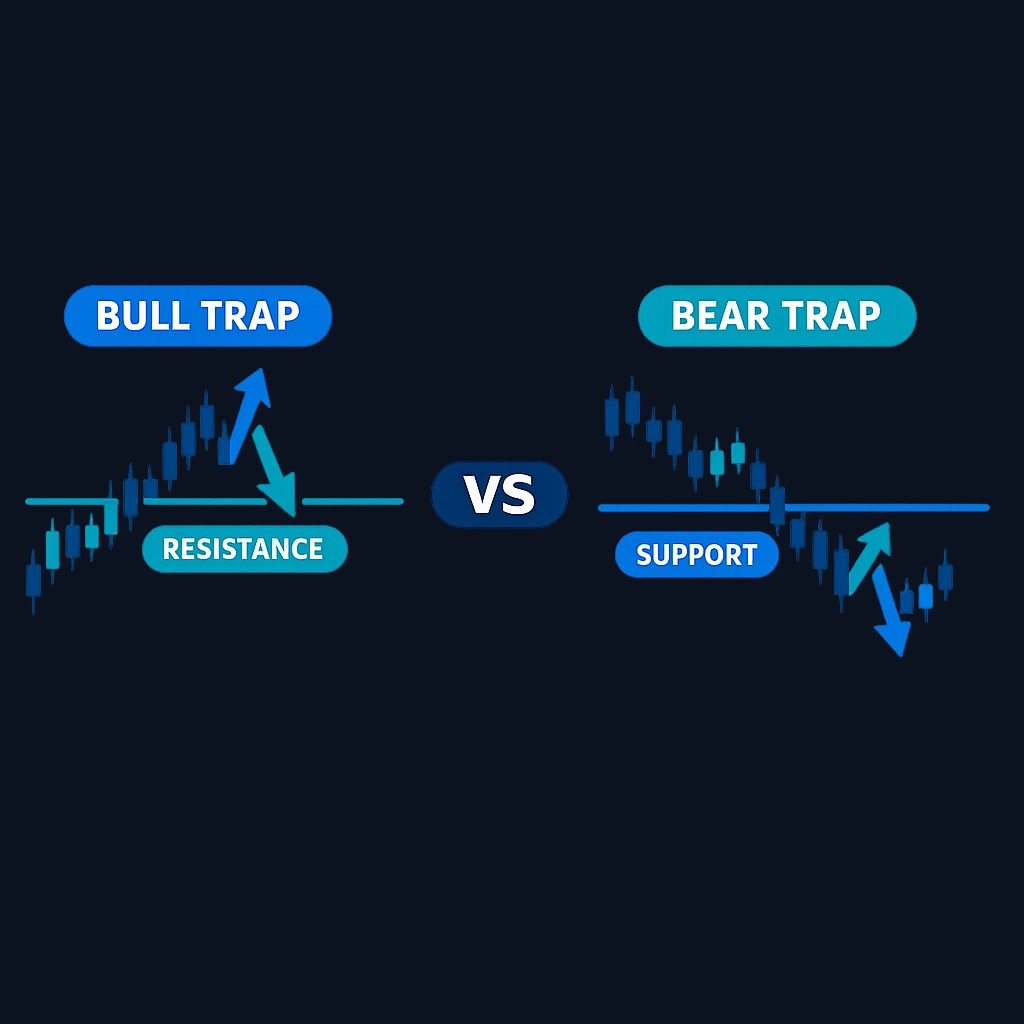
A bull trap is a false upside breakout: price pushes above resistance, pulls in buyers, then reverses down and leaves them holding losses. A bear trap is the mirror image: price breaks below support, triggers selling and short positions, then snaps back up. Same mechanism, opposite direction, different victims.
Bull Trap vs Bear Trap: How to Spot and Avoid Both

Learn the difference between a bull trap and a bear trap, why false breakouts happen, warning signs to watch, and a framework for confirming moves before acting.
7 min read
Practice trading with Finelo
Practice in a simulator, learn with bite-sized lessons, and build confidence before risking real money.
Want to learn more?
Practice in a simulator, learn with bite-sized lessons, and build confidence before risking real money.
Explore FineloExplore Finelo's 28-day challenges
Turn learning into a daily habit with guided challenge paths.
This page is for beginner and intermediate traders who use charts to time entries, and for investors who want to stop reacting to every breakout headline. You will get clear definitions, the mechanics behind both traps, concrete warning signs, and a confirmation framework you can apply before risking money. This is educational content, not financial advice.
What is a bull trap?
A bull trap starts with a level everyone is watching. Suppose a stock has failed three times near $100. One morning it prints $101.50, and breakout buyers rush in expecting a run toward new highs. Within a session or two, the move stalls, price slides back under $100, and the "breakout" becomes a rejection. Latecomers who bought above resistance are trapped with instant losses, and their selling fuels the decline.
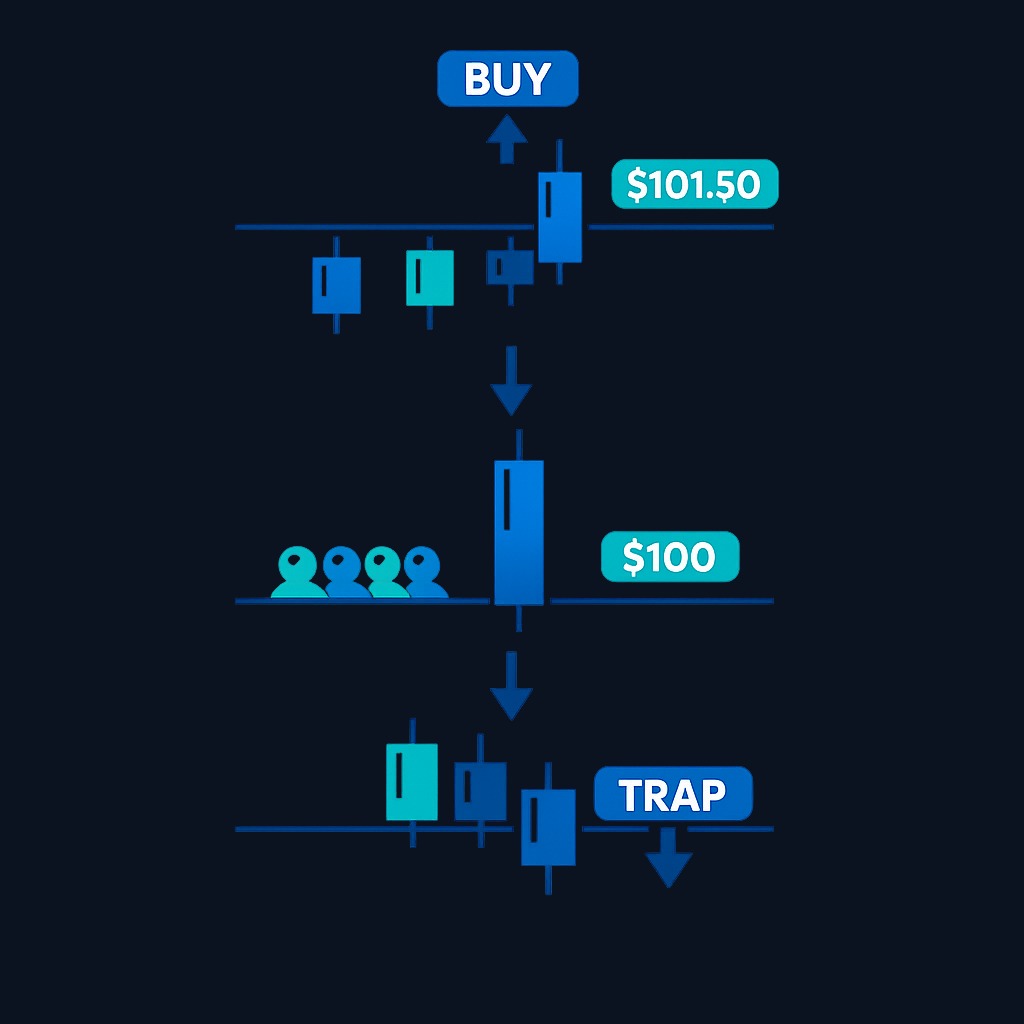
The defining feature is not the reversal itself, markets reverse all the time, but the failed commitment: price could not hold above the broken level. Bull traps cluster in fading uptrends, around hyped news, and in stocks where optimism runs ahead of actual buying power. The trap works because it exploits fear of missing out, the most expensive emotion in trading.
What is a bear trap?
A bear trap inverts the story. A stock grinds down toward support at, say, $50, then cracks to $48.75. Panic sellers dump shares, and short sellers pile in expecting a slide toward $40. Instead, buyers absorb the selling, price reclaims $50, and the decline evaporates. Sellers realize losses at the low; shorts face a rising market and must buy back shares, adding fuel to the bounce.
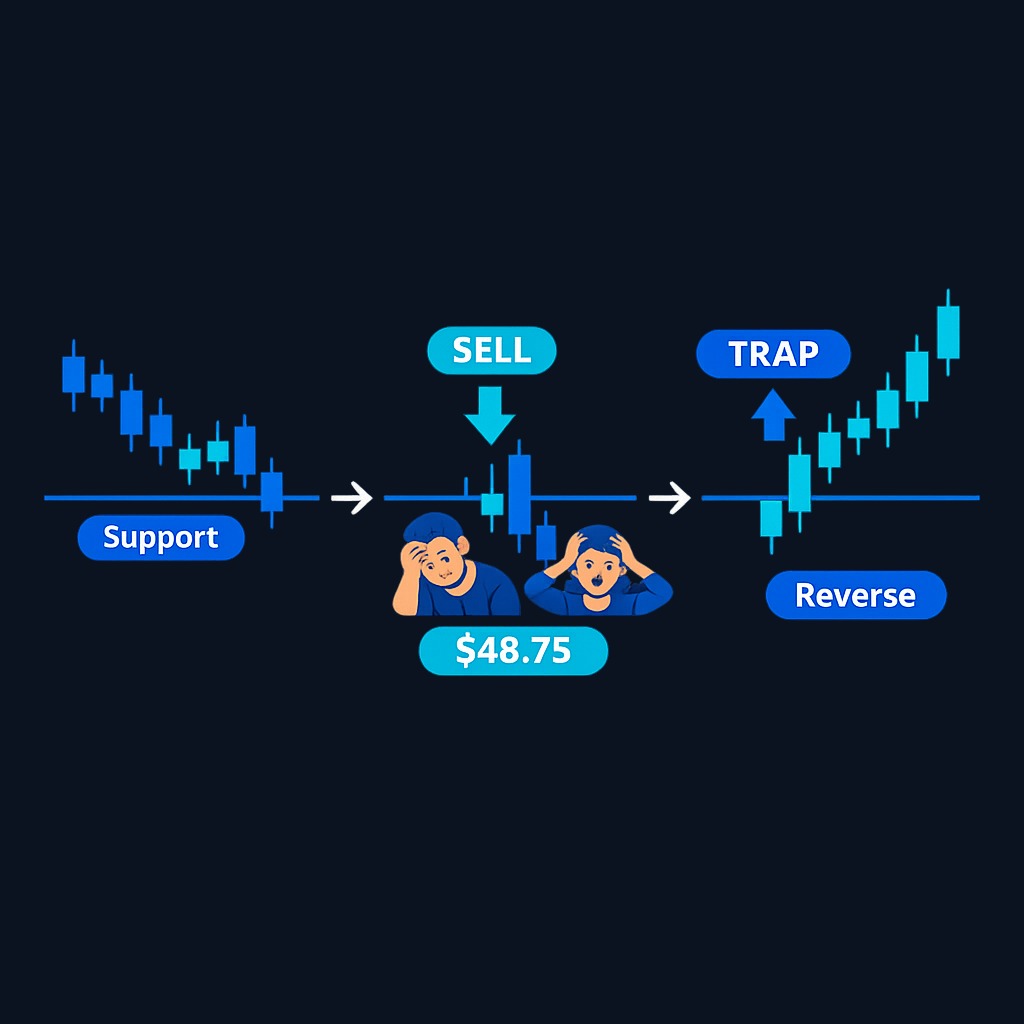
That forced short covering is why bear traps often produce sharp, fast recoveries. A trapped long can simply wait, but a trapped short is losing money with theoretically no ceiling, so shorts tend to exit fast. Bear traps concentrate near the end of downtrends, during capitulation-style selloffs, and around scary headlines that fade within days.
Bull trap vs bear trap side by side
| Feature | Bull trap | Bear trap |
|---|---|---|
| Direction of the false move | Upward, through resistance | Downward, through support |
| Who gets caught | Breakout buyers, late longs | Panic sellers, new shorts |
| Emotional fuel | Fear of missing out | Fear of further losses |
| Typical aftermath | Decline as trapped longs sell | Rally as trapped shorts cover |
| Common setting | Late-stage uptrends, hype spikes | Late-stage downtrends, capitulation |
The symmetry is the key insight of the whole bull trap vs bear trap comparison: both traps punish traders who treat a single price crossing as proof. The level break is an invitation; confirmation is the evidence.
Why traps happen
Traps are not conspiracies; they are liquidity mechanics plus crowd psychology.
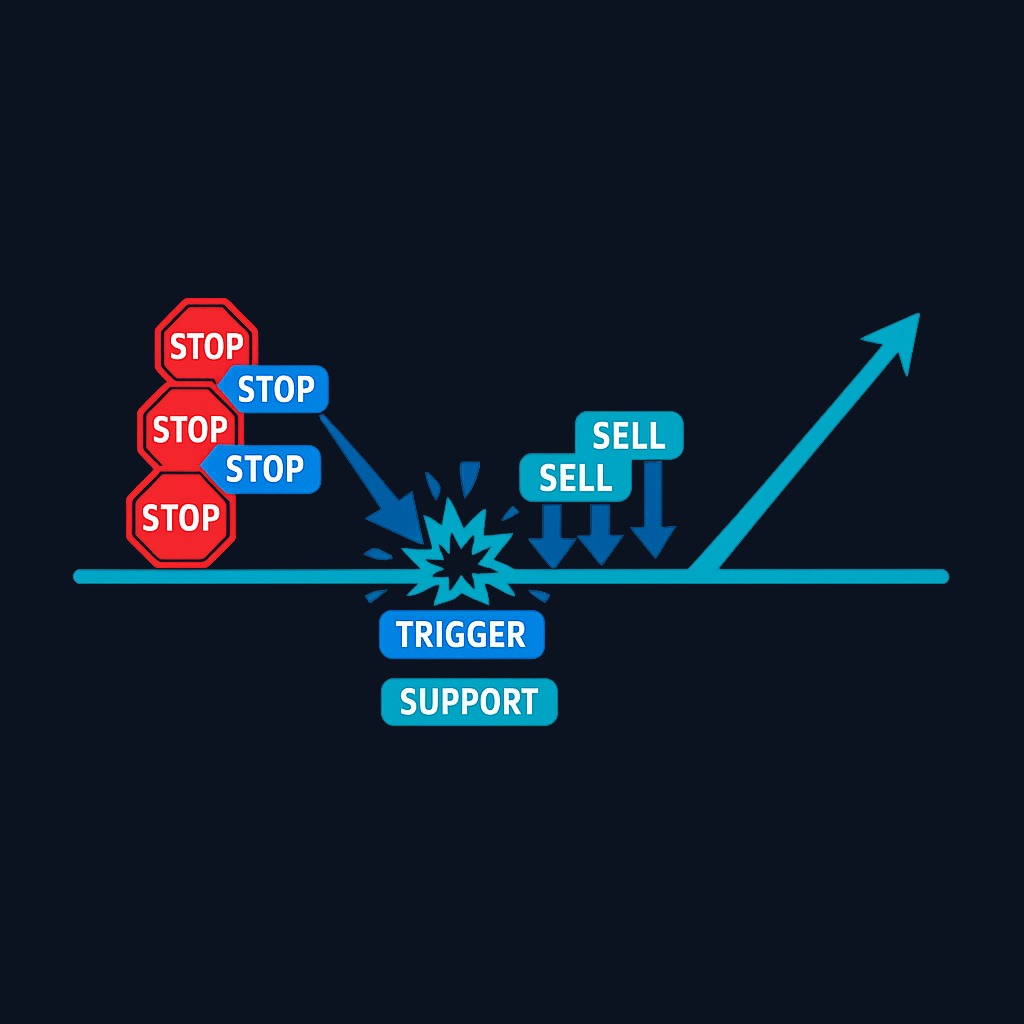
- Stop and order clusters. Obvious levels accumulate obvious orders: buy stops above resistance, sell stops below support. When price touches the level, those orders fire automatically and exaggerate the move, briefly making the break look real.
- Thin conviction. A genuine breakout needs sustained demand. If the push through the level happens on weak volume, the follow-through buying that should support the new range never arrives.
- Larger players need liquidity. An institution wanting to sell a big position benefits from the rush of eager breakout buyers; its selling into that demand can be exactly what reverses the move.
- Sentiment extremes. After a long trend, most people who wanted in are in. Breaks in the trend's direction then run out of new participants quickly, and the reversal traps the last arrivals.
None of this requires anyone to "hunt" you specifically. Predictable behavior at predictable levels is enough.
Warning signs of a bull trap
No signal is perfect, but these raise the odds that an upside break will fail:
- Weak volume on the break. The push above resistance happens on lower activity than recent average sessions.
- No follow-through. Price closes back below the broken level within a bar or two on your trading timeframe.
- Long upper wicks. Candles above the level keep closing near their lows, showing sellers absorbing each push.
- Tired trend context. The breakout comes after an extended run, far above longer-term averages, with sentiment already euphoric.
- News-driven spikes. Gaps on hype with no fundamental substance behind them often retrace once the excitement fades.
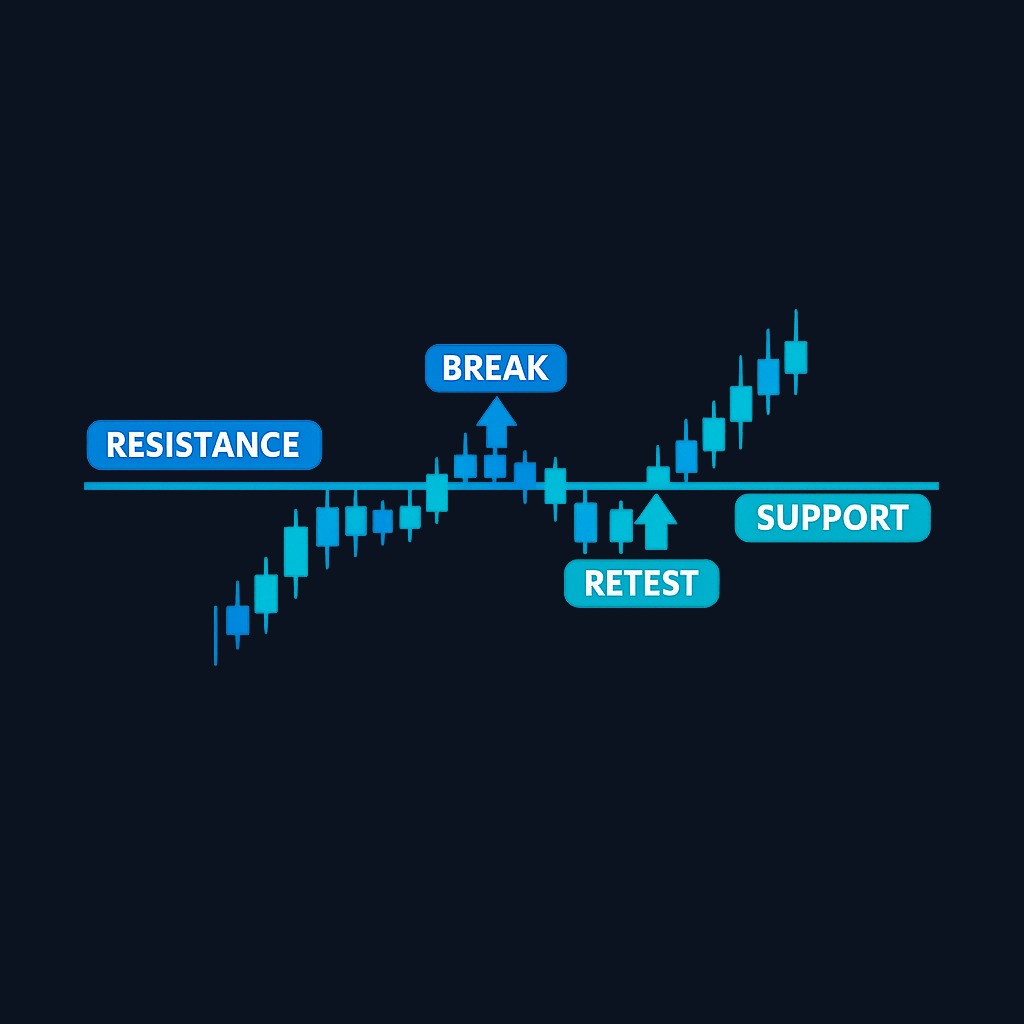
The cleanest defense is patience: demand a retest, where price returns to the broken resistance and holds it as new support before you commit.
Practice trading with Finelo
Practice in a simulator, learn with bite-sized lessons, and build confidence before risking real money.
Warning signs of a bear trap
The mirror checklist for downside breaks:
- Capitulation character. A steep, high-volume flush after a long decline often marks exhaustion rather than continuation.
- Quick reclaim. Price closes back above the broken support within a bar or two; the breakdown could not hold.
- Long lower wicks. Candles below support keep closing near their highs, showing buyers stepping in at the lows.
- Divergences. The new price low arrives with visibly weaker downside momentum than the previous low on your indicator of choice.
- Crowded short narrative. When everyone already expects collapse, the marginal seller may be gone, leaving shorts to power the rebound.
How traps interact with stop orders
Stop orders are the transmission mechanism inside most traps. A stop order converts into a market order the moment its trigger price trades, and as the SEC's investor bulletin on stop orders explains, the execution can deviate significantly from the stop price in a fast market, and a short-term intraday move can trigger the order at a much worse price than where the day ends.
That is precisely the trap scenario: a brief poke through a level fires clustered stops, the forced orders exaggerate the move, and the market then reverses, leaving stopped-out traders watching price recover without them. Practical adjustments include placing stops beyond obvious round numbers and exact prior extremes, sizing positions so a slightly wider stop is affordable, and considering stop-limit orders when you would rather risk a missed exit than a terrible fill.
What to know before deciding
Before trading any breakout or breakdown, walk this checklist:
- Define the level precisely and require a close beyond it on your timeframe, not just an intraday tick.
- Check volume against recent averages; conviction should be visible.
- Know the trend's age. Late-trend breaks fail more gracefully than early-trend ones confirm.
- Pre-plan invalidation. Decide before entry what price action proves you wrong, and what you will do about it.
- Size for the failure case. Assume the trap; if that loss is unacceptable, the position is too big.
Decision framework: confirming a break before acting
- Wait for the close. Ignore the first touch; require at least one full candle close beyond the level on your trading timeframe.
- Demand participation. Compare the break's volume to the recent norm. Below-average volume means below-average trust.
- Prefer the retest. The highest-quality entries usually come when price returns to the level and holds it from the other side.
- Locate your stop away from the crowd. Beyond the wick extremes and round numbers, sized so the trade risk stays small.
- Pre-commit to the exit. If price re-crosses the level against you, treat the setup as failed and exit; hoping is not a plan.
A confirmation-based process will make you slightly late on every genuine move. That is the fee for skipping most of the traps, and for most non-professional traders it is a fee worth paying.
Conclusion and next steps
Bull traps and bear traps are two sides of one lesson: a price crossing a famous level proves nothing by itself. Bull traps catch buyers above resistance; bear traps catch sellers and shorts below support; both feed on automatic orders and crowd emotion. Confirmation, closes beyond the level, real volume, ideally a retest, filters out most of them at the cost of slightly later entries.
Next steps: pull up three past breakouts in stocks you follow and label each as confirmed or trapped using the framework above. To practice reading support, resistance, and breakouts with structured lessons, try the Finelo learning app.
Frequently asked questions
Which is more dangerous, a bull trap or a bear trap?
It depends on your position. A bull trap costs buyers unrealized losses that grow gradually. A bear trap punishes short sellers, whose losses grow as price rises and who often must buy back quickly, which is why bear-trap reversals tend to be sharper.
Can long-term investors ignore bull and bear traps?
Mostly, yes. Traps are a timing phenomenon on charts, and a diversified long-horizon plan built on regular contributions does not depend on breakout timing. The concepts still help investors avoid panic-selling into what turns out to be a bear trap.
Do stop-loss orders cause traps?
They do not cause traps, but clustered stops amplify them. When many stops sit at the same obvious level, their triggered market orders exaggerate the initial break, making the false move look stronger than the real demand or supply behind it.
How long does a trap take to resolve?
There is no fixed rule. On daily charts, failed breaks commonly reveal themselves within a few sessions, when price closes back through the violated level. The reversal after a trap can then unfold quickly, especially in bear traps fueled by short covering.
bulltrapbearspotavoidboth
Practice trading with Finelo
Practice in a simulator, learn with bite-sized lessons, and build confidence before risking real money.
About the author
Finelo Team
The Finelo Team creates practical investing and trading education designed to help beginners learn faster with structured challenges, simulator practice, and bite-sized lessons.
Keep reading — Related articles

Chart Analysis
Symmetrical Triangle Pattern: Identification, Breakouts, and Limits
A symmetrical triangle forms when lower highs and higher lows narrow the trading range. Learn to identify it, assess breakout confirmation, and recognize false signals.
Finelo Team

Chart Analysis
Hanging Man Candlestick: The Hammer’s Bearish Twin Explained
A hanging man is a bearish warning candle after an uptrend. Learn how its context differs from a hammer, why confirmation matters, and when the warning fails.
Finelo Team

Chart Analysis
Evening Star Pattern: How to Identify a Three-Candle Reversal
The evening star is a three-candle bearish reversal pattern that forms after an uptrend. Learn its anatomy, confirmation signals, and limitations before interpreting it on a chart.
Finelo Team


