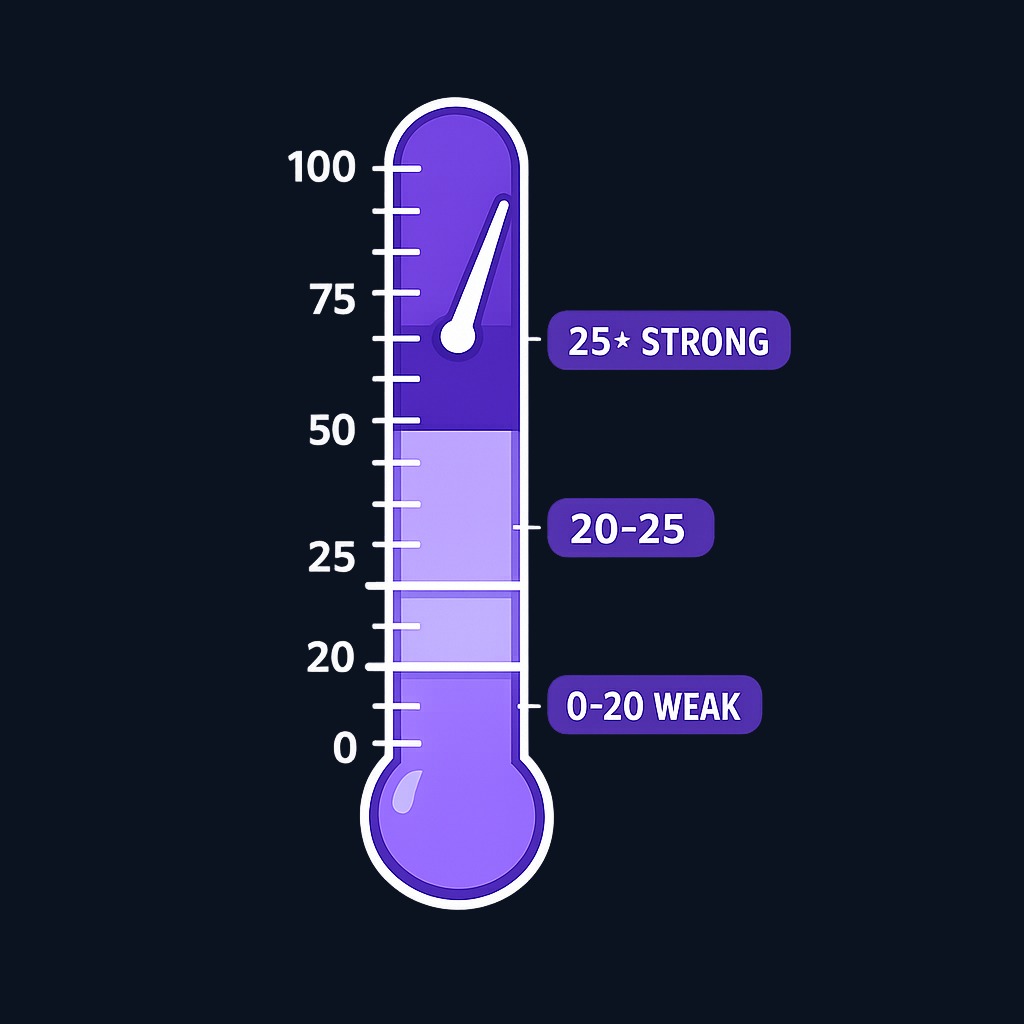
The ADX indicator, short for Average Directional Index, measures how strong a trend is on a scale from 0 to 100. It does not tell you which way the trend is going. Direction comes from two companion lines that travel with it, the +DI and the −DI, while the ADX line reports only strength. As a rough guide, an ADX below about 20 points to a weak or absent trend and a ranging market, while a reading above 25 points to a strong one, and a rising ADX means the current move is gaining force.
What Is the ADX Indicator? How to Read Trend Strength
The ADX indicator measures trend strength on a 0–100 scale — not direction. Learn how to read ADX with +DI and −DI, the classic scale thresholds, how traders use it as a filter, and the mistakes beginners make.
11 min read
Practice trading with Finelo
Practice in a simulator, learn with bite-sized lessons, and build confidence before risking real money.
Want to learn more?
Practice in a simulator, learn with bite-sized lessons, and build confidence before risking real money.
Explore FineloExplore Finelo's 28-day challenges
Turn learning into a daily habit with guided challenge paths.
It was developed by J. Welles Wilder Jr. in his 1978 book New Concepts in Technical Trading Systems, and it is a lagging indicator: it describes what price has already done rather than predicting what comes next.
This guide is for beginners who keep seeing "ADX" on charts and want a plain-English explanation of the three lines, the numbers, and how traders actually use them. You will learn why strength and direction are two separate questions, how to read the scale, roughly how the indicator is built, where it helps, and where it fails.
ADX tells you how strong a trend is. The DI lines tell you which way it points.
This article is for education only and is not financial advice.
Strength, not direction
This is the idea the whole indicator rests on, and the single most common thing beginners get wrong. ADX is non-directional: it rises when a trend is strong whether that trend is up or down. A market falling hard and one ripping higher can both show a high ADX, because both moves have force behind them. The number describes intensity, not sign.
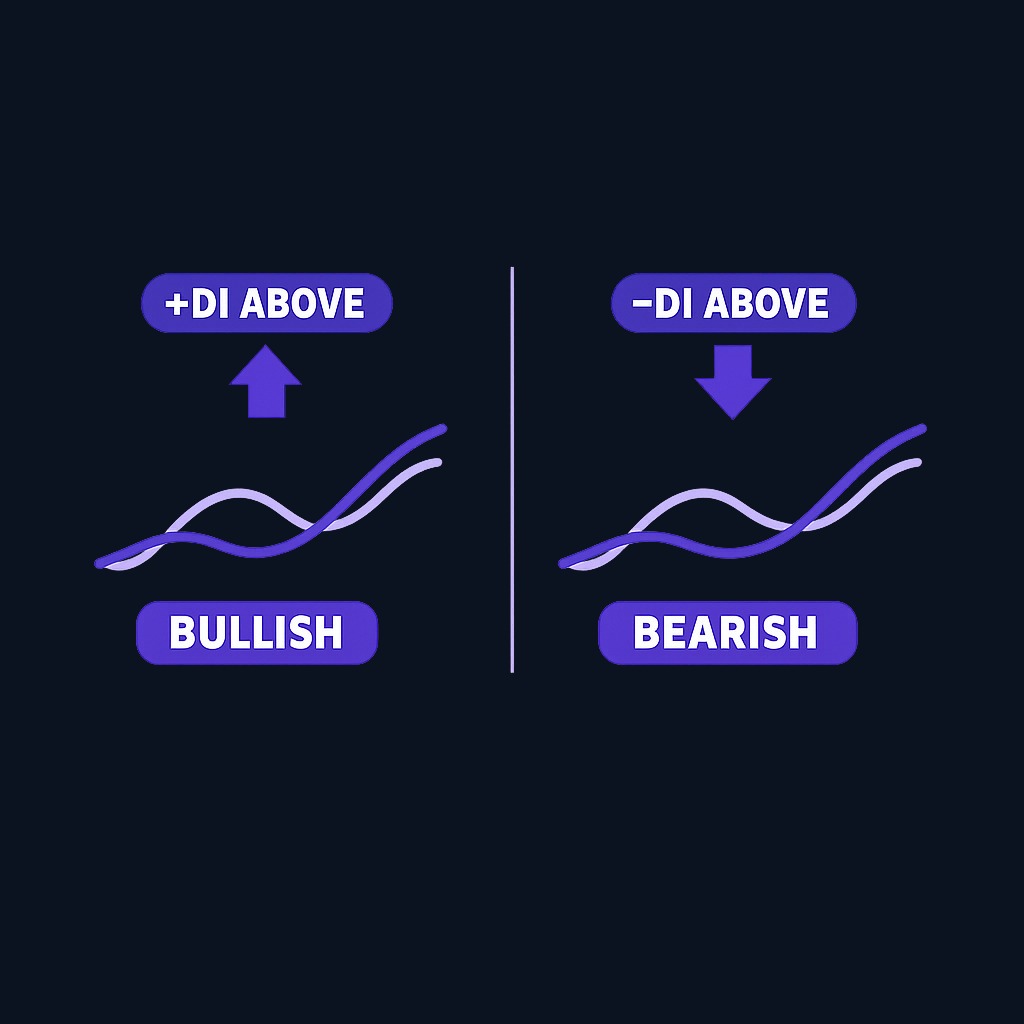
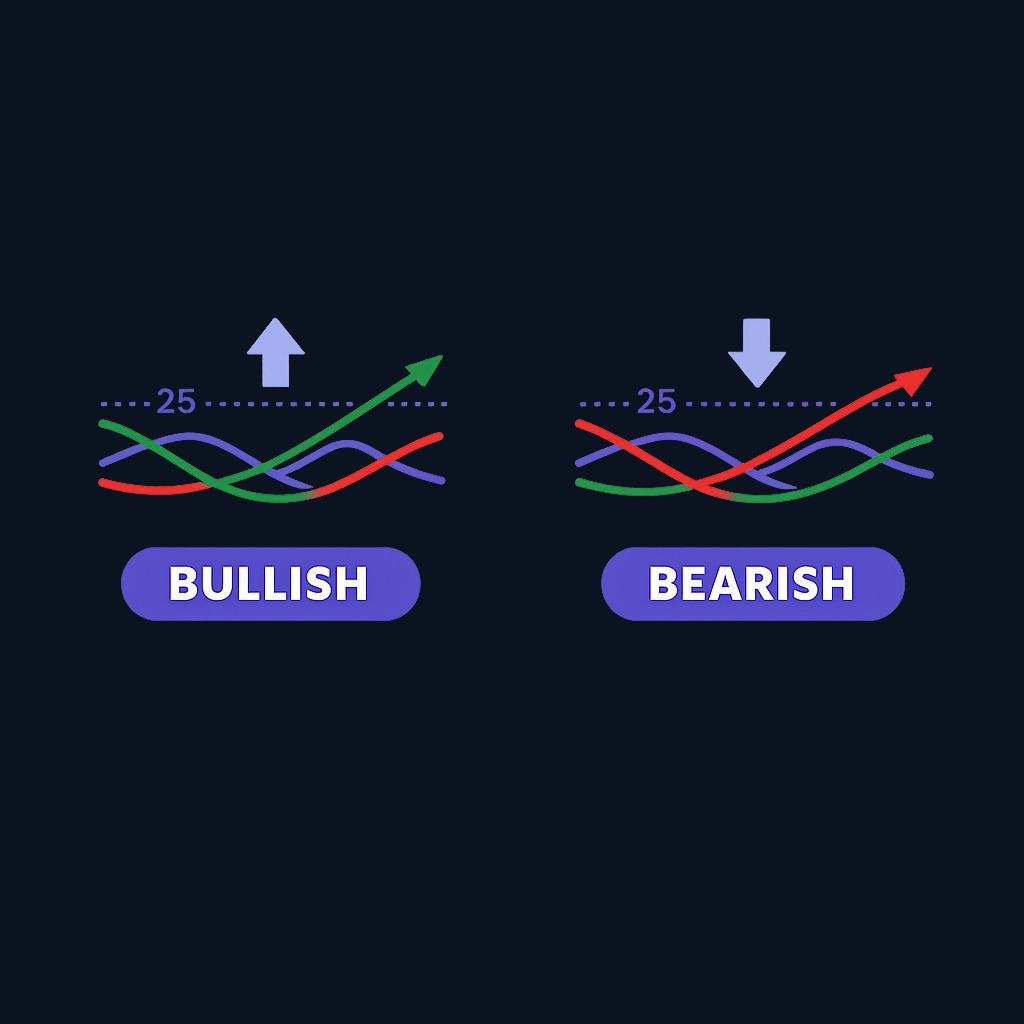
That is why the ADX line alone can never tell you to buy or sell: you know a trend is powerful but not which way to lean. Direction comes from the two indicators beside it. When the +DI is above the −DI, buyers have the upper hand and the trend leans bullish; when the −DI is above the +DI, the lean is bearish. Blur those two ideas together and almost every ADX mistake follows.
The payoff of that separation is discipline. Because ADX is both lagging and non-directional, using it correctly forces you to combine it with other information: direction from the DI lines, context from price, confirmation from patterns or candles. That habit of not acting on a single number is worth more than the indicator itself.
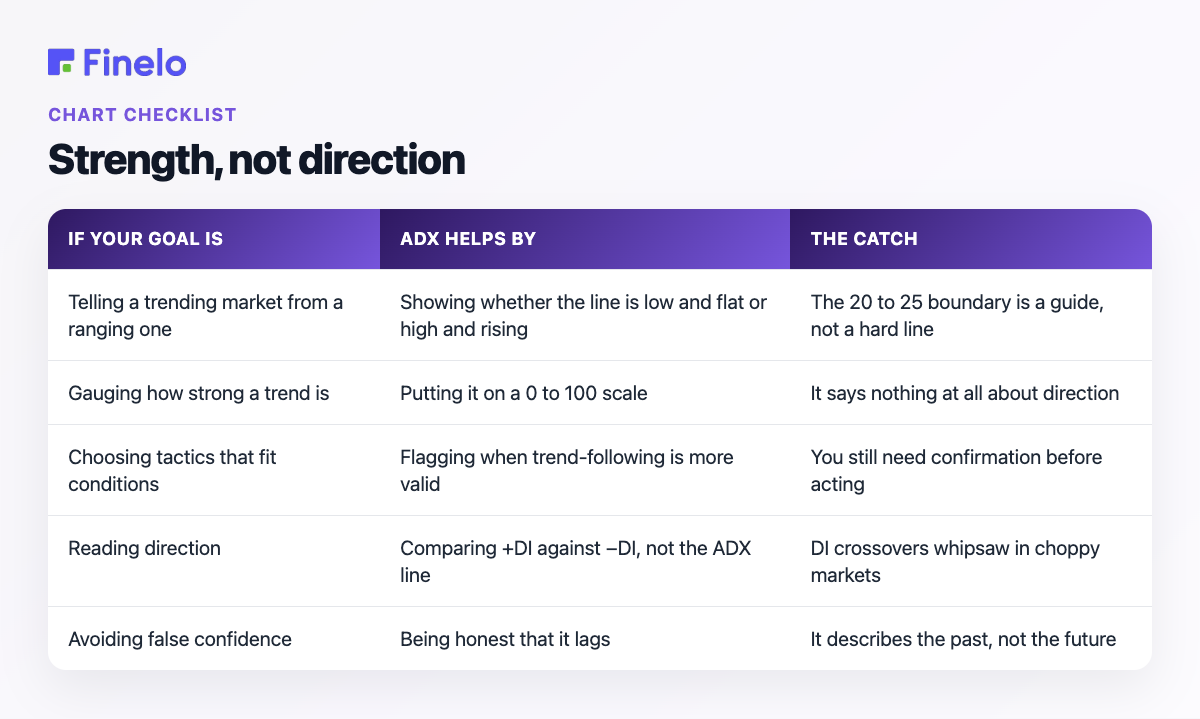
| If your goal is | ADX helps by | The catch |
|---|---|---|
| Telling a trending market from a ranging one | Showing whether the line is low and flat or high and rising | The 20 to 25 boundary is a guide, not a hard line |
| Gauging how strong a trend is | Putting it on a 0 to 100 scale | It says nothing at all about direction |
| Choosing tactics that fit conditions | Flagging when trend-following is more valid | You still need confirmation before acting |
| Reading direction | Comparing +DI against −DI, not the ADX line | DI crossovers whipsaw in choppy markets |
| Avoiding false confidence | Being honest that it lags | It describes the past, not the future |
The three lines: ADX, +DI, and −DI
ADX is one part of a three-line system Wilder called the Directional Movement System, which is why the +DI and −DI pair is often labeled "DMI," for Directional Movement Index: the same two lines under a different name. The +DI measures upward directional movement, the −DI measures downward directional movement, and the ADX line is derived from the gap between them, a smoothed measure of how decisively one is beating the other. That is why it reads as strength rather than direction.
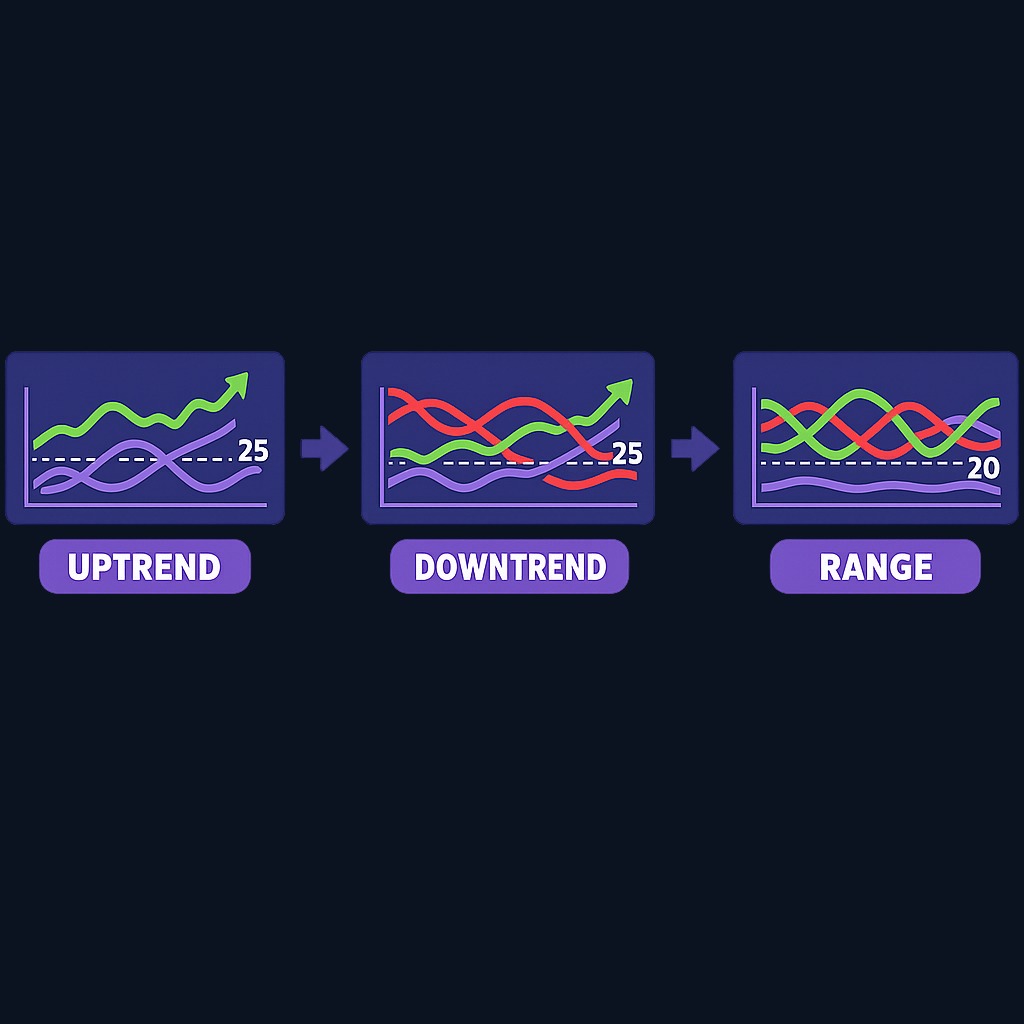
In practice you read them together: the DI lines answer "which way," the ADX answers "how much conviction is behind it." The classic strong-uptrend picture is +DI above −DI with the ADX rising above 25; the mirror image, −DI above +DI with a rising ADX, is a strong downtrend. When the DI lines are tangled and the ADX is low and flat, there is no real trend, whatever the chart seems to suggest at a glance.
Reading the ADX scale
ADX runs from 0 to 100, but you rarely see the extremes: many markets spend most of their time in the lower half, and sustained readings above 60 are uncommon. What matters is less the exact number than the zone it sits in and whether the line is rising or falling. The table below shows the classic Wilder scale.
| ADX reading | What it suggests |
|---|---|
| 0 to 20 (some use 25) | Weak or absent trend; ranging, choppy market |
| 20 to 25 | Gray zone where a trend may be starting |
| 25 to 50 | Strong trend |
| 50 to 75 | Very strong trend |
| 75 to 100 | Extremely strong trend, rarely seen |
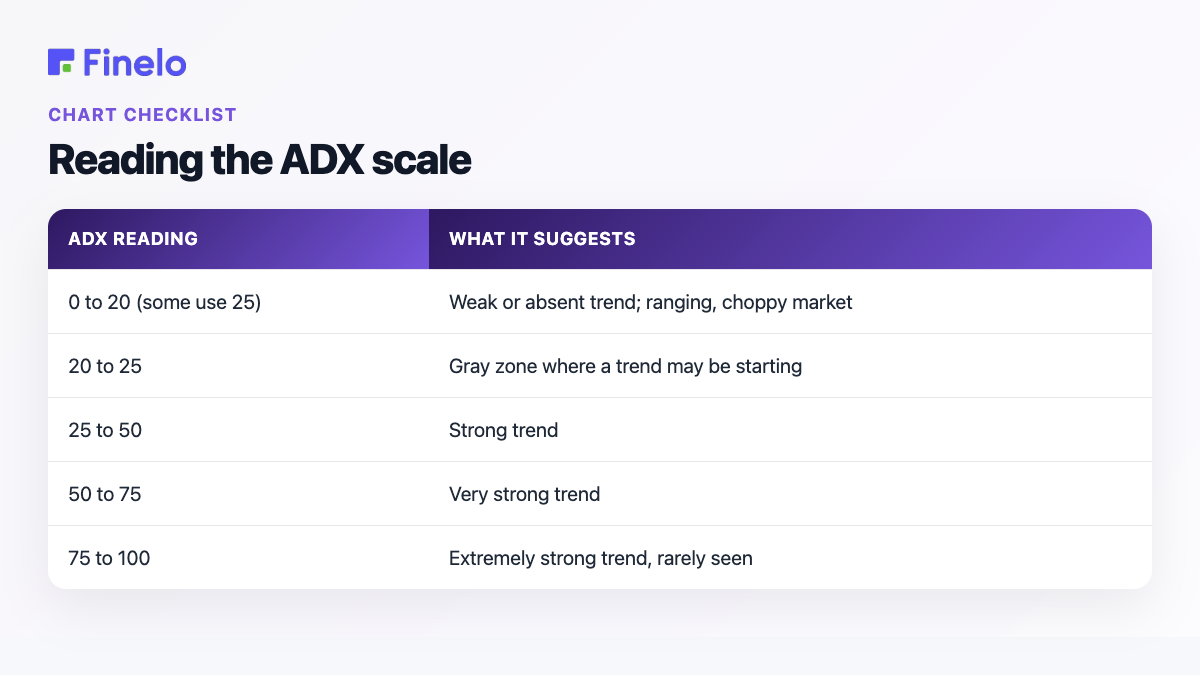
Two practical notes sit underneath that table. First, the lower boundary is debated: Wilder used 25 for a strong trend, many traders treat 20 as the line between trending and ranging, and some guides call anything above 40 "extreme." There is no official cutoff, so treat these as reference points, not rules, and expect the 20-to-25 zone to be ambiguous. Second, the slope matters as much as the level: a rising ADX means the current trend is strengthening, a falling ADX means it is losing steam, even when the reading is still fairly high.
A falling ADX from a high level is still a fading trend, not a strong one.
A worked example
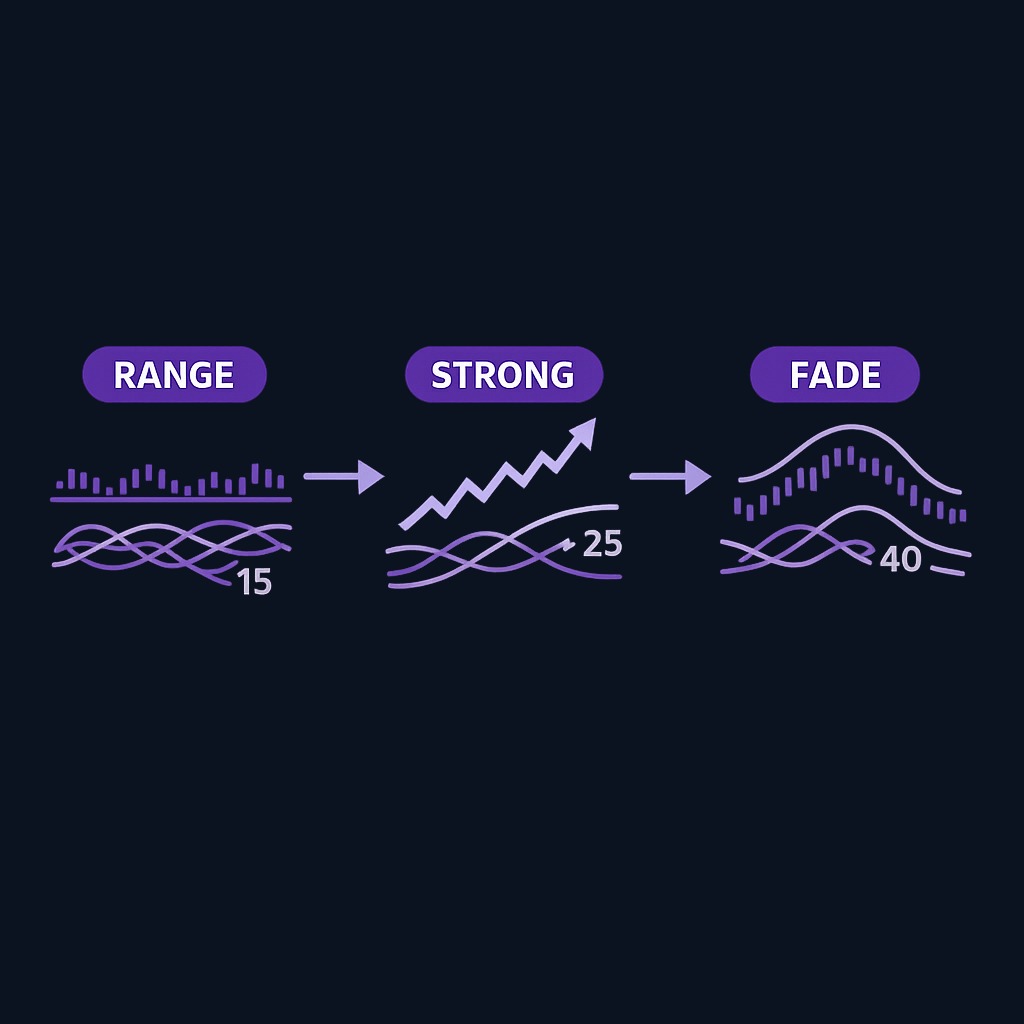
Here is an illustrative scenario: Say an asset drifts sideways with ADX around 15 and the +DI and −DI tangled together: no trend worth trading. Price then breaks higher, the +DI crosses above the −DI, and ADX climbs through 20 and past 25. That combination — +DI above −DI with a rising ADX above 25 — is the classic strong-uptrend reading. Later ADX peaks near 40 and rolls over while price stalls: the trend is not reversing, but its strength is fading, a cue to manage risk rather than chase the move.
How ADX is calculated (the short version)
You never need to compute ADX by hand, since every platform does it for you, but a rough feel for the math helps you trust the line. The default is 14 periods. The platform measures positive and negative directional movement by comparing each period's high and low with the previous one, then divides those smoothed values by the Average True Range (ATR) to produce the +DI and −DI. The difference between the two, relative to their sum, gives an intermediate value called the DX. The ADX is then a smoothed average of that DX using Wilder's method.
The takeaway is not the formula but why ADX lags: it is a smoothed average sitting on already-smoothed inputs, so it needs a stretch of data before it settles and reacts slowly by design. That sluggishness is the price of a steadier reading, and it is why ADX is poor at calling exact turning points. If you want early warning, this is the wrong tool.
Practice trading with Finelo
Practice in a simulator, learn with bite-sized lessons, and build confidence before risking real money.
How traders use ADX
The most common use is as a trend-versus-range filter. When ADX is low and flat, many traders step back from trend-following tactics, because there is no trend to follow and those tactics tend to fail in a range. When ADX is high and rising, trend strategies are considered more reliable. Used this way, ADX is less a signal than a permission slip: it tells you which style of tactic fits current conditions, not whether to trade.
A second use is confirmation. If price breaks out of a range or a chart pattern, a rising ADX can add weight to the idea that the breakout has real force rather than being a false move. The ADX still says nothing about direction, which you read from price and the DI lines, but it can support the case that a move has strength behind it. This pairs naturally with the way breakouts and chart patterns are read.
A third use is watching the DI crossovers directly: the +DI crossing above the −DI as a bullish cue, the −DI crossing above the +DI as a bearish one, usually taken seriously only when ADX is above 20 to 25. This is where the most caution is needed, because these crossovers are frequent and many of them lead nowhere. ADX also works well beside a momentum tool like RSI and beside candlestick signals; the read is stronger when several independent clues point the same way.
| Signal | What it's said to suggest | What it needs before you act |
|---|---|---|
| ADX low and flat (below 20) | Weak or no trend; ranging market | A shift to rising ADX before trusting trend tactics |
| ADX rising above 25 | A strong trend is underway | Direction read from the DI lines, plus price context |
| +DI crosses above −DI | Bullish directional lean | ADX above 20 to 25 and confirmation from price |
| −DI crosses above +DI | Bearish directional lean | ADX above 20 to 25 and confirmation from price |
| ADX falling from a high | Trend is weakening | Not read as a new trend in the other direction |
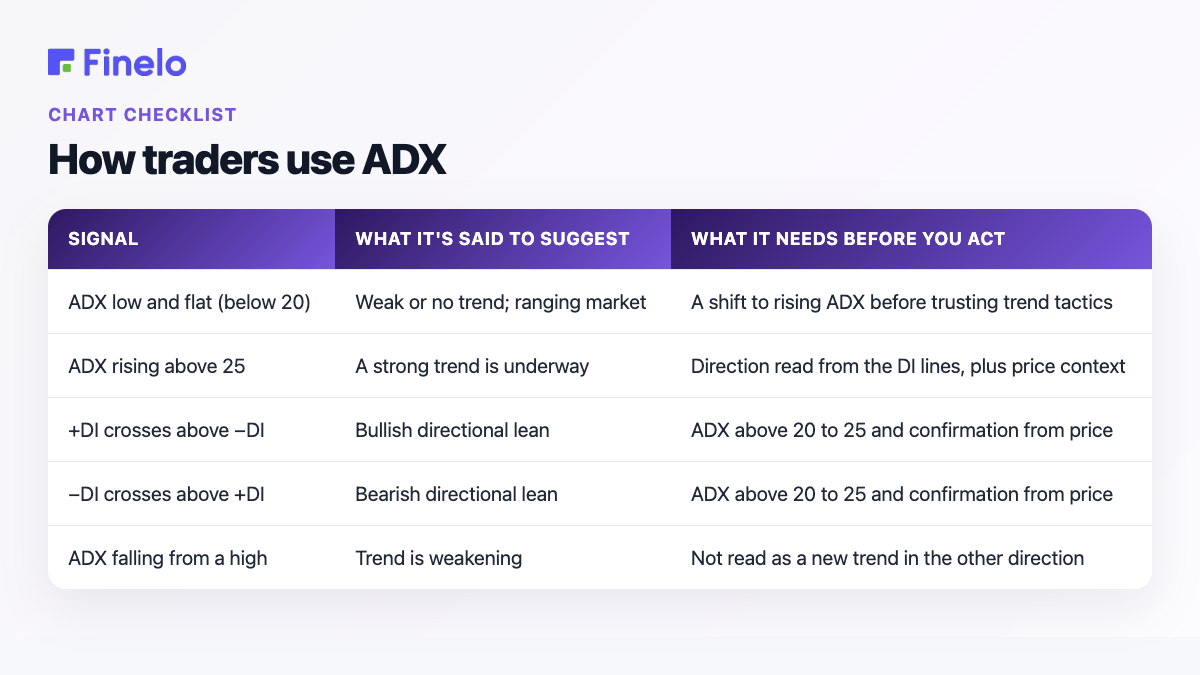
A crossover is a prompt to check, not an instruction to act.
Limitations and cautions
The honest headline is that ADX lags. Because it is heavily smoothed, it confirms trends only after they are underway and fades only after they have already weakened. It is not built to catch tops and bottoms, and asking it to do so is asking the wrong question of it.
It is also prone to whipsaws in ranging markets. When price chops sideways, the DI lines cross back and forth and produce a stream of signals that mostly fail. This is exactly where beginners lose money trading crossovers mechanically, and why the trend-versus-range filter matters so much. ADX also gives no price target and no direction on its own, so it can never be a complete system by itself; most experienced users treat it as a supplement to price action rather than the main decision-maker. Any strategy promising a mechanical ADX system with a high win rate deserves skepticism, and any reliability figure should arrive with a defined test behind it.
ADX settings, strategy, and ADX vs RSI
The default of 14 periods is a sensible place to start. Shorter settings make ADX more reactive but noisier; longer settings smooth it further and add lag. Because changing the setting changes every reading you have trained your eye to interpret, beginners are usually better served learning the default before experimenting.
On "best strategy," the most useful thing to internalize is that ADX earns its keep as a filter and a confirmation tool, not as a stand-alone system. The whole of a sound approach fits in one sentence: check trend strength before applying trend tactics, and require confirmation before acting on any DI crossover.
On ADX versus RSI, the two are not competitors, because they answer different questions. ADX measures trend strength. RSI is a momentum oscillator that flags overbought and oversold conditions and can show divergence. A common pairing uses ADX to judge whether a trend is strong enough to be worth trading and RSI to help time entries within it. If you want the momentum side of the picture, see Finelo's guide to RSI divergence.
ADX confirms trends. It does not predict them.
Common mistakes to avoid
The biggest mistake is reading ADX as direction. A high ADX in a downtrend does not mean "buy"; it means the downtrend is strong. Direction lives in the DI lines and never in the ADX line, and confusing the two is the error almost every beginner makes at least once.
The second is trading DI crossovers blindly. They are frequent and often false, especially when ADX is low and the market is ranging. Waiting for ADX to confirm strength, and for price to agree, filters out many of the worst signals before they cost you anything.
The third is ignoring the regime: applying trend-following tactics when ADX says there is no trend is a recipe for repeated small losses. The fourth is expecting precision from a lagging tool, using a deliberately slow indicator to pinpoint exact tops and bottoms. Pair it with sound risk management and it becomes a useful lens; treat it as a crystal ball and it will let you down.
Check trend strength before you apply trend tactics.
Practice before you risk anything
Reading about ADX and reading it fluently on a live chart under time pressure are different skills, and only the second matters. The gap closes with repetition, not more reading. Start by watching the indicator rather than trading it: pull up historical charts and observe how ADX behaves when a market is trending versus ranging, and how the DI lines sit during clear up and down moves. Train your eye to read strength and direction as two separate questions before you attach a decision to either.
Inside the Finelo app, you can study indicators and practice buy, sell, and hold decisions on real market data with virtual funds. There are no deposits, no withdrawals, and no broker connection — it is a closed practice loop, so the only cost of a wrong read is the lesson. To go deeper, Finelo publishes educational material for beginners, and you can start with an introduction to trading or read up on swing trading for the trend-trading context ADX fits into. You can also check Finelo reviews, the About Finelo page, or the Finelo support center.
Final decisions are always yours. An indicator is a lens for thinking more clearly, not a substitute for judgment.
Finelo is an educational product. The simulator uses virtual funds and real market data and is not a brokerage. Final trading and investing decisions are yours and are made through your own brokerage account when you choose to act. Not financial advice.
Frequently asked questions
Does ADX show trend direction?
No, ADX measures only strength. To read direction you look at the directional indicators: when the +DI is above the −DI the trend leans bullish, and when the −DI is above the +DI it leans bearish. Keep it simple: ADX is how strong, the DI lines are which way.
What is a good ADX value?
There is no single "good" value, but common reference points help. Below 20 (some use 25) suggests a weak trend; above 25 a strong one; above 50 a very strong one. Readings above 60 are uncommon. Whether the ADX line is rising or falling matters as much as the level.
What do ADX 20 and 25 mean?
They are the commonly used boundaries between a ranging market and a trending one. Wilder's original work treats 25 as the threshold for a strong trend, while many traders use 20 as the line where a trend begins to emerge. Neither is an official rule; the zone between them is genuinely ambiguous.
What are the best ADX settings?
The default is 14 periods, and it is the best starting point for beginners. Shorter settings react faster but generate more false signals; longer settings are smoother but lag more. Because changing the setting changes every reading you have learned to interpret, it is wise to learn the default thoroughly before adjusting it.
Is ADX better than RSI?
Neither is better; they measure different things. ADX gauges trend strength, while RSI is a momentum oscillator that highlights overbought and oversold conditions. Many traders use them together — ADX to judge whether a trend is strong enough to act on and RSI to help with timing.
Is the ADX indicator reliable?
It reliably does what it is built to do — describe trend strength — but it is a lagging indicator that confirms trends late and produces false signals in choppy, range-bound markets. It gives no direction and no price target on its own, so it works best as a filter alongside other analysis.
ADXtechnical indicatorstrend strengthDMIchart analysisbeginner
Practice trading with Finelo
Practice in a simulator, learn with bite-sized lessons, and build confidence before risking real money.
About the author
Finelo Team
The Finelo Team creates practical investing and trading education designed to help beginners learn faster with structured challenges, simulator practice, and bite-sized lessons.
Keep reading — Related articles

Chart Analysis
Symmetrical Triangle Pattern: Identification, Breakouts, and Limits
A symmetrical triangle forms when lower highs and higher lows narrow the trading range. Learn to identify it, assess breakout confirmation, and recognize false signals.
Finelo Team

Chart Analysis
Hanging Man Candlestick: The Hammer’s Bearish Twin Explained
A hanging man is a bearish warning candle after an uptrend. Learn how its context differs from a hammer, why confirmation matters, and when the warning fails.
Finelo Team

Chart Analysis
Evening Star Pattern: How to Identify a Three-Candle Reversal
The evening star is a three-candle bearish reversal pattern that forms after an uptrend. Learn its anatomy, confirmation signals, and limitations before interpreting it on a chart.
Finelo Team


