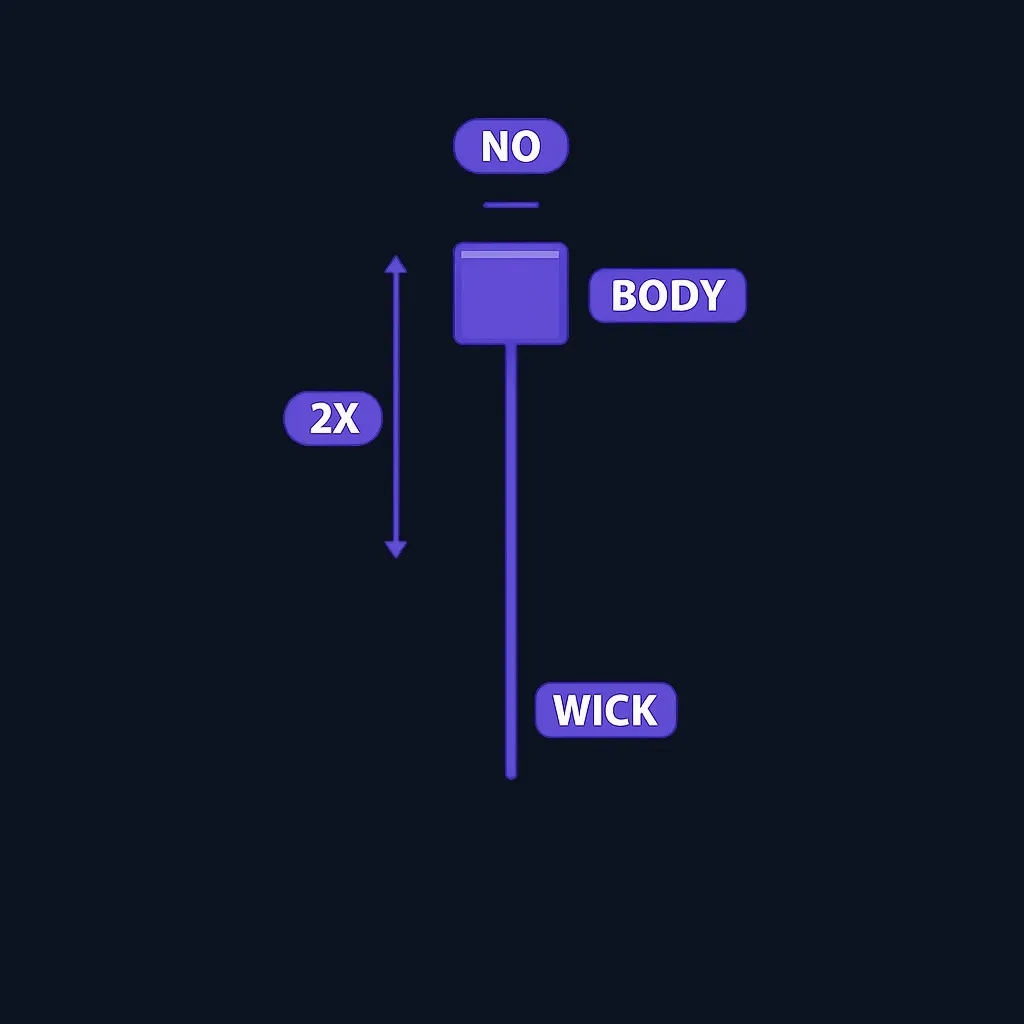
The hanging man is a single-candle bearish warning that forms after an uptrend. It has a small real body near the top of its range, a long lower wick at least about twice the body's length, and little or no upper wick.
Hanging Man Candlestick: The Hammer’s Bearish Twin Explained

A hanging man is a bearish warning candle after an uptrend. Learn how its context differs from a hammer, why confirmation matters, and when the warning fails.
9 min read
Practice trading with Finelo
Practice in a simulator, learn with bite-sized lessons, and build confidence before risking real money.
Want to learn more?
Practice in a simulator, learn with bite-sized lessons, and build confidence before risking real money.
Explore FineloExplore Finelo's 28-day challenges
Turn learning into a daily habit with guided challenge paths.
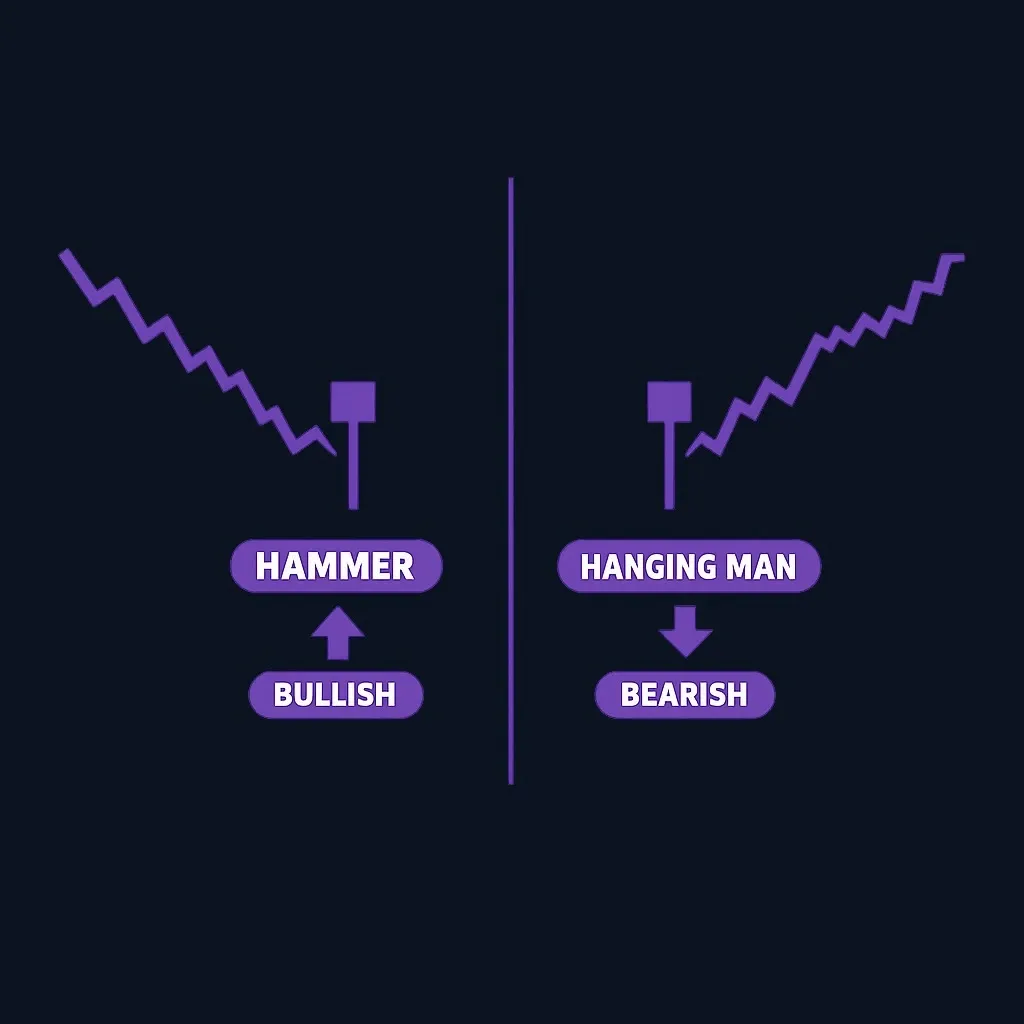
Here is the part that trips up almost every beginner: the hanging man is the exact same shape as the hammer candlestick, which is a bullish reversal signal. The only difference is where it appears. After a downtrend, this candle is a hammer and hints that buyers are stepping in.
After an uptrend, the identical candle is a hanging man and warns that sellers just attacked in force for the first time. And like every single-candle signal, it is a warning, not a verdict: it needs confirmation from the next candle before it says anything reliable.
New to candle anatomy? Start with how to read candlesticks, because this guide assumes you can already tell bodies from wicks.
The same drawing can mean opposite things, which is why disciplined traders read location before they read shape.
Anatomy of the hanging man
A textbook hanging man has three features, and the proportions matter more than perfection:
- A small real body near the top of the range. The open and the close sit close together, high in the candle. The body can be red or green.
- A long lower wick, at least about twice the body's length. This is the defining feature: price fell hard during the session before recovering. Nison, who brought Japanese candlesticks to Western traders, treated the roughly twice-the-body proportion as the mark of a proper umbrella line, and most references land between two and three times.
- Little or no upper wick. Price never got meaningfully above the open and close zone.
Does the color matter? A little. A red body, closing below its open, adds a touch of weakness. But a green hanging man still counts, because the signal lives in the long lower wick and the uptrend context, not in the body color. The name comes from the silhouette: a small head with a long line dangling beneath it.
Same shape, opposite meaning: hanging man vs hammer
This is the heart of the article, because it is the heart of the confusion. Put two identical candles side by side, small body up top and long lower wick, and their meanings can be opposites.
After a downtrend, it is a hammer. Sellers had been in control for days. Then, in one session, they pushed price down again, and buyers bought the entire dip, closing near the highs. The long lower wick is a victory for the buyers: they defended lower prices with real money. That is why the hammer reads bullish.
After an uptrend, it is a hanging man. Buyers had been in control. Price opened near the highs, and then, for the first time in the trend, sellers hit the market hard enough to drive price sharply lower during the session. Buyers pulled it back by the close, so the candle looks fine. But the wick tells the truth: supply showed up in size at these prices. The recovery hides the warning rather than removing it.
The difference is entirely in what came before, which is why the first item on any hanging man checklist is a genuine, sustained uptrend. In a sideways market, this shape is just noise.
For the full bullish side, see Finelo's hammer candlestick guide.
The psychology, session by session
Walk through the session that prints a hanging man. The market opens near its recent highs, and the uptrend's optimism carries over. Then selling begins, not a drift but real pressure: longs take profits, early skeptics start shorting, and price drops well below the open. For a while, the trend looks broken. Then the dip-buyers arrive, as they have all trend long, and price climbs back to close near the open. On the surface it is business as usual, a tiny body near the highs.
But something changed. For the first time in the trend, sellers were able to move the market violently before buyers pulled it back. The hanging man records that first crack in the trend's structure.
A recovery that costs the bulls this much selling pressure is not the same as a recovery that came easy.
The four-way matrix: hammer, hanging man, inverted hammer, shooting star
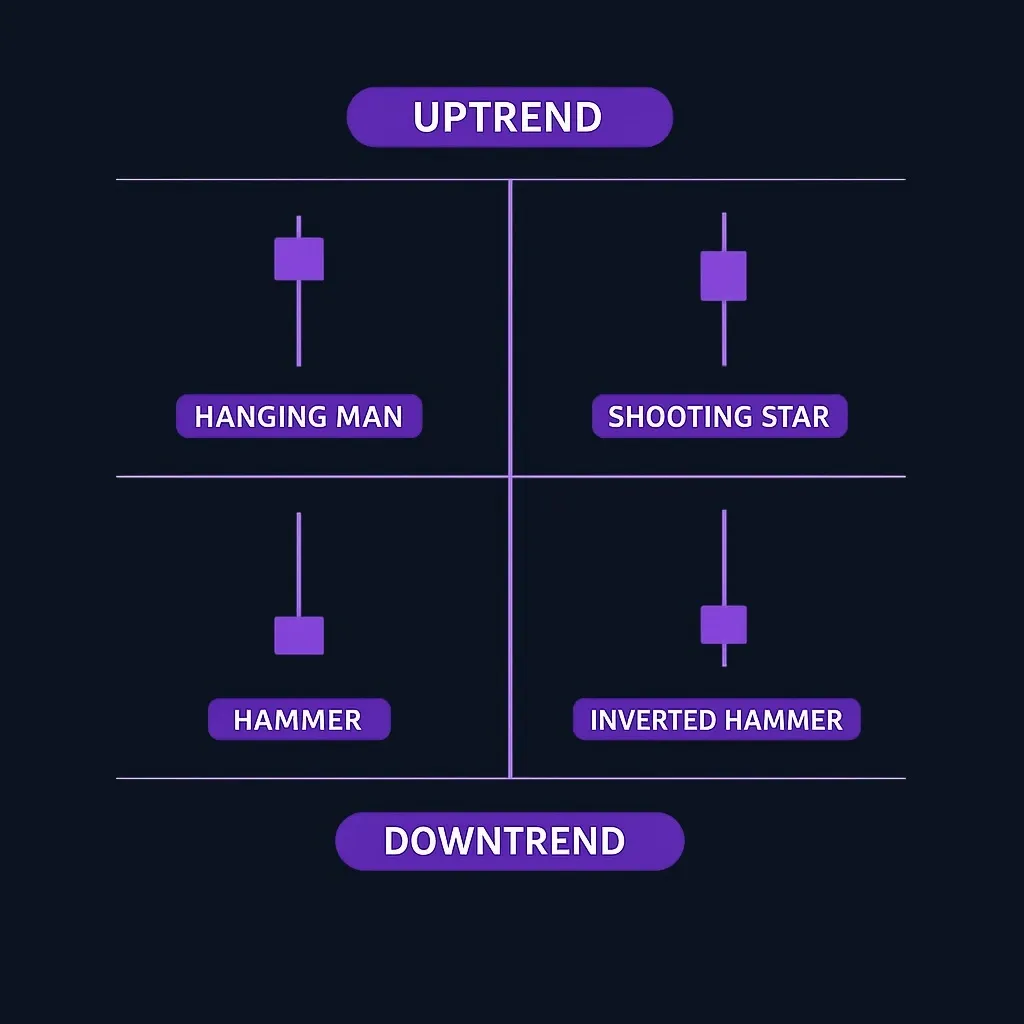
Four classic single-candle reversal patterns are really just two shapes in two contexts. This one table untangles all of them:
| After a downtrend | After an uptrend | |
|---|---|---|
| Long lower wick, small body at top | Hammer: bullish reversal signal (guide) | Hanging man: bearish warning (this article) |
| Long upper wick, small body at bottom | Inverted hammer: bullish reversal signal | Shooting star: bearish reversal signal (guide) |
Two things are missing from the table. First, shape alone tells you nothing, because every one of these candles needs its trend context to mean anything. Second, a common beginner question answers itself: there is no such pattern as an inverted hanging man. The upper-wick candle at the top of an uptrend already has a name, the shooting star. For where these four sit in the broader family, keep the candlestick patterns cheat sheet handy.
Confirmation and invalidation
Because the hanging man closes high in its range, near its open, it is one of the least self-sufficient patterns in candlestick analysis. Traders wait for the market to confirm or deny the warning before treating it as anything more.
Confirmation strengthens the case when:
- The next candle closes below the hanging man's body, and many traders want a close below its low.
- Volume was elevated on the hanging man or on the confirmation candle, showing the selling was real.
- The pattern printed at a known resistance level, or with momentum stretched, such as an overbought RSI reading.
Invalidation kills it when:
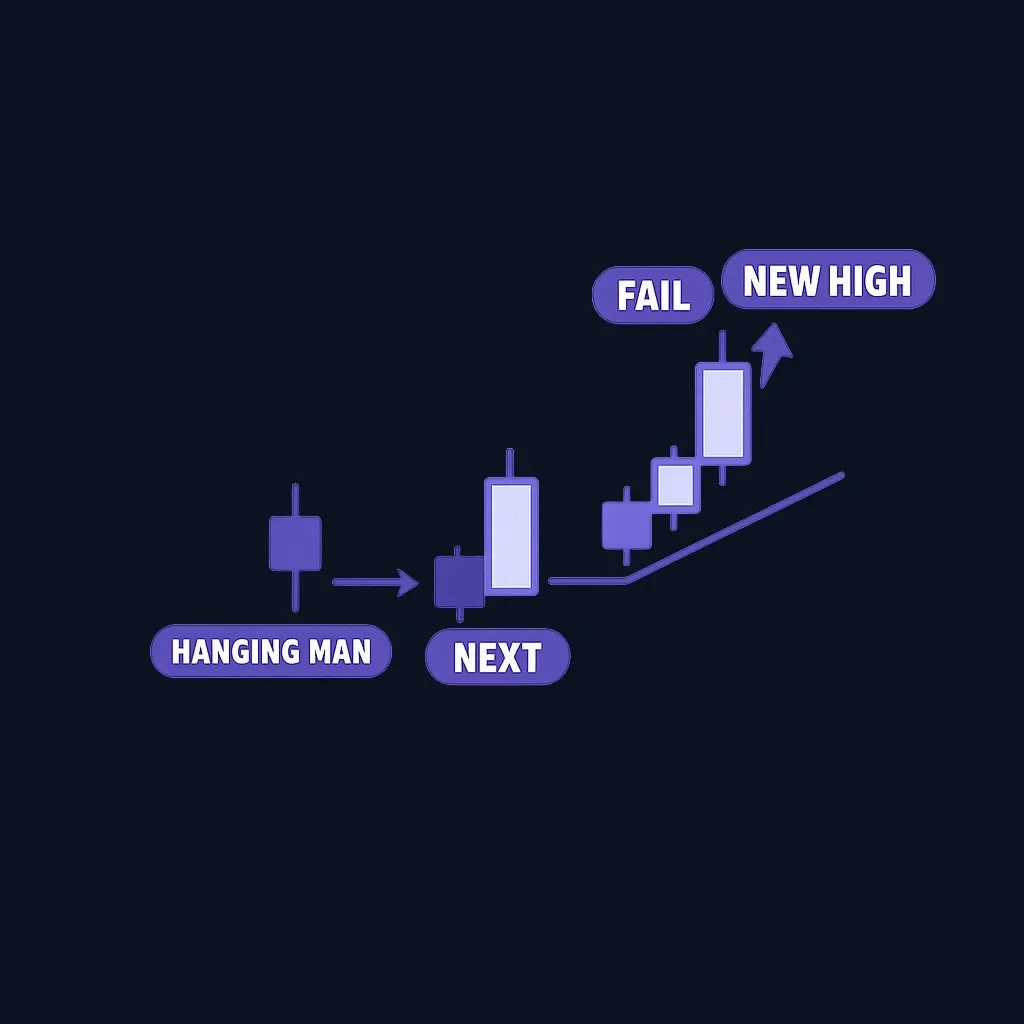
- The next candle closes at new highs. The uptrend absorbed the selling, and the warning failed.
- The uptrend was not really there. A hanging man shape inside a range carries no signal.
In practice, traders who act on a confirmed hanging man treat exits and stops as a risk management problem, typically framing risk above the pattern's high, but that is the trade's discipline, not the pattern's promise.
One note for 24-hour markets: gap-based confirmation, like a gap-down open, is mostly a stock-chart phenomenon, while in forex and crypto confirmation rests on the close and on volume instead. Finelo's candlestick reversal patterns in forex guide covers the differences.
Treat the hanging man as a question the next candle answers, not as an answer in itself.
Practice trading with Finelo
Practice in a simulator, learn with bite-sized lessons, and build confidence before risking real money.
A worked example, and a failed one
The textbook case. A stock has climbed steadily for three weeks on the daily chart. On Tuesday it opens near its highs, plunges midday on heavy volume, then recovers to close just under the open, leaving a red hanging man with a lower wick about three times its body. Wednesday opens weak and closes below Tuesday's body. The warning is confirmed: the sellers pressed their advantage, first the wick, then the follow-through. These figures are illustrative, not a prediction.
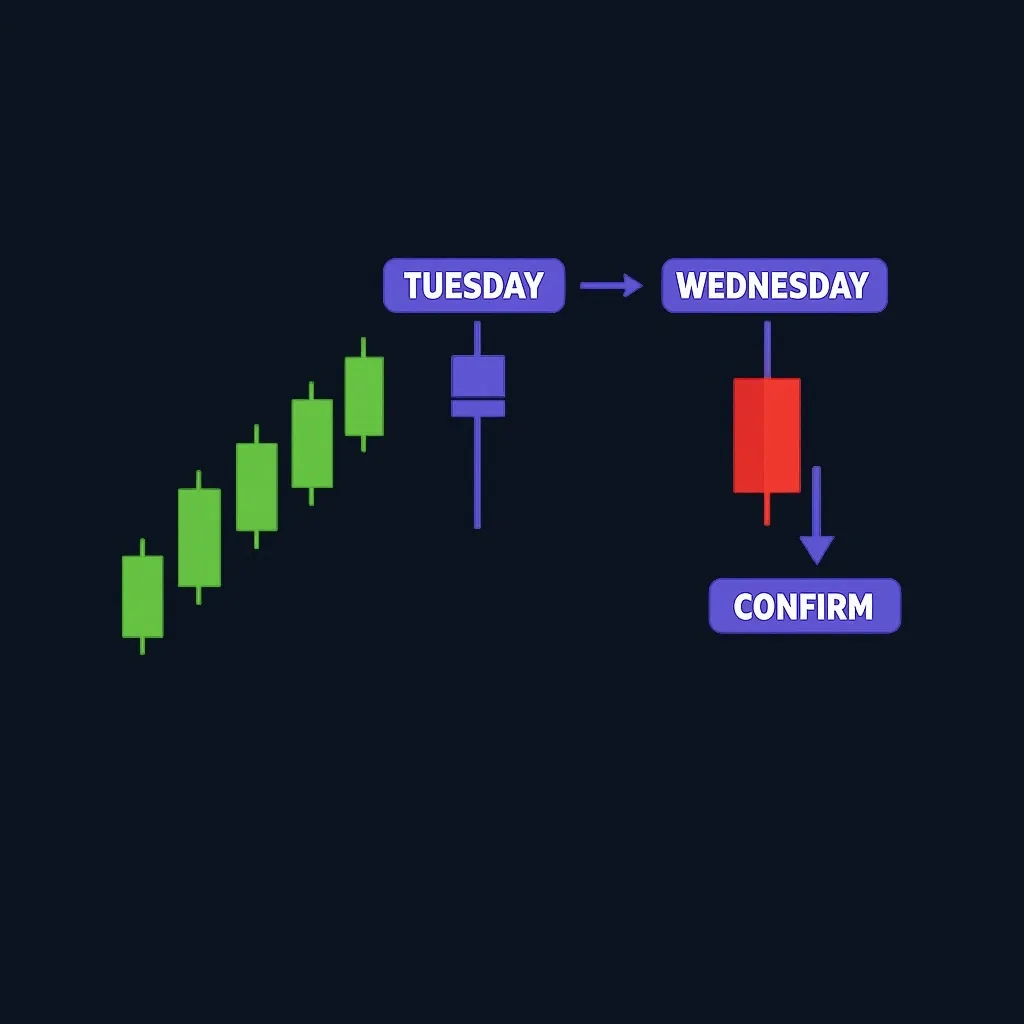
The failure case. Same setup, but on Wednesday buyers show up again and the candle closes at a new high. The hanging man is invalidated, and that is information too: the dip was bought again, and the uptrend deserves the benefit of the doubt. Half of learning candlestick analysis is learning what a dead signal looks like, and a pattern that fails cleanly is telling you the trend is stronger than it looked.
Limitations: an honest reliability check
The hanging man deserves more honesty than it usually gets. Three things are true at once.
Its standalone record is weak. Backtests published across the web disagree wildly, and some even find price more likely to keep rising after a hanging man forms than to fall. We will not quote precise win rates, because no dependable universal number exists: results swing with the market, the timeframe, how strictly you define the candle, and whether you demand confirmation.
It appears constantly. Small-body, long-lower-wick candles are common, and most of them mean nothing without a trend behind them and a confirmation candle after them.
Timeframe matters. Most educators find the pattern more meaningful on daily and 4-hour charts than on fast intraday charts, where long wicks are routine.
None of this makes the hanging man useless. It makes it what it actually is: a well-defined warning that tells you where to pay attention, and lets the next candle do the deciding.
A pattern that shows up everywhere is worthless until a filter throws most of them away.
Practice before you risk anything
If you are still learning this pattern, do not start on a live chart with real money. Collect examples first: warnings that confirmed, hanging man shapes that failed, and long lower wicks in sideways markets that meant nothing. Mark the trend, label the body and the wick, note any resistance overhead, and write down what confirmation would have looked like before you knew the outcome. That habit is what separates a real warning from chart noise.
Inside the Finelo app, you can study candlestick structure and practice buy, sell, and hold decisions on real market data with virtual funds. There are no deposits, no withdrawals, and no broker connection, it is a closed practice loop, so the only cost of a wrong read is the lesson.
Where to learn more
The hanging man makes the most sense studied against its shape-twin, so read Finelo's hammer candlestick guide back-to-back with this one and the context rule will lock in for good. Then complete the tops family with the shooting star candlestick, see the wider landscape in the candlestick patterns cheat sheet, and sharpen the trend-identification step with how to read stock charts for beginners.
Candlestick patterns are widely taught, but that does not make them certain, and a good source explains what a signal represents and where it fails. Finelo publishes educational material for beginners, and you can also check Finelo reviews, the About Finelo page, or the Finelo support center.
Educational note: This article is for educational purposes only and does not constitute financial, investment, legal, or tax advice. Finelo is an educational product, not a brokerage or adviser. Simulator practice uses virtual funds. Investing and trading involve risk, including possible loss of principal; verify account-specific requirements with your broker.
Sources and Further Verification
Frequently asked questions
Is the hanging man candlestick bullish or bearish?
Bearish, but only as a warning and only after an uptrend. The long lower wick suggests sellers attacked in force for the first time in the trend. It needs a bearish confirmation candle before traders treat it as a reversal. The identical shape after a downtrend is the bullish hammer.
What is the difference between a hanging man and a hammer?
Shape: none. Both have a small body near the top and a long lower wick. Context: everything. The hammer forms after a downtrend and reads bullish, because buyers defended the lows. The hanging man forms after an uptrend and reads bearish, because sellers struck back hard for the first time.
Does it matter if the hanging man is red or green?
Slightly. A red body, which closes below its open, adds a little bearish weight. But the real signal comes from the long lower wick and the uptrend context, so a green hanging man is still a valid warning. Treat color as a supporting detail, not the main test.
What happens after a hanging man pattern?
One of two things. Either the warning confirms, with the next candle closing below the body and a pullback developing, or it fails, with price pushing to new highs. Both outcomes are useful, which is why traders wait for that next candle instead of acting alone.
Is there an inverted hanging man?
No. The candle with a long upper wick at the top of an uptrend is the shooting star, and at the bottom of a downtrend it is the inverted hammer. Those four patterns are really two shapes in two contexts, as the matrix above shows.
Which timeframes does the hanging man work on?
It can appear on any timeframe, but it is generally considered more meaningful on daily and 4-hour charts, where each candle summarizes substantial trading. On very short intraday charts, long wicks are so common that the pattern mostly generates noise.
Hanging Man CandlestickChart AnalysisBeginner
Practice trading with Finelo
Practice in a simulator, learn with bite-sized lessons, and build confidence before risking real money.
About the author
Finelo Team
The Finelo Team creates practical investing and trading education designed to help beginners learn faster with structured challenges, simulator practice, and bite-sized lessons.
Keep reading — Related articles

Chart Analysis
Symmetrical Triangle Pattern: Identification, Breakouts, and Limits
A symmetrical triangle forms when lower highs and higher lows narrow the trading range. Learn to identify it, assess breakout confirmation, and recognize false signals.
Finelo Team

Chart Analysis
Evening Star Pattern: How to Identify a Three-Candle Reversal
The evening star is a three-candle bearish reversal pattern that forms after an uptrend. Learn its anatomy, confirmation signals, and limitations before interpreting it on a chart.
Finelo Team

Chart Analysis
SMT Divergence Trading: Learn the Concept & Risk Controls
In trading, SMT stands for Smart Money Technique, and it is almost always discussed as SMT divergence. It is a concept from the ICT (Inner Circle Trader) framework that describes one specific moment: two markets that normally move together stop confirming each other.
Finelo Team


