The head and shoulders pattern is a chart formation with three peaks - a higher middle peak (the head) between two lower peaks (the shoulders) - that many technical traders read as a signal that an uptrend may be reversing into a downtrend. The signal is considered triggered only when price closes below the neckline, the line connecting the two troughs between the peaks. This guide is for traders and investing learners who want to identify the pattern correctly, understand the volume behavior behind it, and avoid the false signals that trap beginners. Read the identification rules first, then practice spotting the pattern on historical charts before risking money.
The Head and Shoulders Pattern: Identification, Trading Strategies, and Insights

The head and shoulders pattern is a chart formation with three peaks - a higher middle peak (the head) between two lower peaks (the shoulders) - that many technical traders read as a signal that an uptrend may be…
8 min read
Practice trading with Finelo
Practice in a simulator, learn with bite-sized lessons, and build confidence before risking real money.
Want to learn more?
Practice in a simulator, learn with bite-sized lessons, and build confidence before risking real money.
Explore FineloExplore Finelo's 28-day challenges
Turn learning into a daily habit with guided challenge paths.
Components of the head and shoulders pattern
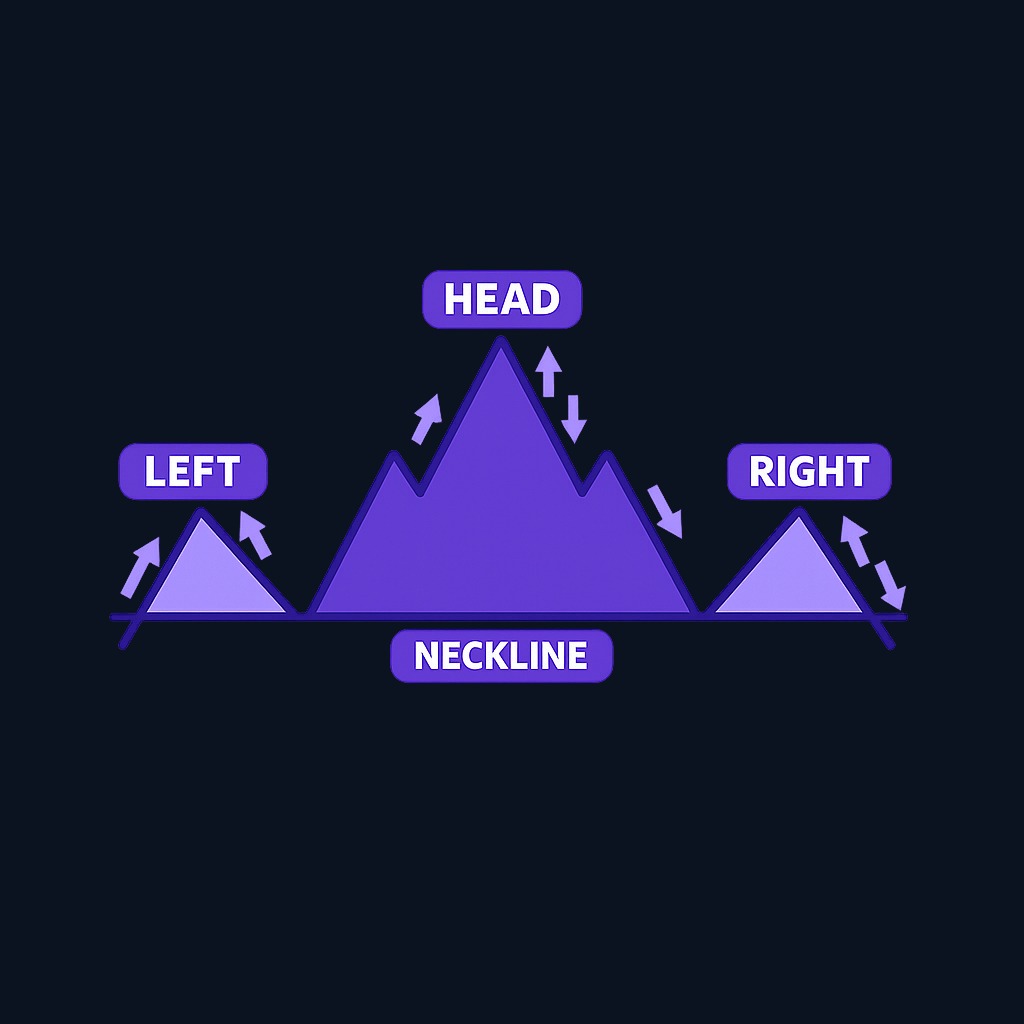
Four elements define the classic formation:
- Left shoulder. Price rises in an existing uptrend, then pulls back, forming the first peak.
- Head. Price rallies to a higher peak than the left shoulder, then falls back again toward the same support area.
- Right shoulder. A third rally stalls at a lower high than the head, roughly near the left shoulder's height.
- Neckline. The line drawn through the two pullback lows. It can slope up, down, or sit flat, and it is the trigger level for the whole pattern.
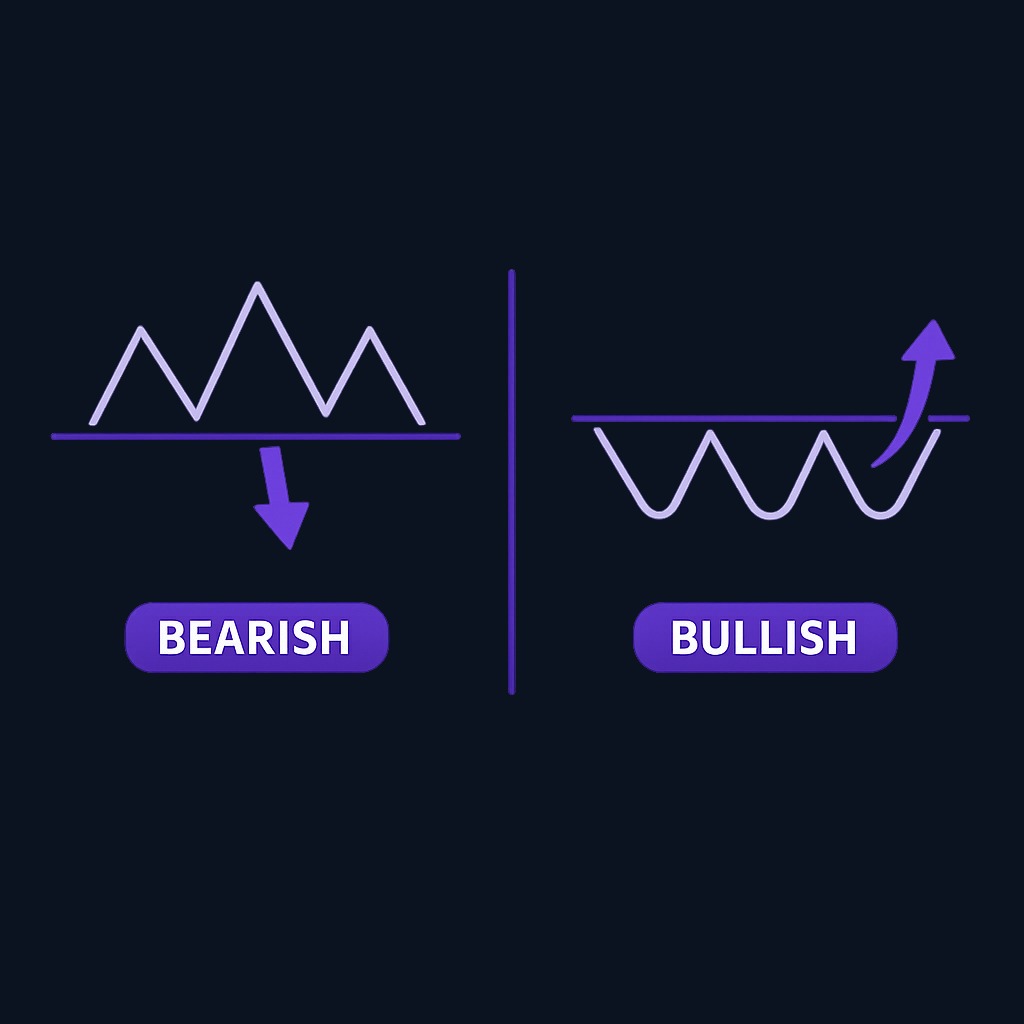
There is also an inverse head and shoulders, the mirror image that forms after a downtrend. Three troughs - the middle one deepest - suggest selling pressure is fading, and a close above the neckline is read as a bullish reversal signal.
How to identify the head and shoulders pattern
Correct identification starts with context: the pattern only means something as a reversal if there is a meaningful prior trend to reverse. Checklist for a valid setup:
- A clear uptrend precedes the formation (for the bearish version).
- The head is distinctly higher than both shoulders.
- The shoulders are roughly symmetrical in height and width - perfection is not required, but gross asymmetry weakens the signal.
- A neckline can be drawn cleanly through the two troughs.
- Price closes below the neckline. Some traders also look for expanding volume, but volume behavior varies by instrument and market structure.
Symmetry in time matters as well as price. If the right shoulder takes far longer to form than the left, momentum may be stalling rather than reversing. On candlestick charts, the pattern is easier to spot on daily and weekly timeframes, where noise is lower; intraday versions form constantly and fail more often.
Trading strategies based on the head and shoulders pattern
Traders commonly build three decisions around the pattern: entry, stop, and target.
| Decision | Common approach | Notes |
|---|---|---|
| Entry | Sell or short on a confirmed close below the neckline | Some wait for a pullback that retests the neckline from below |
| Stop-loss | Above the right shoulder (conservative: above the head) | Defines risk if the pattern fails |
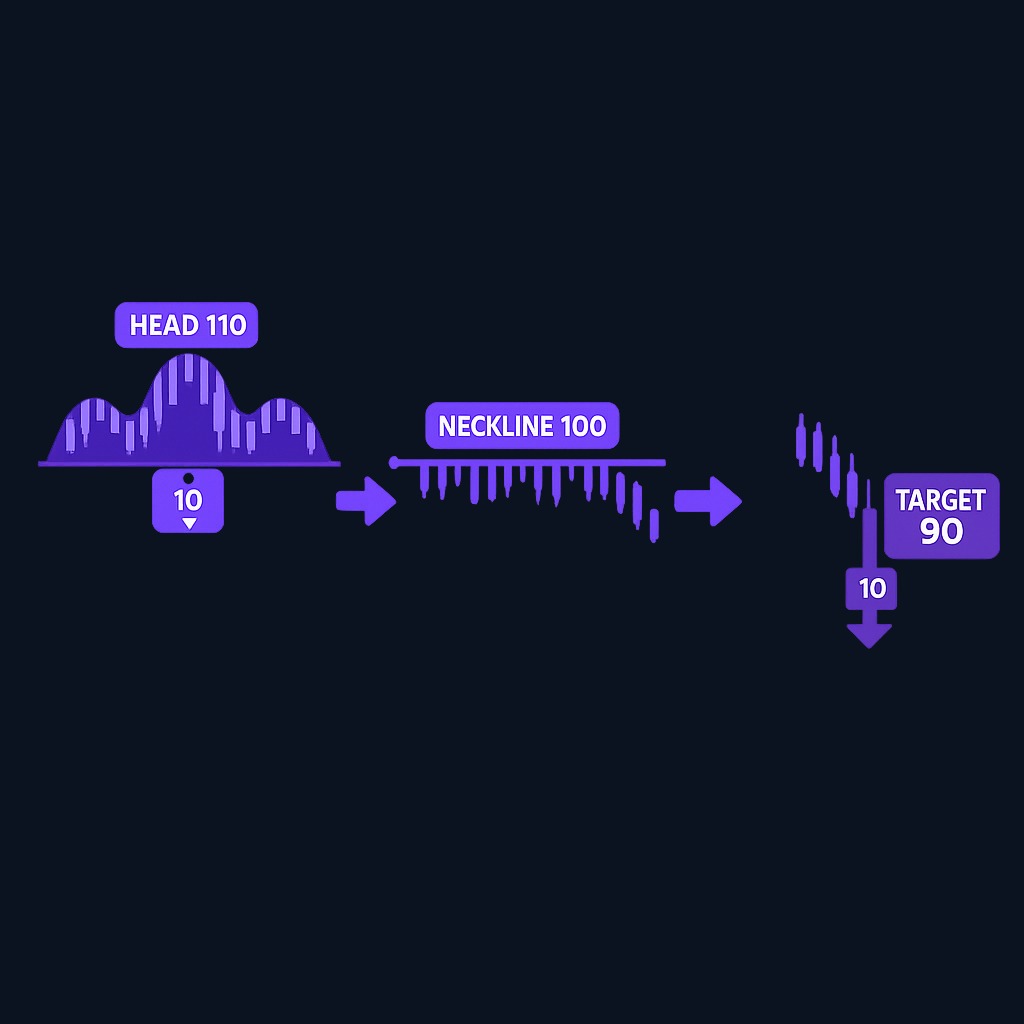
| Price target | Measure head-to-neckline height, project it down from the break | A guideline, not a guarantee |
The measured-move target works like this: if the head sits 10 points above the neckline, a neckline break at 100 projects roughly to 90. Treat that as a planning convention, not a forecast. Position sizing and a written exit rule matter more than the pattern because even clean formations fail. For individual stocks, use the SEC's EDGAR database to review the issuer's filings as well as its chart; a technical setup does not replace research into the security or the risk of loss.
For the inverse pattern, everything mirrors: buy on a close above the neckline, stop below the right shoulder, project the head-to-neckline distance upward.
Volume analysis and its importance
Volume is a contextual input, not a validation stamp. In the textbook description of a bearish head and shoulders, volume often declines from the left shoulder toward the right shoulder. Some traders give more weight to a neckline break accompanied by unusually high volume, but neither pattern is required and neither proves that a reversal will continue.
When volume does not match the textbook description, the safest conclusion is simply that one source of confirmation is absent. Whether that changes results for a particular market is an empirical question to test with consistent rules and a sufficiently large sample.
Common mistakes and pitfalls
- Anticipating the break. Entering before price actually closes below the neckline turns a rules-based setup into a guess. Many patterns stall at the neckline and rally.
- Forcing the pattern. If you squint hard enough, every chart has three bumps. Without a prior trend and clean neckline, it is noise, not a signal.
- Assuming a retest must occur. Price may retest a broken neckline, continue without one, or reclaim the level. A plan should define what each outcome means before entry.
- Skipping the stop-loss. A failed head and shoulders - price breaking down, then reclaiming the neckline - is itself a strong contrary signal, and it punishes anyone trading without an exit plan.
- Trading it in isolation. The pattern is one input. Trend context, support and resistance levels, and broader market conditions all affect the odds.
Practice trading with Finelo
Practice in a simulator, learn with bite-sized lessons, and build confidence before risking real money.
Hypothetical scenarios: how the pattern can play out
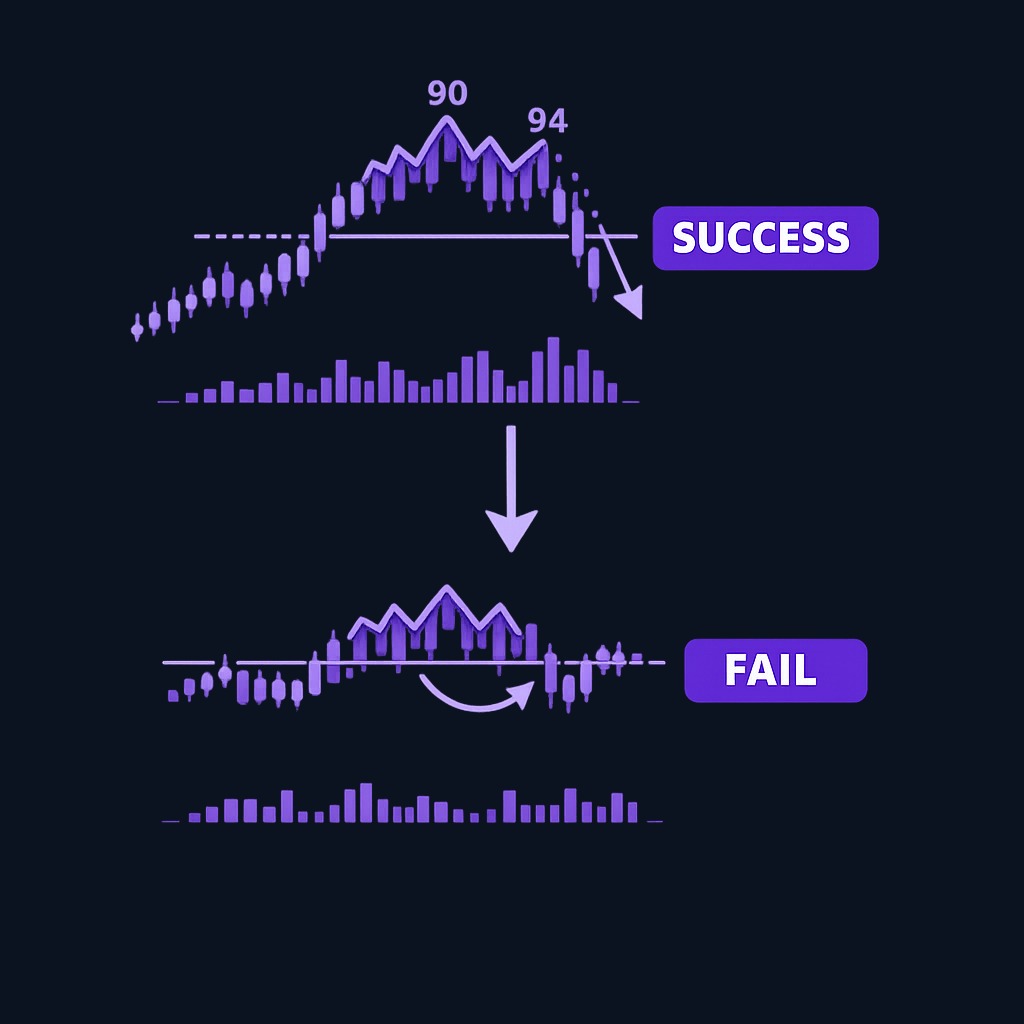
Consider two hypothetical scenarios. In the first, a stock rallies from 60 to 100 over several months, forms a left shoulder at 95, a head at 100, and a right shoulder at 94, with volume shrinking on each peak. The neckline sits near 88. Price breaks 88 on the heaviest selling volume in weeks, retests 88 from below, and rolls over toward the measured target near 76. The numbers illustrate the usual rules; they are not a historical performance claim.
In the second scenario, the same shape forms after a sideways year - no meaningful prior uptrend. Price dips below the neckline on light volume, holds for two days, then rallies back above it. The pattern fails, and short sellers who skipped confirmation eat the loss. The difference between the two cases was never the shape; it was context and volume. Studying both outcomes on historical charts - and practicing in a paper-trading environment before committing capital - is the fastest way to internalize the difference.
What to know before deciding
Chart patterns describe probabilities, not certainties. Before trading any head and shoulders setup, decide three things in writing: the exact neckline level that triggers your entry, the stop level that proves the idea wrong, and the size that keeps the loss tolerable. If you cannot answer all three, you are not ready to take the trade. Beginners should also log every pattern they trade - screenshots, entry, exit, and outcome - because a personal hit-rate record beats any statistic you read online.
Decision framework: should you trade this pattern?
- Trend context: Is there a genuine prior uptrend (or downtrend for the inverse)? If not, skip.
- Structure: Clear head above both shoulders, drawable neckline? If not, skip.
- Volume: Fading through the pattern, expanding on the break? If not, reduce size or skip.
- Risk plan: Stop and target defined, loss affordable? If not, do not enter.
When all four line up, the setup is more clearly defined, but it still deserves only the amount of risk permitted by a tested plan.
FAQ
What does a head and shoulders pattern indicate?
It suggests a potential trend reversal: from up to down for the standard pattern, and from down to up for the inverse version. The signal is only considered active after price closes through the neckline.
How reliable is the head and shoulders pattern?
No pattern works all the time, and failure rates rise without volume confirmation or a clear prior trend. Treat it as a probability edge that still requires stops and position sizing, not a guarantee.
What timeframes does the pattern work on?
It can appear on any timeframe. Higher-timeframe charts contain fewer observations and may look less noisy, but reliability depends on the instrument, rules, sample, and trading costs; test the exact timeframe you intend to use.
What is the difference between head and shoulders and a triple top?
In a triple top, all three peaks reach roughly the same level. In a head and shoulders, the middle peak is distinctly higher. Both are bearish reversal patterns triggered by a support break.
Conclusion and next steps
The head and shoulders pattern earns its reputation when it is traded with discipline: a real prior trend, a distinct head, a clean neckline, fading volume into the right shoulder, and a confirmed break before entry. The measured-move target gives you a planning framework, the stop above the right shoulder caps the damage when the market disagrees, and the retest is expected rather than feared. Build the skill on historical charts and in simulation before putting real money behind it - the Finelo app includes pattern-recognition lessons and practice tools designed for exactly this progression.
Chart AnalysisTechnical AnalysisBeginner
Practice trading with Finelo
Practice in a simulator, learn with bite-sized lessons, and build confidence before risking real money.
About the author
Finelo Team
The Finelo Team creates practical investing and trading education designed to help beginners learn faster with structured challenges, simulator practice, and bite-sized lessons.
Keep reading — Related articles

Chart Analysis
Symmetrical Triangle Pattern: Identification, Breakouts, and Limits
A symmetrical triangle forms when lower highs and higher lows narrow the trading range. Learn to identify it, assess breakout confirmation, and recognize false signals.
Finelo Team

Chart Analysis
Hanging Man Candlestick: The Hammer’s Bearish Twin Explained
A hanging man is a bearish warning candle after an uptrend. Learn how its context differs from a hammer, why confirmation matters, and when the warning fails.
Finelo Team

Chart Analysis
Evening Star Pattern: How to Identify a Three-Candle Reversal
The evening star is a three-candle bearish reversal pattern that forms after an uptrend. Learn its anatomy, confirmation signals, and limitations before interpreting it on a chart.
Finelo Team


