Methodology note: True range is the maximum of high minus low, absolute high minus prior close, and absolute low minus prior close. Wilder's original ATR uses his recursive smoothing; a simple 14-period average is a different implementation. ATR measures historical range magnitude, not direction or a safe stop distance. A 1.5x–3x multiple is a strategy parameter, not a validated universal rule.
The Average True Range Indicator: A Key Tool for Traders
The average true range indicator (ATR) measures volatility: it tells you how much a market typically moves over a chosen period, usually 14 bars. It does not predict direction. Traders use the ATR to size positions,…
7 min read
Practice trading with Finelo
Practice in a simulator, learn with bite-sized lessons, and build confidence before risking real money.
Want to learn more?
Practice in a simulator, learn with bite-sized lessons, and build confidence before risking real money.
Explore FineloExplore Finelo's 28-day challenges
Turn learning into a daily habit with guided challenge paths.
The average true range indicator (ATR) measures volatility: it tells you how much a market typically moves over a chosen period, usually 14 bars. It does not predict direction. Traders use the ATR to size positions, place stops at sensible distances, and compare volatility across markets and time. This page is for beginning and intermediate traders who want a practical, hype-free understanding of the tool. Read how the calculation works and how traders actually apply it, then practice using indicators on simulated charts in the Finelo app before risking real money.
What is the average true range indicator?
The ATR was introduced by J. Welles Wilder, the same technician behind several classic indicators. It answers one question: how large is the typical price move right now?
The building block is the true range, which captures a bar's real movement including any gap from the previous close. The true range of a bar is the largest of three values:
- the current high minus the current low,
- the absolute value of the current high minus the previous close,
- the absolute value of the current low minus the previous close.
Using the previous close matters because markets gap. A stock can close at 50 and open at 53 the next day. The high-minus-low range of the new bar might look small, but the real move a holder experienced was much larger. True range counts that gap.
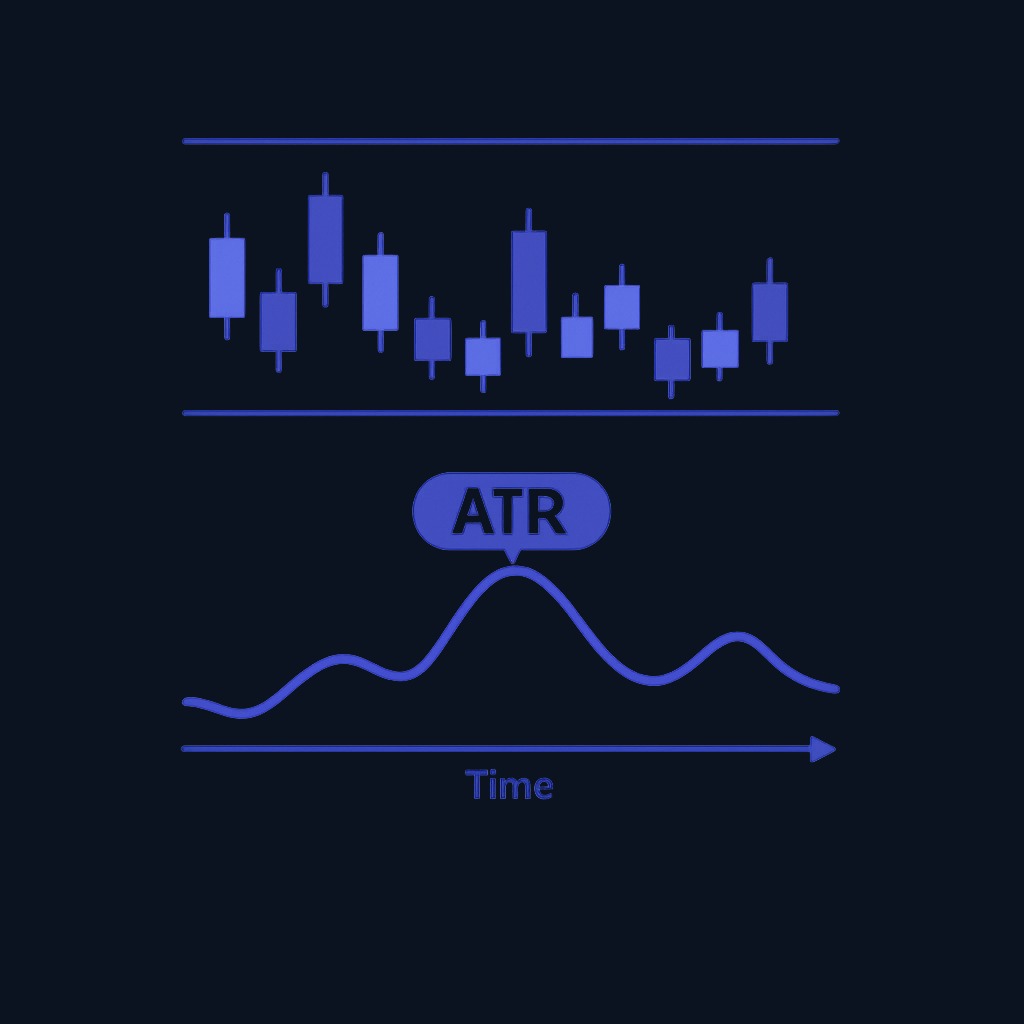
The average true range then smooths the true range over a lookback window. Wilder used 14 periods, and 14 remains the common default on most charting platforms. The result is a single line, usually plotted under the price chart, rising when bars get bigger and falling when the market goes quiet.
How to calculate the average true range
The calculation runs in two steps: compute the true range for each bar, then average it.
| Step | What you do |
|---|---|
| 1 | For each bar, find the greatest of: high − low, |high − previous close|, |low − previous close| |
| 2 | Average the last 14 true-range values (or your chosen period) |
| 3 | For ongoing bars, apply Wilder's smoothing: ATR = (previous ATR × 13 + current TR) ÷ 14 |
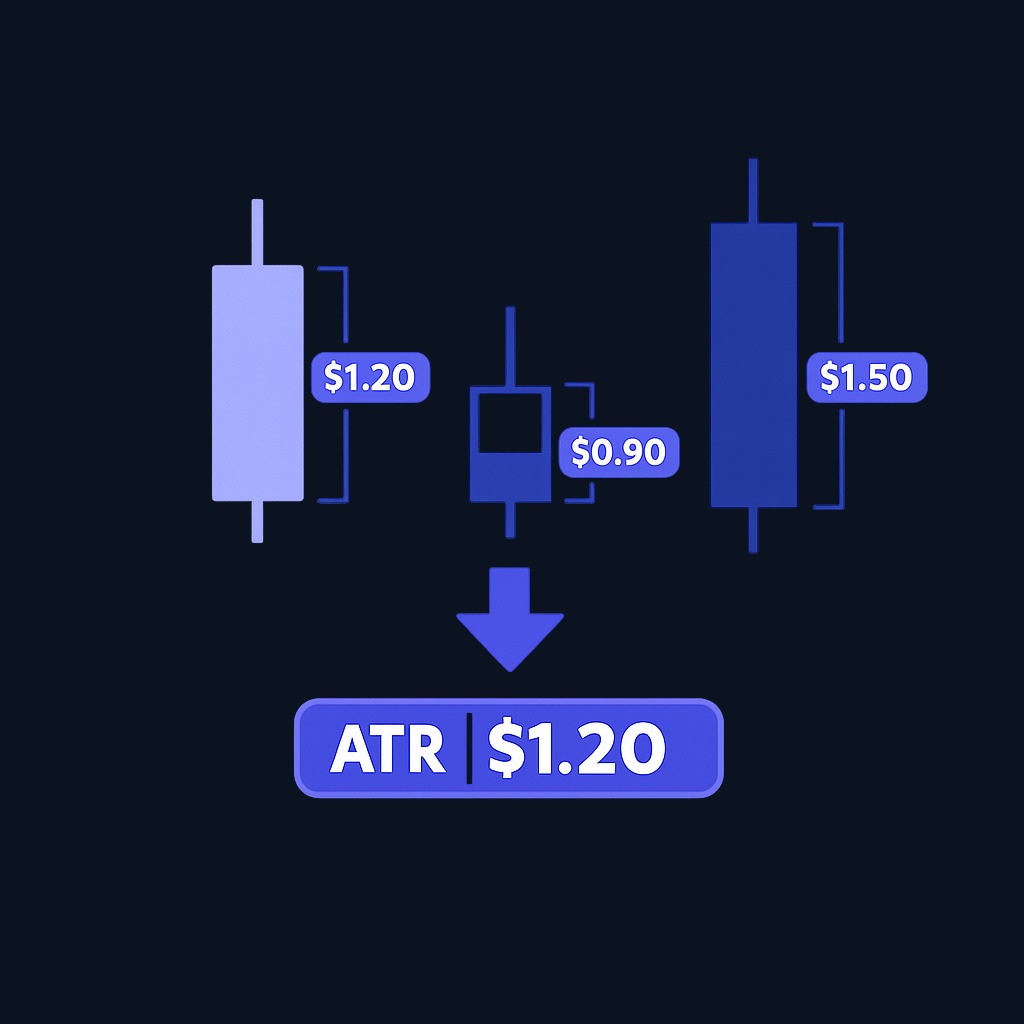
A short example: suppose a stock's last three bars produced true ranges of $1.20, $0.90, and $1.50. A simple three-period average gives an ATR of $1.20. If the stock trades near $60, that is a typical move of about two percent per bar. The same $1.20 ATR on a $12 stock would signal a far more volatile instrument in percentage terms.
Two practical notes. First, the ATR is expressed in price units, not percent, so compare ATR to the instrument's price when judging volatility. Second, shorter periods (such as 7) react faster but whip around; longer periods (such as 21) are steadier but slower to reflect regime changes.
How traders use the atr
Setting stop-loss distances
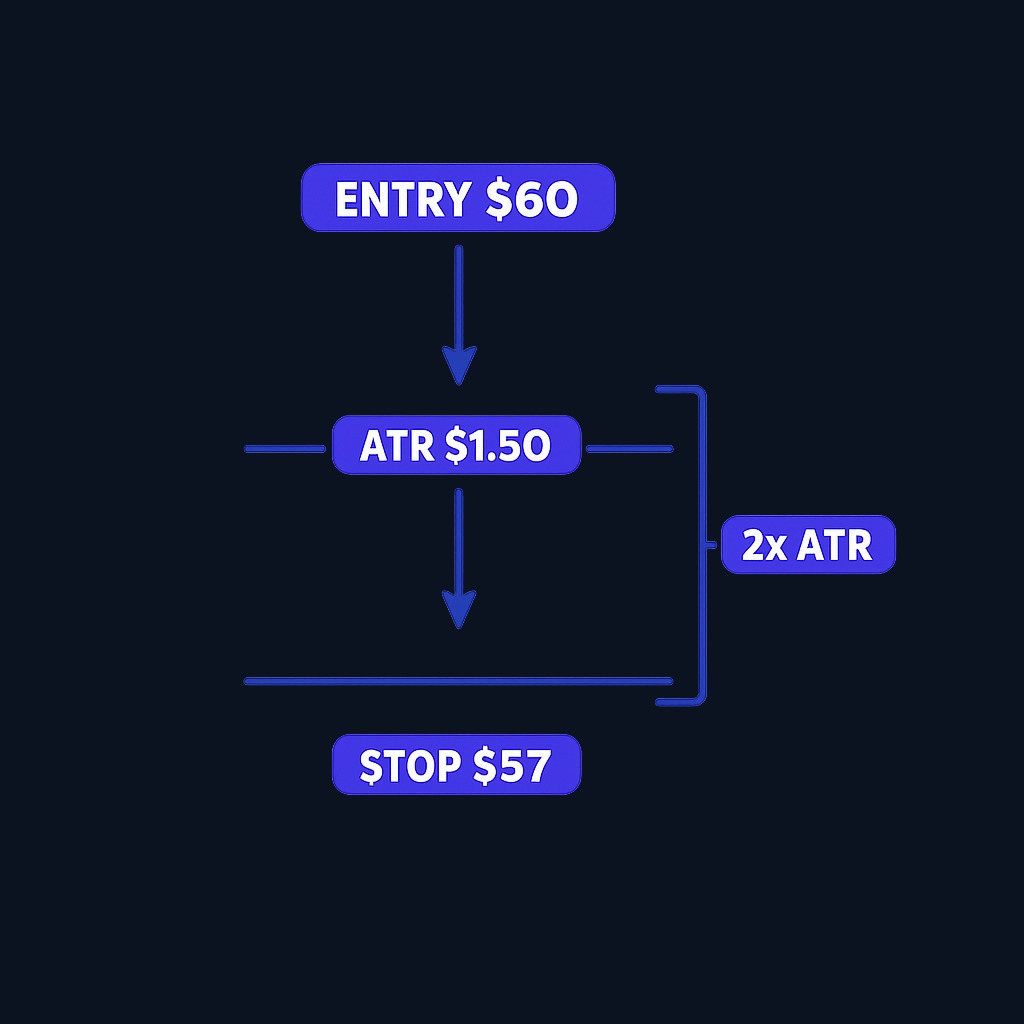
One use is to express a stop distance as a multiple of ATR instead of a fixed amount. There is no universal 1.5x–3x range: the multiplier, position size, and exit method require strategy-specific testing. ATR adapts the distance to recent range but cannot distinguish “noise” from information or guarantee a fill. A triggered stop order generally becomes a market order, so gaps and slippage remain possible.
Position sizing
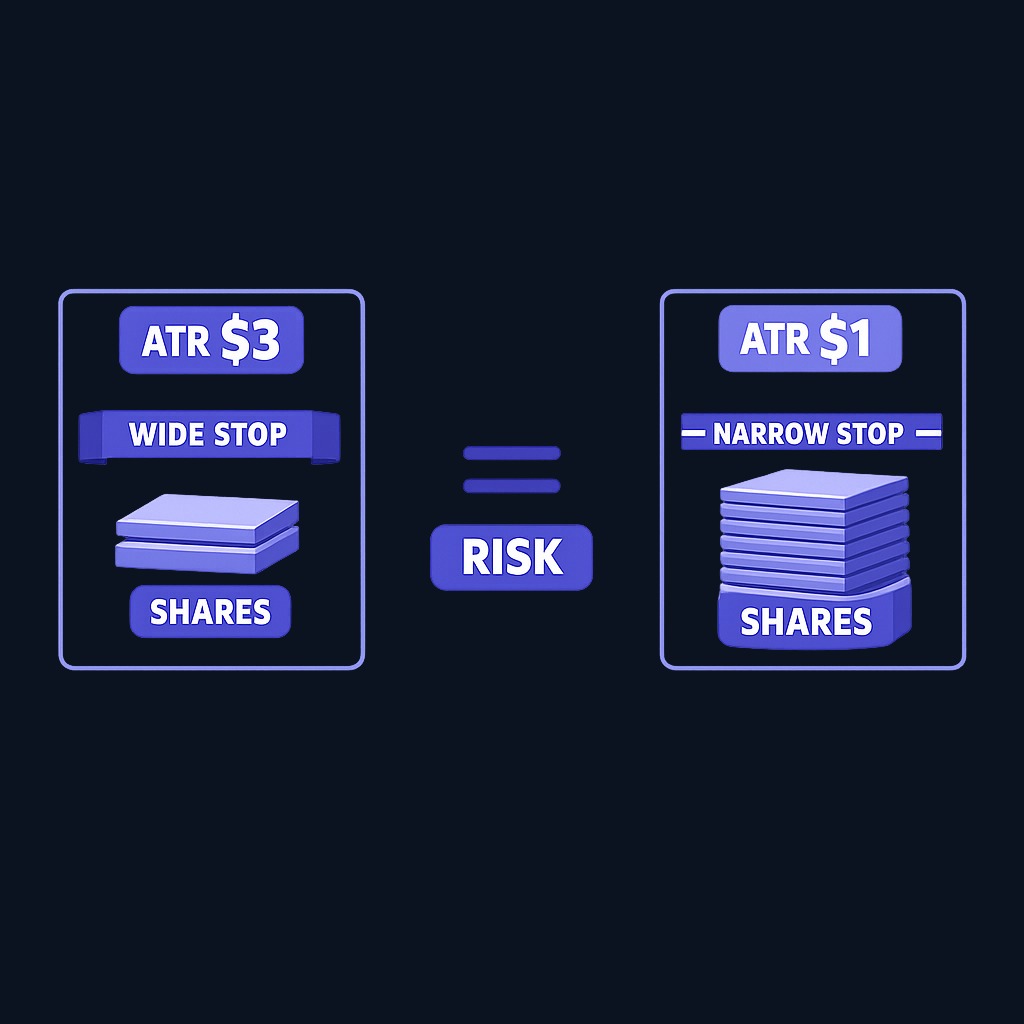
ATR-based sizing keeps risk roughly constant across instruments. A trader who risks a fixed amount per trade divides that amount by the ATR-based stop distance to get position size. Volatile markets automatically get smaller positions; quiet ones get larger positions with the same dollar risk.
Volatility filters and trailing stops
Some strategies only take signals when ATR is rising, treating expanding range as confirmation of a genuine move. Others trail a stop behind price by an ATR multiple - the "chandelier exit" is a well-known version - letting winners run while volatility-adjusting the exit.
Limitations and common mistakes
The ATR has clear limits. It is direction-blind: a rising ATR says bars are getting bigger, not which way price is headed. It lags, because it averages the recent past; a sudden news shock shows up only after the fact. And its absolute value is not comparable across instruments without adjusting for price level.
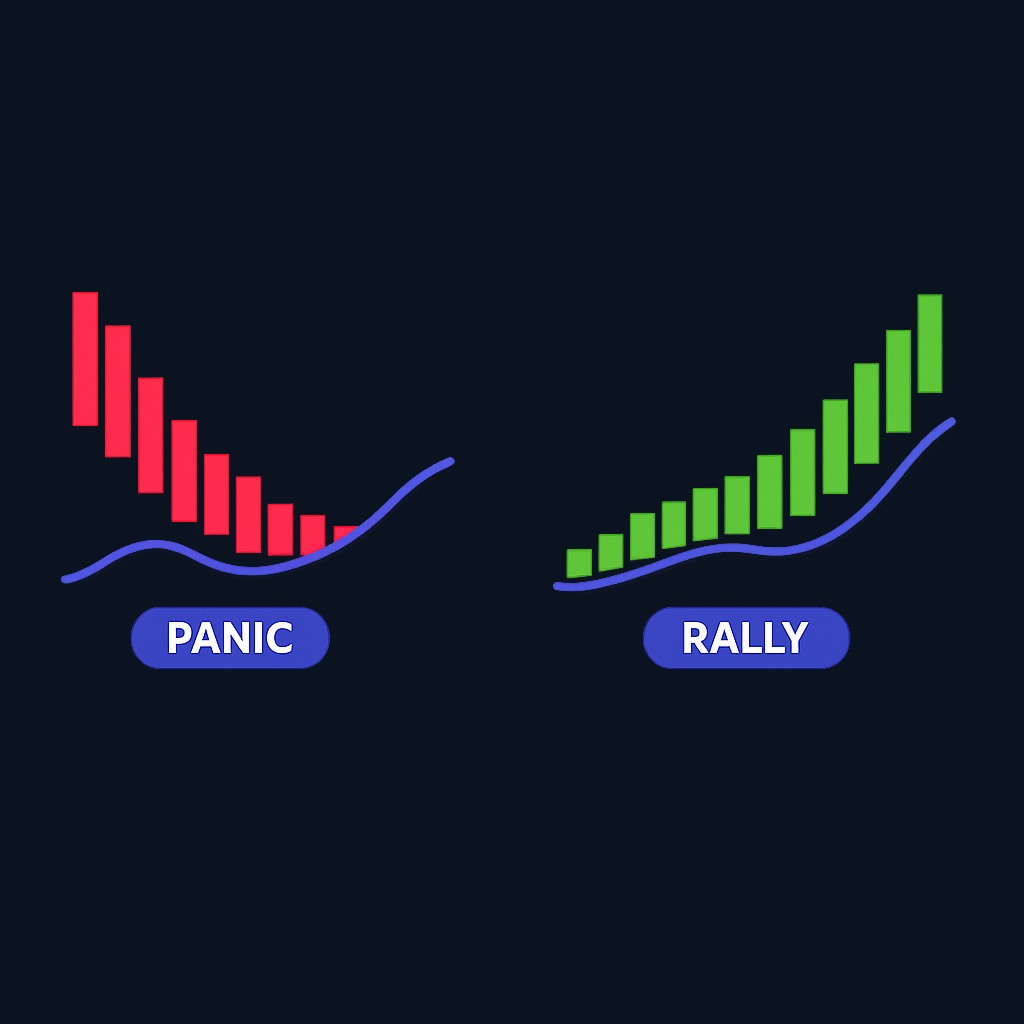
Common mistakes follow from ignoring those limits. Traders sometimes read a rising ATR as bullish, when it often accompanies panicked selling. Others use one fixed ATR multiple across every market and timeframe, though the right multiple depends on strategy, holding period, and testing. A third mistake is anchoring to the default 14-period setting without checking whether it fits the strategy's horizon. None of these are flaws in the indicator; they are misuses of it.
Practice trading with Finelo
Practice in a simulator, learn with bite-sized lessons, and build confidence before risking real money.
What to know before deciding
Before building the ATR into your trading plan, keep the bigger picture in mind. No indicator, alone, produces reliable profits; volatility measurement supports decisions rather than making them. Backtest any ATR-based rule on historical data and then in simulation before committing capital. Costs matter too: tighter, ATR-adjusted stops mean more frequent trades, and commissions and slippage compound quickly. Finally, volatility itself changes character across regimes - an ATR multiple tuned to a calm year may fail in a turbulent one. Treat every parameter as something to re-examine, not a constant.
Decision framework: fitting the atr into a trading plan
- Define the job. Decide whether ATR will size positions, place stops, filter entries, or all three.
- Match the period to your horizon. Day traders often use shorter ATR windows on intraday bars; swing traders commonly stay near 14 on daily bars.
- Test multiples, don't guess. Compare stop distances of 1.5x, 2x, and 3x ATR in a backtest and count both win rate and average loss.
- Paper trade the rule. Run the full system in a simulator long enough to see quiet and volatile stretches.
- Review quarterly. Recheck whether current ATR levels still match the assumptions your sizing was built on.
FAQ
What does the average true range indicator tell you?
It tells you how much an instrument typically moves per bar over the lookback period. High ATR means large average moves; low ATR means a quiet market. It says nothing about direction.
What is a good atr setting?
The default is 14 periods and works for many swing-trading approaches. Shorter settings react faster for intraday trading; longer settings smooth noise for position trading. The best setting is the one validated by your own testing.
How do you use atr for stop losses?
Multiply the current ATR by a chosen factor, commonly between 1.5 and 3, and place the stop that distance from your entry. The stop then adapts to volatility: wider in wild markets, tighter in calm ones.
Is the atr useful for long-term investors?
Mostly indirectly. Long-term investors care more about fundamentals, but ATR can still inform entry timing or highlight when a holding's volatility regime has changed materially.
Conclusion and next steps
The average true range strips volatility down to one usable number: the size of a typical move. That number will not call tops or bottoms, but it makes stops rational, position sizes consistent, and market comparisons honest. Learn the calculation once, test your multiples, and let the indicator do the quiet work of keeping risk proportional. To build the habit safely, practice ATR-based stops and sizing on simulated trades with structured lessons before deploying them live.
Chart AnalysisTechnical AnalysisBeginner
Practice trading with Finelo
Practice in a simulator, learn with bite-sized lessons, and build confidence before risking real money.
About the author
Finelo Team
The Finelo Team creates practical investing and trading education designed to help beginners learn faster with structured challenges, simulator practice, and bite-sized lessons.
Keep reading — Related articles

Chart Analysis
Symmetrical Triangle Pattern: Identification, Breakouts, and Limits
A symmetrical triangle forms when lower highs and higher lows narrow the trading range. Learn to identify it, assess breakout confirmation, and recognize false signals.
Finelo Team

Chart Analysis
Hanging Man Candlestick: The Hammer’s Bearish Twin Explained
A hanging man is a bearish warning candle after an uptrend. Learn how its context differs from a hammer, why confirmation matters, and when the warning fails.
Finelo Team

Chart Analysis
Evening Star Pattern: How to Identify a Three-Candle Reversal
The evening star is a three-candle bearish reversal pattern that forms after an uptrend. Learn its anatomy, confirmation signals, and limitations before interpreting it on a chart.
Finelo Team


