Methodology note: An SMA gives equal weight to each observation in its window. An EMA applies exponentially declining weights using a stated smoothing factor and seed; platforms can differ during initialization. Greater responsiveness is not an investment edge by itself. Any crossover, trend filter, or support/resistance use should be defined and tested on the intended instrument, timeframe, corporate-action-adjusted data, and trading costs.
SMA vs EMA: A Detailed Comparison of Moving Averages
The short answer: a simple moving average (SMA) weights every price in its lookback window equally, while an exponential moving average (EMA) gives more weight to recent prices, so the EMA reacts faster to new moves and…
9 min read
Practice trading with Finelo
Practice in a simulator, learn with bite-sized lessons, and build confidence before risking real money.
Want to learn more?
Practice in a simulator, learn with bite-sized lessons, and build confidence before risking real money.
Explore FineloExplore Finelo's 28-day challenges
Turn learning into a daily habit with guided challenge paths.
The short answer: a simple moving average (SMA) weights every price in its lookback window equally, while an exponential moving average (EMA) gives more weight to recent prices, so the EMA reacts faster to new moves and the SMA filters noise more smoothly. Neither is objectively better. Shorter-horizon traders usually prefer the EMA's responsiveness, while longer-horizon investors often prefer the SMA's stability. This page is for traders and investing students comparing the two indicators for the first time. Read the definitions, the side-by-side table, and the worked example below, then practice both settings on historical charts inside the Finelo app before risking real money.
The core difference is how each average weights older observations; the resulting lag and initialization choices matter more than the label.
What a simple moving average (SMA) measures
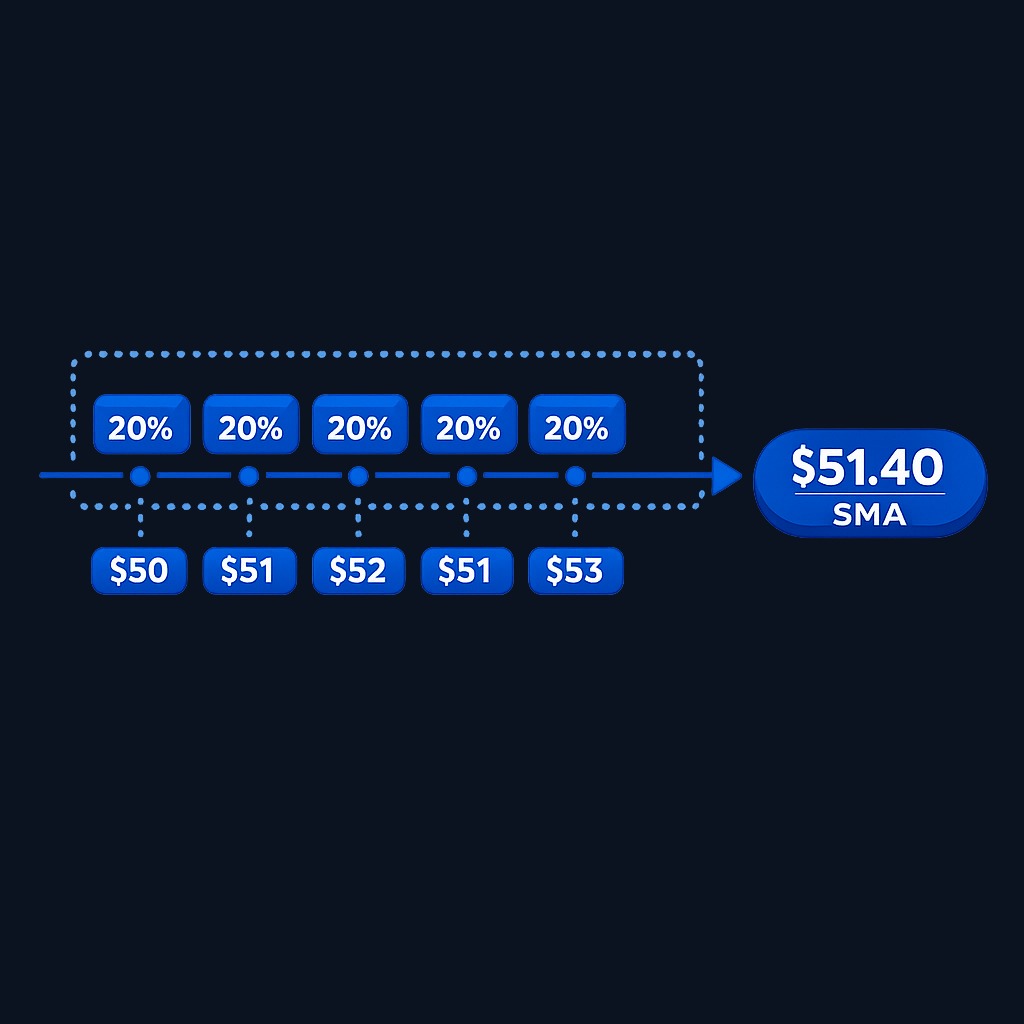
A moving average smooths price data into a single line so you can see the underlying trend. The simple version is the most direct: add up the closing prices for a set number of periods and divide by that number. A 20-day SMA is the arithmetic mean of the last 20 daily closes. Every close counts the same, whether it happened yesterday or three weeks ago.
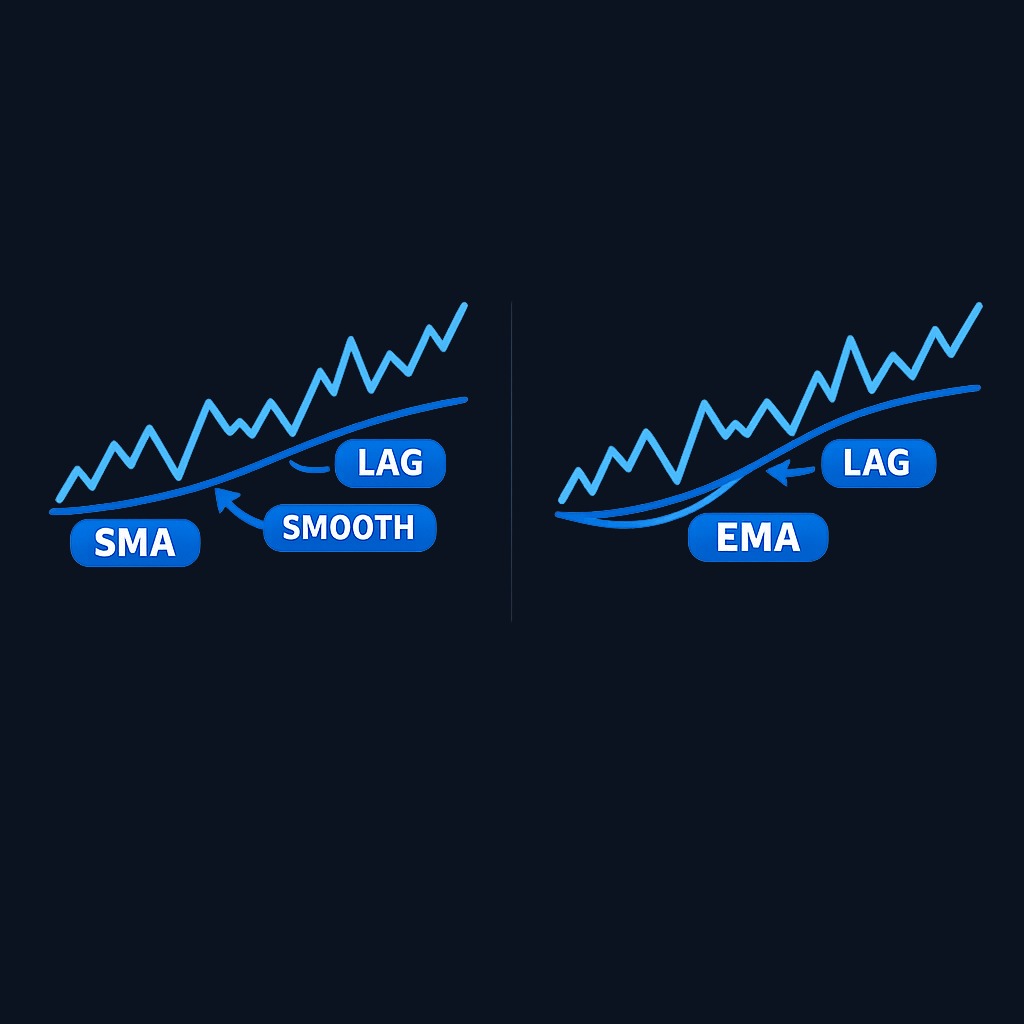
That equal weighting has two consequences. First, the line is smooth and slow, which helps when you want to ignore day-to-day noise. Second, the SMA lags: a sharp price move takes several sessions to fully show up in the average, and an old outlier drops out of the window all at once, which can shift the line even when today's price barely moved.
Common SMA lookbacks are 20, 50, and 200 periods. The 200-day SMA in particular is a widely watched reference line for long-term trend direction in stocks and index funds.
What an exponential moving average (EMA) measures
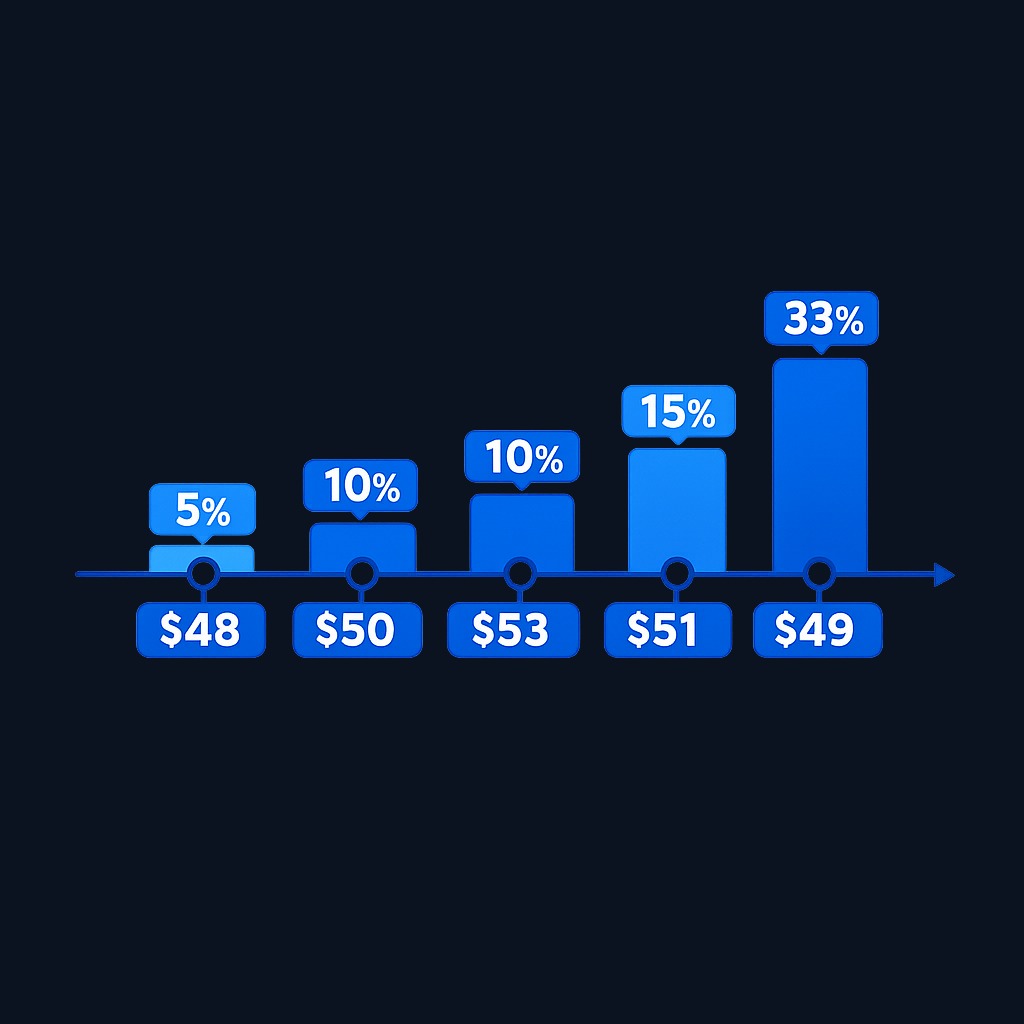
The exponential moving average also averages past closes, but it applies a weighting multiplier that decays exponentially as data gets older. The most recent close carries the largest weight, the close before it slightly less, and so on. The multiplier is calculated as 2 divided by (N + 1), where N is the period length. For a 20-period EMA, each new close gets a weight of about 9.5%, and everything already in the average keeps the remaining 90.5%.
Because recent prices dominate, the EMA hugs current price action more closely and turns faster at reversals. That responsiveness is why shorter EMAs such as the 9, 12, and 26 period versions are popular with day and swing traders, and why the MACD indicator is built from EMAs rather than SMAs. The tradeoff is more false signals: an average that reacts quickly to real moves also reacts quickly to noise.
Key differences between SMA and EMA
| Criterion | SMA | EMA |
|---|---|---|
| Weighting | Equal across the whole window | Exponentially higher for recent prices |
| Reaction speed | Slower, more lag | Faster, less lag |
| Noise filtering | Smoother line, fewer whipsaws | More sensitive, more false signals |
| Typical users | Position traders, long-term investors | Day traders, swing traders |
| Common settings | 20, 50, 200 periods | 9, 12, 21, 26, 50 periods |
| Behavior at window edge | Old prices drop out abruptly | Old prices fade out gradually |
| Calculation | Arithmetic mean of N closes | Recursive formula with 2/(N+1) multiplier |
Both indicators are trend-following and both lag price by design. The EMA simply distributes its lag differently, trading smoothness for speed.
When to use SMA vs EMA
Match the tool to your holding period and decision style.
- Long-term trend confirmation. The 200-day and 50-day SMA are the standard references for whether a stock or index is in a long-term uptrend or downtrend. Their slowness is a feature here: you want a line that ignores weekly noise.
- Swing trading over days to weeks. Many swing traders use a 21-period EMA or the 12/26 EMA pair to time entries in the direction of a larger trend. The faster turn helps capture moves earlier.
- Intraday trading. Short EMAs such as the 9-period line are common on 5-minute and 15-minute charts, where an SMA of the same length would lag too far behind fast volume-driven moves.
- Crossover systems. Golden-cross and death-cross signals traditionally use the 50-day and 200-day SMA. Faster crossover systems, including MACD, use EMAs. Whichever you pick, stay consistent so your backtests match your live signals.
- Dynamic support and resistance. Both types can act as support and resistance zones. Widely watched settings, like the 200-day SMA or 21-day EMA, tend to matter more simply because more traders react to them.
Practice trading with Finelo
Practice in a simulator, learn with bite-sized lessons, and build confidence before risking real money.
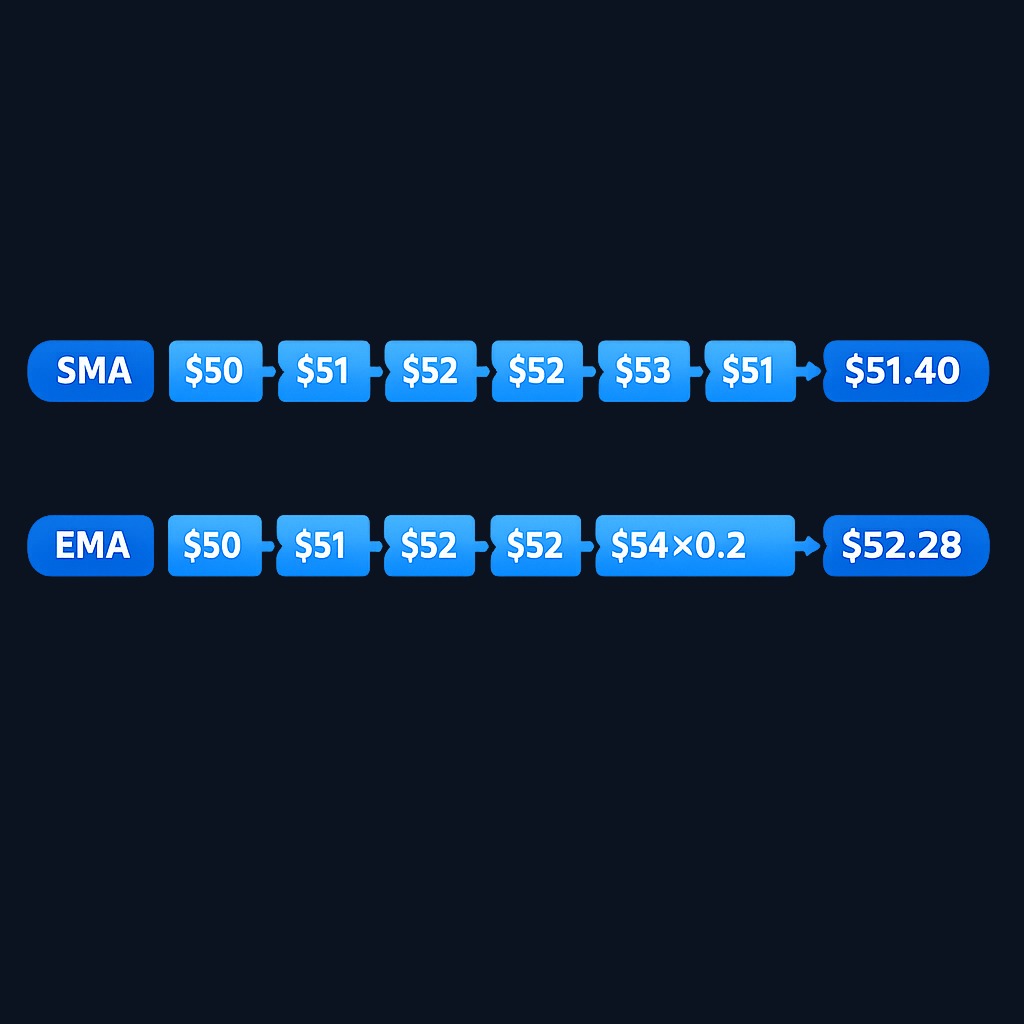
Worked example: the same five closes, two different averages
Numbers make the difference concrete. Suppose a stock closes five straight sessions at $50, $51, $52, $51, and $53.
- The 5-day SMA is (50 + 51 + 52 + 51 + 53) / 5 = $51.40.
- A 5-period EMA uses a multiplier of 2 / (5 + 1) = 0.333 and is typically seeded with the first SMA value, so it also starts at $51.40.
Now the stock jumps to $54 on day six.
- The new SMA averages days two through six: (51 + 52 + 51 + 53 + 54) / 5 = $52.20.
- The new EMA is (54 × 0.333) + (51.40 × 0.667) = 18.00 + 34.28 = $52.28.
After a single strong close, the EMA already sits above the SMA, and the gap widens with each additional up day. Run the same math through a two-day pullback and the EMA also falls faster. Same data, different memory: that is the entire sma vs ema debate in one calculation. Recreate this table in a spreadsheet with your own numbers once, and the behavior of every chart you look at afterward will make more sense.
What to know before deciding
- Lag is unavoidable. Any average of past prices trails price. Changing the type or length redistributes lag; it never removes it.
- Settings matter more than type. A 10-period SMA reacts faster than a 50-period EMA. Compare like with like before concluding one type is superior.
- No setting wins everywhere. An average that performed well on one instrument or timeframe can perform poorly on another. Paper-test your exact setting on the market you actually trade, for example with paper trading before committing capital.
Common mistakes to avoid
Treating a moving average as a buy signal by itself is the classic error; averages describe trend, they do not predict it. Other frequent mistakes include stacking many similar averages on one chart, changing settings after every losing trade, and ignoring the broader market context. Day-trading around fast signals carries real risk of loss, a point regulators make bluntly in the SEC's day trading guidance. Educational tools and disciplined position sizing matter more than the exact average you choose.
Decision framework: choosing your moving average
Ask three questions in order.
- What is my holding period? Weeks to months favor SMAs (20/50/200). Days to weeks favor EMAs (12/21/26). Minutes to hours favor short EMAs (9/12).
- What hurts me more: lag or noise? If missing the start of moves costs you most, use the EMA. If getting shaken out by false turns costs you most, use the SMA.
- What does my strategy assume? If you follow a published system or indicator, use the average type it was built on, and keep it consistent between backtest and live use.
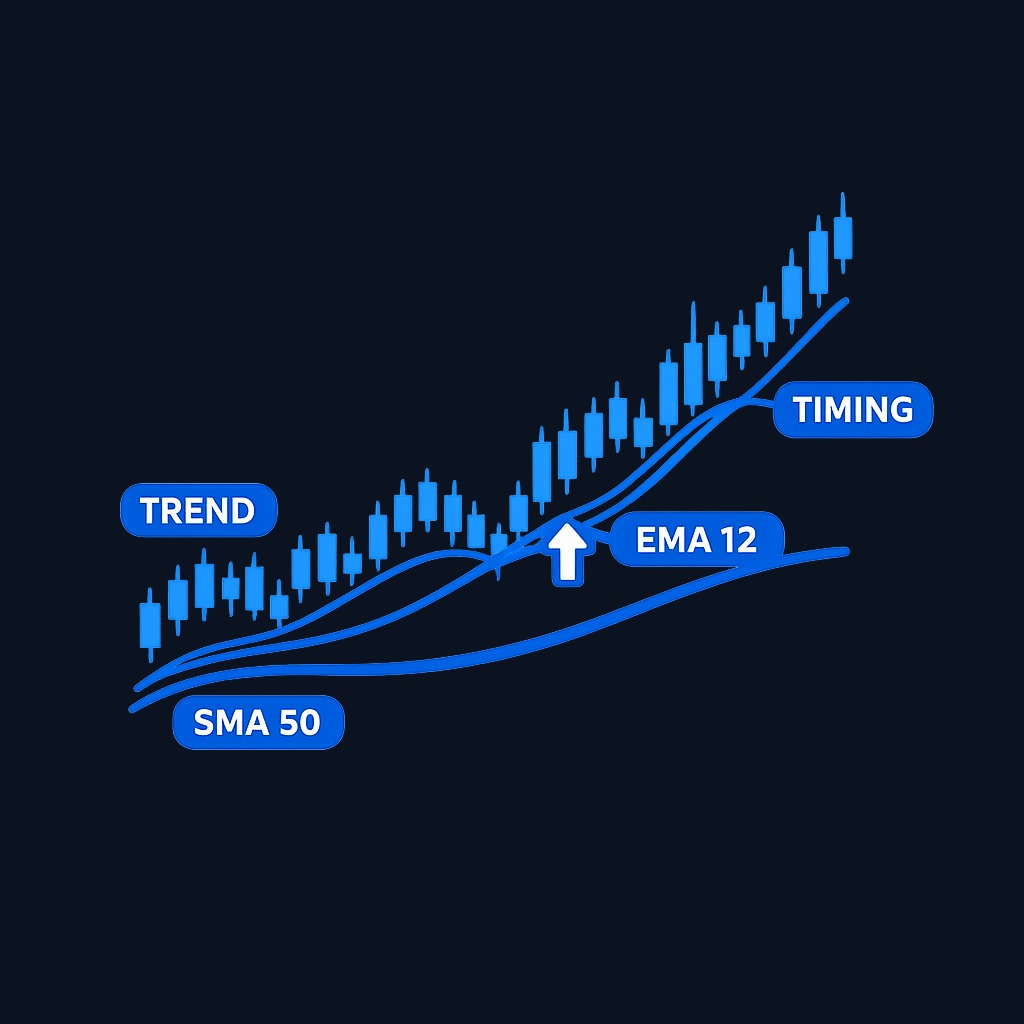
If you are still unsure, start with one slow SMA for trend direction and one fast EMA for timing. That two-line setup covers most beginner use cases without clutter.
FAQ
What is the difference between SMA and EMA?
The SMA weights all prices in its window equally; the EMA weights recent prices more heavily using a 2/(N+1) multiplier. As a result the EMA follows price more closely and turns faster, while the SMA is smoother and slower.
When should I use SMA instead of EMA?
Use the SMA when you care about the big trend rather than quick timing: long-term investing, position trading, or reading widely watched levels like the 200-day line. Its extra smoothness filters out noise you were going to ignore anyway.
How do I calculate SMA and EMA?
SMA: sum the last N closes and divide by N. EMA: multiply today's close by 2/(N+1), multiply yesterday's EMA by 1 minus that multiplier, and add the two. Seed the first EMA value with an SMA so the recursion has a starting point.
Do professional traders prefer EMA or SMA?
Both are used professionally, typically matched to timeframe: shorter-term desks lean on EMAs for responsiveness, while longer-horizon analysts reference the 50-day and 200-day SMAs because so many market participants watch them.
Conclusion and next steps
SMA and EMA answer the same question, "which way is price drifting?", with different memories. The SMA remembers everything in its window equally and moves deliberately. The EMA remembers yesterday best and moves early. Pick the one that matches your holding period, keep the setting consistent, and judge it by how it performs on your market, not on someone else's screenshots. The fastest way to build that judgment is repetition without risk: chart both averages, log your reads, and review what worked.
Chart AnalysisTechnical AnalysisBeginner
Practice trading with Finelo
Practice in a simulator, learn with bite-sized lessons, and build confidence before risking real money.
About the author
Finelo Team
The Finelo Team creates practical investing and trading education designed to help beginners learn faster with structured challenges, simulator practice, and bite-sized lessons.
Keep reading — Related articles

Chart Analysis
Symmetrical Triangle Pattern: Identification, Breakouts, and Limits
A symmetrical triangle forms when lower highs and higher lows narrow the trading range. Learn to identify it, assess breakout confirmation, and recognize false signals.
Finelo Team

Chart Analysis
Hanging Man Candlestick: The Hammer’s Bearish Twin Explained
A hanging man is a bearish warning candle after an uptrend. Learn how its context differs from a hammer, why confirmation matters, and when the warning fails.
Finelo Team

Chart Analysis
Evening Star Pattern: How to Identify a Three-Candle Reversal
The evening star is a three-candle bearish reversal pattern that forms after an uptrend. Learn its anatomy, confirmation signals, and limitations before interpreting it on a chart.
Finelo Team


