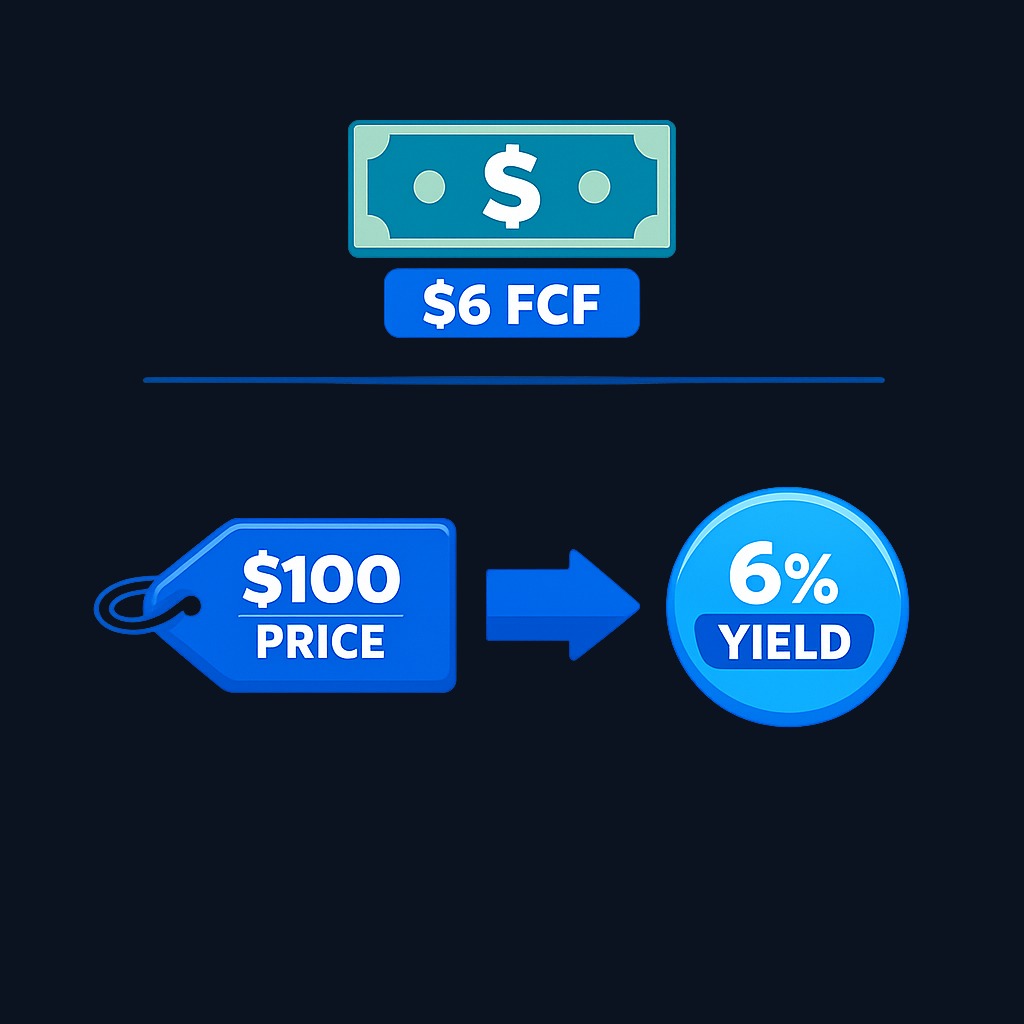
Free cash flow yield measures how much spendable cash a company generates each year relative to what the market charges you to own it. You calculate it by dividing free cash flow per share by the share price, or total free cash flow by market capitalization. A company producing $6 of free cash per share at a $100 stock price has a 6% free cash flow yield.
What is Free Cash Flow Yield and Why It Matters
Free cash flow yield measures how much spendable cash a company generates each year relative to what the market charges you to own it. You calculate it by dividing free cash flow per share by the share price, or total…
8 min read
Practice investing with Finelo
Build practical investing skills with guided lessons, simulator practice, and structured challenges.
Want to learn more?
Build practical investing skills with guided lessons, simulator practice, and structured challenges.
Explore FineloExplore Finelo's 28-day challenges
Turn learning into a daily habit with guided challenge paths.
This page is for investors who want to look past reported earnings and judge a stock by the cash the business actually throws off. You will find the formulas, a worked example, interpretation bands, industry context, common pitfalls, and a decision framework. It is educational material, not financial advice, so verify numbers before acting on them.
Understanding free cash flow
Free cash flow (FCF) is the cash a company generates from operations minus the money it must reinvest in property, equipment, and other capital expenditures. It is the cash left over to pay dividends, buy back stock, reduce debt, make acquisitions, or simply build a cushion.
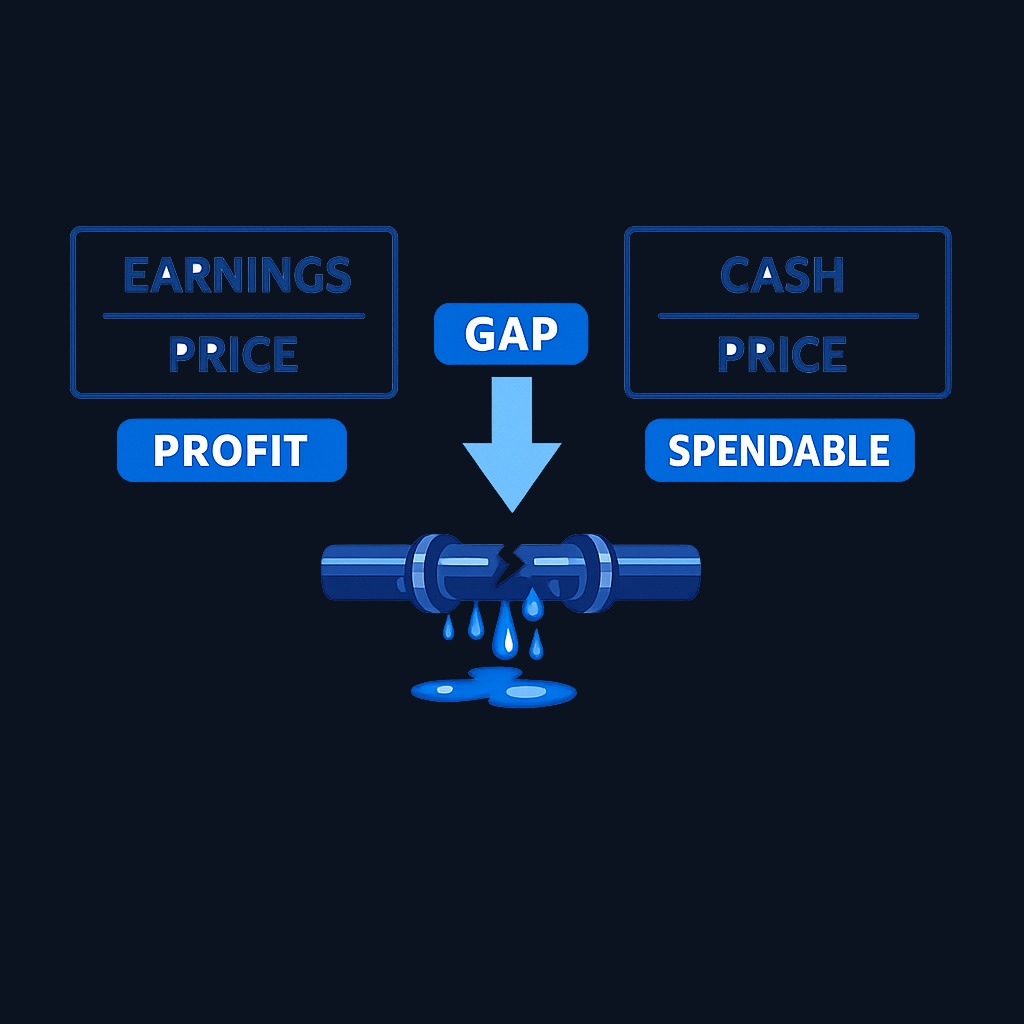
Free cash flow differs from net income in an important way. Earnings include non-cash accounting items such as depreciation and can be shaped by estimates and timing choices. Cash flow is harder to dress up: money either arrived and stayed, or it did not. That is why many analysts treat FCF as a reality check on reported profits. A company can report growing earnings while cash quietly drains away into inventory, unpaid receivables, or heavy equipment purchases; free cash flow exposes that gap.

The standard calculation is:
Free cash flow = operating cash flow - capital expenditures
Both inputs come straight from the cash flow statement, which every US public company files quarterly and annually. You can read those filings for free in the SEC's EDGAR database, so the raw data behind any FCF figure is always verifiable.
Calculating free cash flow yield
Once you have free cash flow, the yield is one division away. There are two common versions:
Free cash flow yield = free cash flow per share ÷ share price × 100%
or, equivalently at the company level:
Free cash flow yield = total free cash flow ÷ market capitalization × 100%
Some professionals prefer an enterprise-value version, dividing free cash flow by enterprise value instead of market cap. Because enterprise value includes debt and subtracts cash, that variant is better for comparing companies with very different balance sheets, though it is slightly more work to compute.
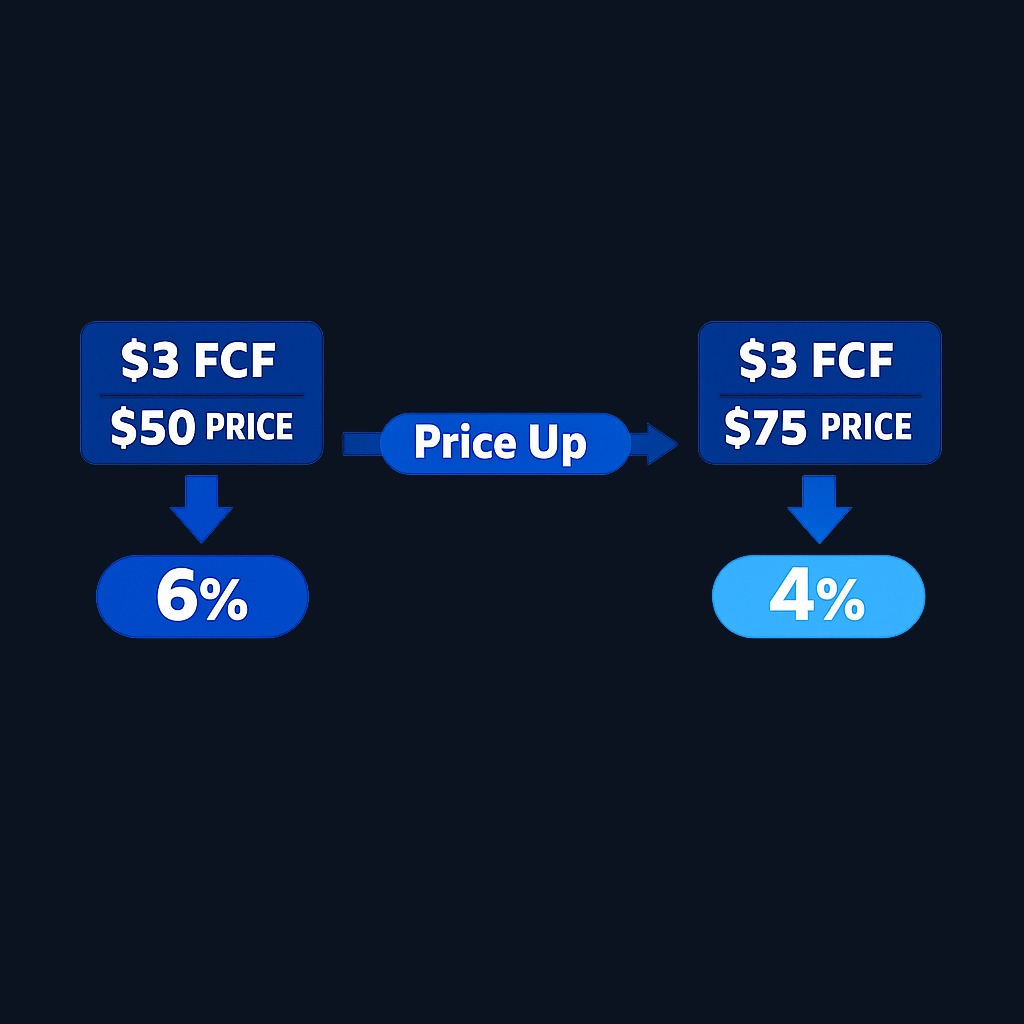
A worked example: a company reports $2.5 billion of operating cash flow and spends $700 million on capital expenditures, leaving $1.8 billion of free cash flow. With 600 million shares outstanding, that is $3 of FCF per share. At a $50 stock price, the free cash flow yield is 3 ÷ 50 = 6%. If the stock rallies to $75 while cash generation stays flat, the yield compresses to 4%: the business did not change, but each invested dollar now buys less cash flow.
Why free cash flow yield matters for investors
The metric earns its place in a toolkit for three reasons. First, it is a valuation lens grounded in cash rather than accounting earnings, which makes it harder for one-time items or aggressive assumptions to flatter the picture. Second, its percentage format allows direct comparison against bond yields, savings rates, and the earnings yield of other stocks, framing every investment as "cash generated per dollar paid". Third, it points toward capacity: a company with a strong free cash flow yield has visible means to fund dividends, buybacks, and debt reduction without borrowing or issuing shares.
Cash-focused valuation also has a defensive quality. Businesses that consistently convert revenue into free cash tend to survive downturns better, since they depend less on capital markets for funding. None of this guarantees returns, and a high yield is sometimes a warning rather than a gift, which is exactly why interpretation matters.
Interpreting free cash flow yield
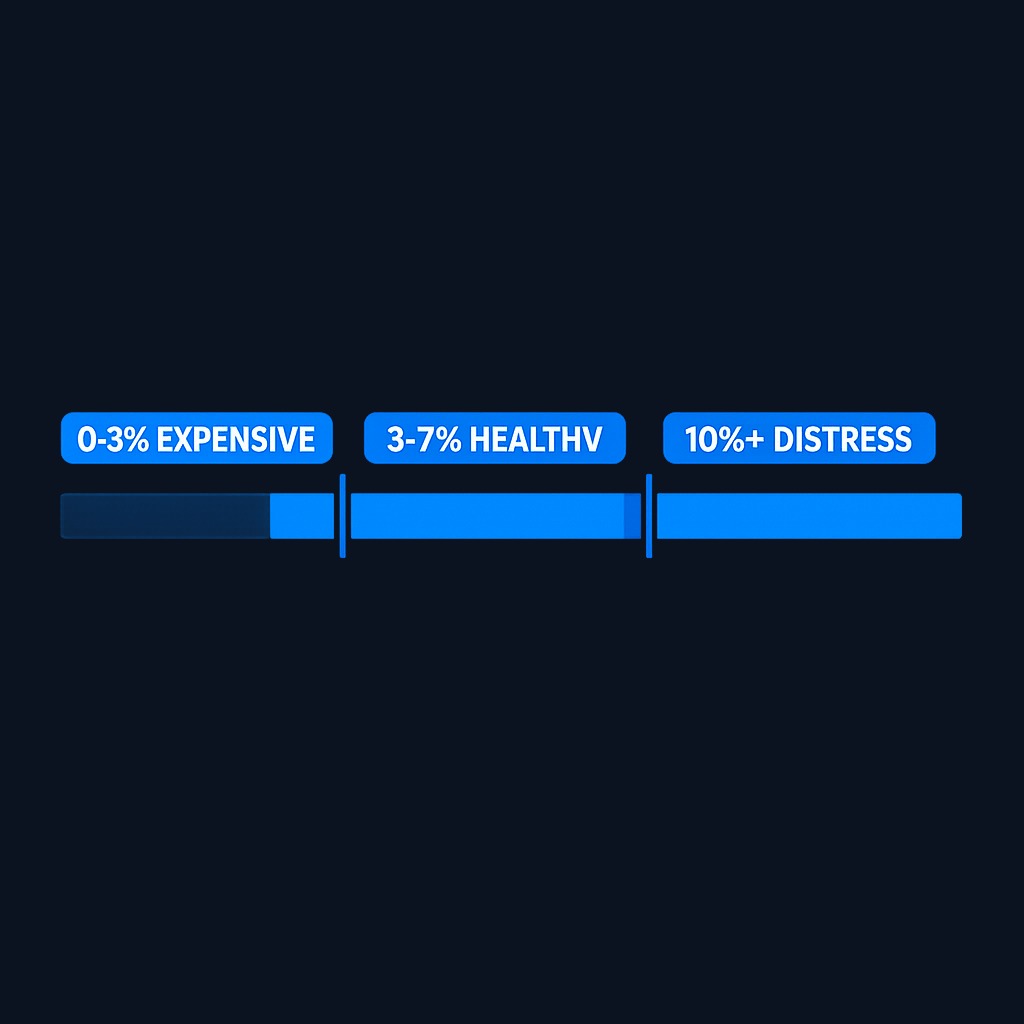
There are no official cutoffs, but a rough reading grid helps orient a first pass:
| FCF yield | Common first read |
|---|---|
| Negative | Company consumes cash; common for young or heavily investing firms |
| 0-2% | Rich pricing; market expects substantial growth in future cash |
| 3-6% | Broadly typical territory for stable, established businesses |
| Above 6-8% | Potentially cheap, or the market doubts the cash flow will last |
Read high yields with suspicion before excitement. A double-digit free cash flow yield can mean the market expects cash generation to fall, a cyclical peak is about to roll over, or the business faces structural decline. Conversely, a low yield is not automatically bad: a company investing heavily today may be building the cash flows of the next decade. The number starts the investigation; the business explains it.
Practice investing with Finelo
Build practical investing skills with guided lessons, simulator practice, and structured challenges.
Comparing free cash flow yield across industries
Capital intensity drives most industry differences. Software and services companies spend relatively little on physical assets, so they often convert a large share of earnings into free cash and can sustain what looks like a rich valuation. Utilities, telecoms, airlines, and manufacturers pour money into infrastructure and equipment, which depresses free cash flow even when the underlying business is healthy.
Two practical rules follow. Compare a company primarily against its own industry peers and its own history, not against the whole market. And check where a company sits in its investment cycle: a manufacturer that just finished a major plant build-out may show a temporarily fat yield, while one entering an expansion phase shows a temporarily thin one. Neither snapshot tells the whole story without that context.
Common pitfalls in calculating free cash flow yield
The metric is simple; the inputs hide traps. Watch for these:
- Lumpy capital spending. Capex arrives in waves, so a single year's FCF can be unusually high or low. Averaging several years smooths the distortion.
- One-time cash boosts. Asset sales, tax refunds, and working-capital swings can inflate operating cash flow temporarily.
- Stock-based compensation. Heavy share issuance returns cash to the statement but dilutes shareholders, quietly overstating per-share cash generation.
- Leases and acquisitions. Some spending that functions like capex shows up elsewhere in the statements, flattering the standard formula.
- Growth capex vs maintenance capex. A company investing to grow looks worse on FCF than one merely maintaining assets, even when the growth spending creates value.
- Negative-yield traps in reverse. Excluding every cash-burning company would have screened out some of the best growth investments in history; a negative yield is information, not an automatic disqualifier.
What to know before deciding
Before you act on a free cash flow yield, verify three things in the filings. Check the trend: one strong year means far less than five consistent ones. Check the composition: how much of the cash flow came from core operations versus working-capital swings or one-off items? Check the obligations: debt maturities, dividend commitments, and lease payments all have claims on that "free" cash before you do. Then place the yield in context against peers, history, and prevailing interest rates. A 7% yield reads differently when safe bonds pay 5% than when they pay 1%.
Decision framework: using free cash flow yield in stock selection
Work through five steps in order. First, screen: rank your candidate list by FCF yield to surface potentially cheap cash generators. Second, verify durability: read the last several cash flow statements and judge whether the cash generation is repeatable. Third, explain the price: identify why the market offers this yield; there is always a reason, and your job is to decide whether it is temporary or permanent. Fourth, cross-check with a second lens such as earnings yield, revenue trend, and debt load, since agreement across metrics strengthens the case. Fifth, size the position with risk in mind, because even careful cash flow analysis cannot remove business risk. A high yield that survives all five steps is a research-backed candidate, not a guaranteed winner.
Conclusion and next steps
Free cash flow yield tells you how much real, spendable cash a business produces per dollar of market price, cutting through accounting noise to the resource that funds dividends, buybacks, and resilience. Interpret it within industries, average it across years, and always explain why the market is offering the yield you see. Next step: pick two companies in the same industry, compute their free cash flow yields from the latest annual filings, and write one sentence explaining each gap; that single exercise teaches more than any definition.
Frequently asked questions
What is a good free cash flow yield?
There is no universal threshold. Many investors read the mid-single digits as healthy for mature companies, but the right comparison is against industry peers, the company's own history, and current bond yields, followed by a durability check on the cash flow itself.
How is free cash flow yield different from earnings yield?
Earnings yield divides accounting profits by price; free cash flow yield divides actual spendable cash by price. The two often diverge when earnings include large non-cash items or when heavy capital spending consumes reported profits. Comparing both reveals how well earnings convert to cash.
Is a negative free cash flow yield always bad?
No. Young companies and firms in heavy investment phases often burn cash deliberately to build future capacity. The question is whether the spending creates durable value and whether the company can fund itself until cash flow turns positive.
Where do I find the numbers to calculate it?
Operating cash flow and capital expenditures appear on the cash flow statement in quarterly and annual reports, available free through the SEC's EDGAR system. Divide the difference by market capitalization, which is the share price times shares outstanding.
freecashflowyield
Practice investing with Finelo
Build practical investing skills with guided lessons, simulator practice, and structured challenges.
About the author
Finelo Team
The Finelo Team creates practical investing and trading education designed to help beginners learn faster with structured challenges, simulator practice, and bite-sized lessons.
Keep reading — Related articles

Investing
Tax-gain harvesting vs. tax-loss harvesting
Compare realizing investment gains with realizing losses, including holding periods, wash sales, offsets, and portfolio tradeoffs.
Finelo Team

Investing
Stable value fund vs. money market fund
Compare investment structure, contract protections, transfer restrictions, net yields, and access inside a retirement account.
Finelo Team

Investing
Single-life vs. joint-life annuity
Compare income for one lifetime with continued payments to a survivor, using equal premiums and matching guarantee terms.
Finelo Team


