Methodology note: Maximum drawdown is the largest peak-to-trough decline in the chosen return series over a stated window. Results depend on dates, frequency, currency, total-return treatment, fees, and whether the series is marked reliably. Asset-class ranges require a named index and period. A lower drawdown is not automatically preferable without matching return, exposure, liquidity, period, and cost.
What Is Maximum Drawdown and Why It Matters for Investors
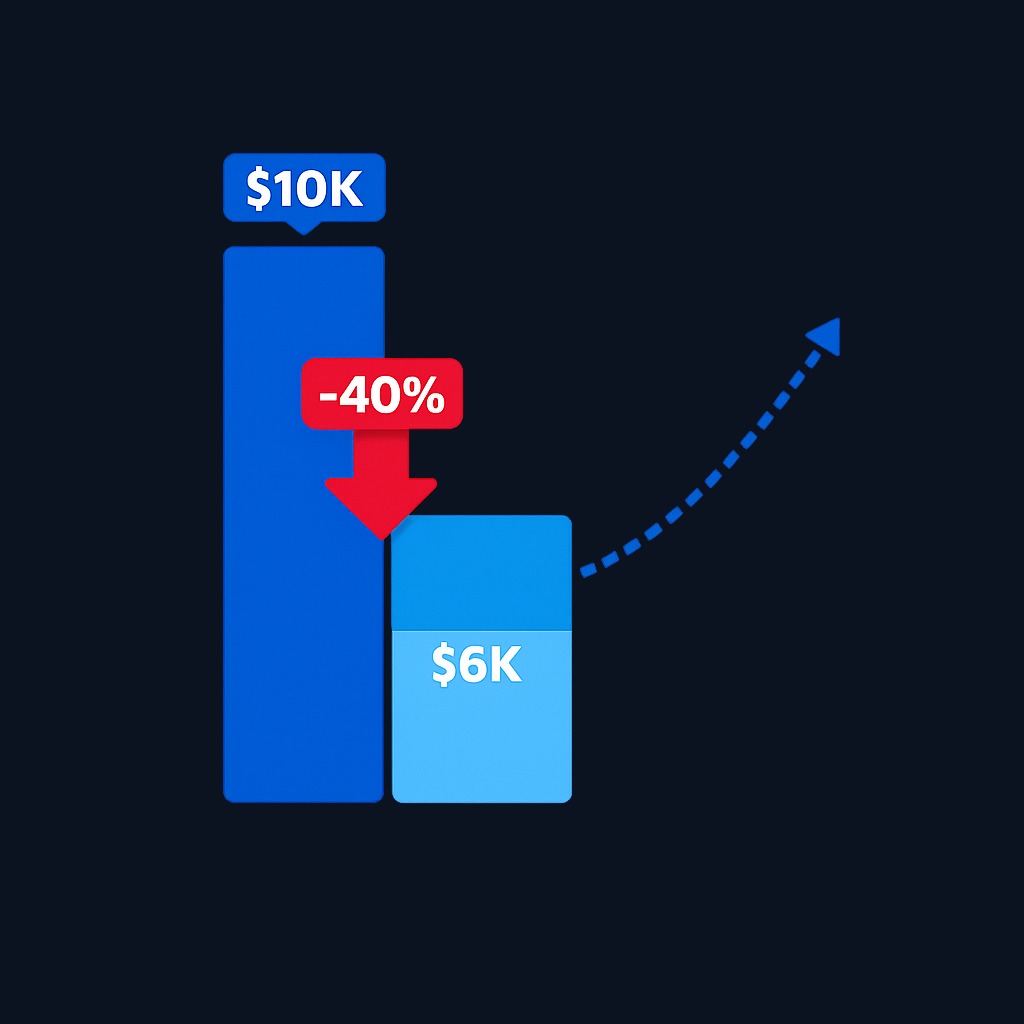
Maximum drawdown is the largest peak-to-trough loss a portfolio or investment has suffered over a period, expressed as a percentage of the peak value. If an account grows to $10,000, falls to $6,000, and later recovers,…
8 min read
Practice investing with Finelo
Build practical investing skills with guided lessons, simulator practice, and structured challenges.
Want to learn more?
Build practical investing skills with guided lessons, simulator practice, and structured challenges.
Explore FineloExplore Finelo's 28-day challenges
Turn learning into a daily habit with guided challenge paths.
Maximum drawdown is the largest peak-to-trough loss a portfolio or investment has suffered over a period, expressed as a percentage of the peak value. If an account grows to $10,000, falls to $6,000, and later recovers, its maximum drawdown is 40%. This page is for investors and traders who want a practical way to measure downside risk beyond simple volatility, and for anyone comparing funds, strategies, or their own track record. Learn the formula, what counts as a deep drawdown, and how to keep the number survivable, then check the drawdown of your own portfolio before you add risk.
How to calculate maximum drawdown
The formula is straightforward:
Maximum drawdown = (Trough value − Peak value) / Peak value × 100
The peak is the highest point before a decline, and the trough is the lowest point before a new high is made. The calculation ignores everything except the worst single fall from a high.
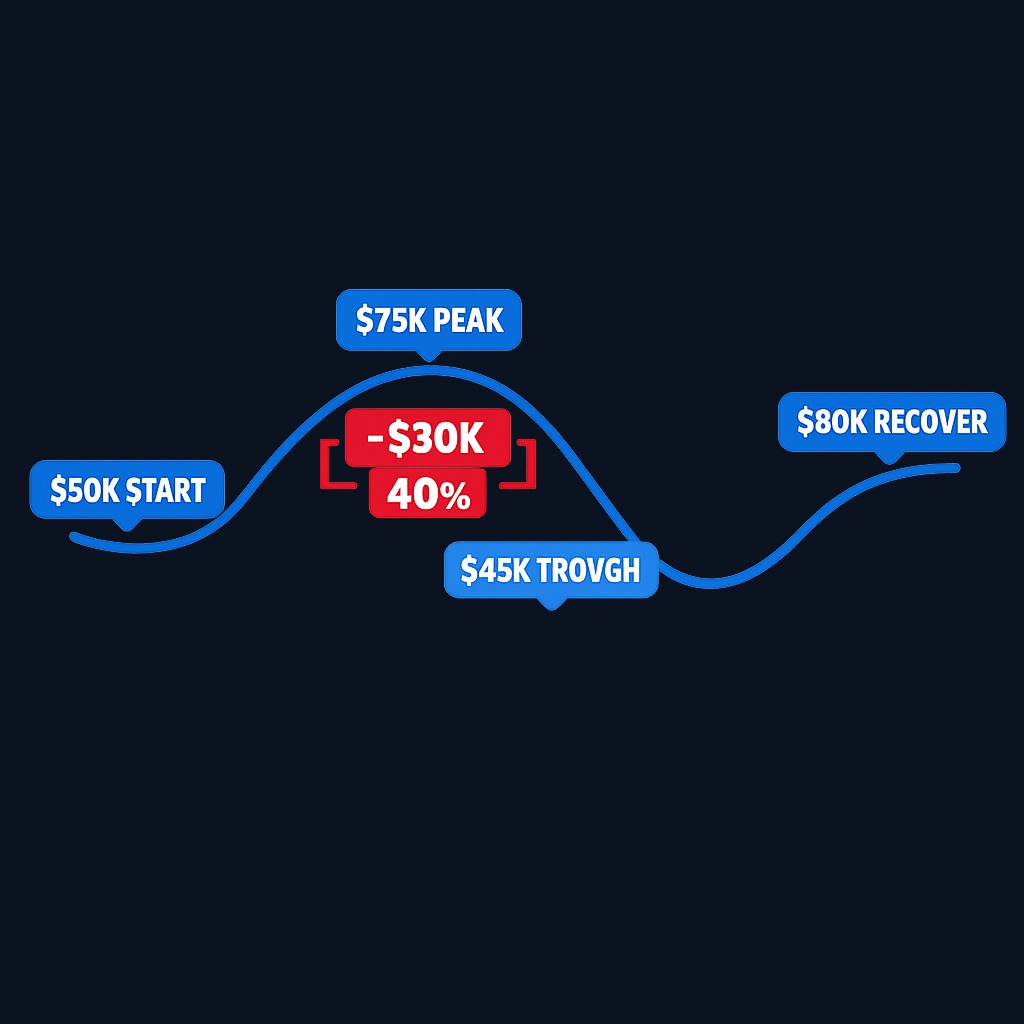
Walk through an example. A portfolio starts at $50,000 and climbs to $75,000. A rough market takes it down to $45,000. It then recovers to $80,000. The relevant peak is $75,000 and the trough is $45,000:
($45,000 − $75,000) / $75,000 = −40%
The maximum drawdown is 40%, even though the account ended higher than it started. Note three things. First, the measure is a percentage of the peak, not of your starting deposit. Second, a new maximum drawdown can only be set when a fall from a fresh high exceeds every previous fall. Third, the time between peak and trough can be short or span years; the basic number says nothing about duration, so many investors track the recovery time alongside it.
Why maximum drawdown matters for risk management
Volatility tells you how bumpy the ride is; maximum drawdown tells you how bad the worst moment actually got. That makes it one of the most intuitive risk measures an investor can use.
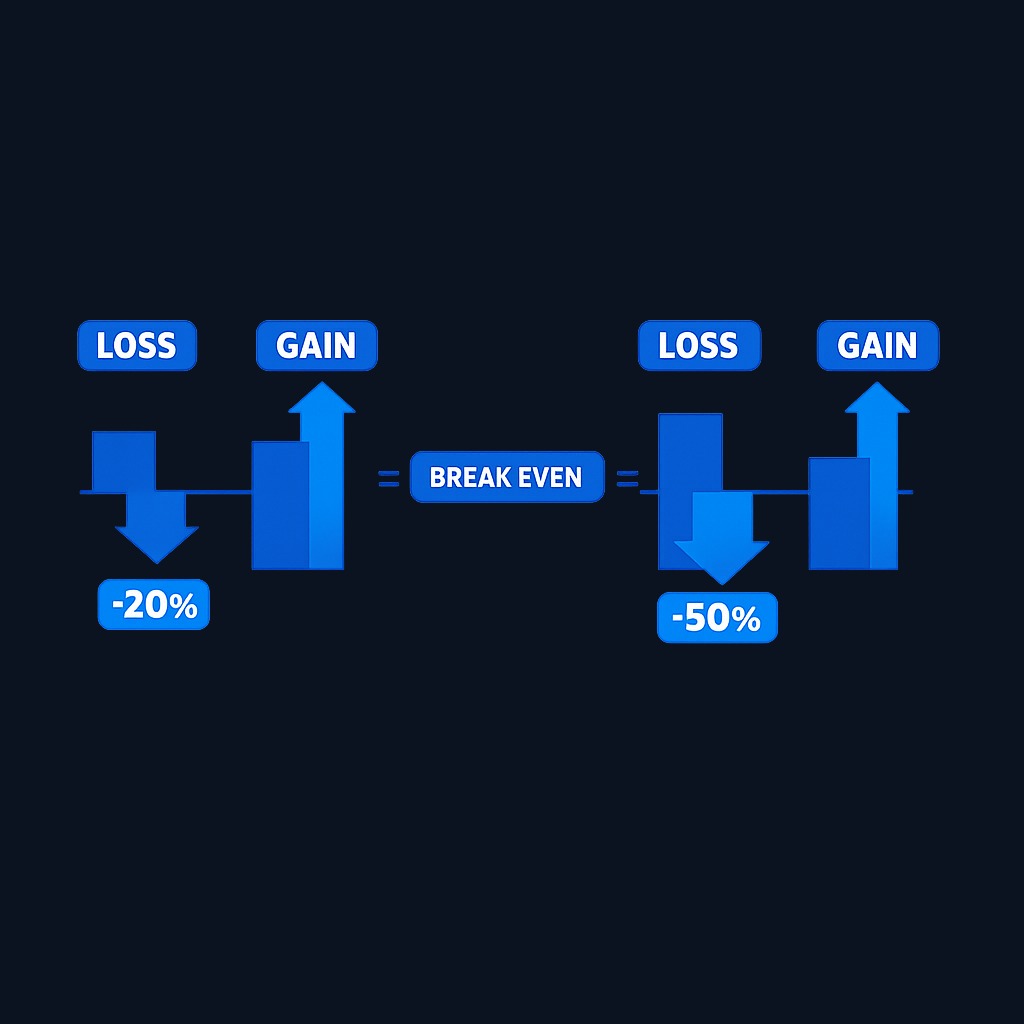
The math of losses is asymmetric. A 20% drawdown needs a 25% gain to break even. A 50% drawdown needs a 100% gain. Deep drawdowns are therefore not just uncomfortable; they consume the time and compounding your plan depends on. A strategy with slightly lower returns and much shallower drawdowns often beats a flashier one after a full market cycle, simply because it loses less ground that must be regained.
Drawdown can help frame behavioral capacity. If a documented, like-for-like track record shows a 35% maximum drawdown, ask whether the allocation and spending plan could survive a similar or larger decline. Historical maximum drawdown is not a worst-case bound, and risk capacity is broader than a questionnaire response.
Fund analysts use the measure the same way. When comparing two funds with similar returns, the one with the smaller historical maximum drawdown delivered those returns with less severe damage along the way, which also usually means a better risk-adjusted profile.
Maximum drawdown across asset classes
Different assets live in different drawdown worlds, and knowing the neighborhood helps you set expectations:
| Asset class | Typical drawdown character |
|---|---|
| Broad stock indexes | Results vary by named index, currency, total-return treatment, and measurement period |
| Individual stocks | Can lose most of their value and never recover; single names carry the deepest drawdown risk |
| Investment-grade bonds | Usually shallower declines, though rate shocks can still produce double-digit drawdowns (benchmark yields are published in the Federal Reserve's H.15 selected interest rates release) |
| Cash and equivalents | Minimal nominal drawdown, but purchasing power erodes with inflation |
| Crypto assets | Results vary materially by asset, venue, data quality, currency, and start/end dates |
The pattern is consistent: higher long-run return potential tends to come packaged with deeper and longer drawdowns. There is no allocation that maximizes growth and minimizes drawdown at the same time; there is only the trade-off you choose deliberately.
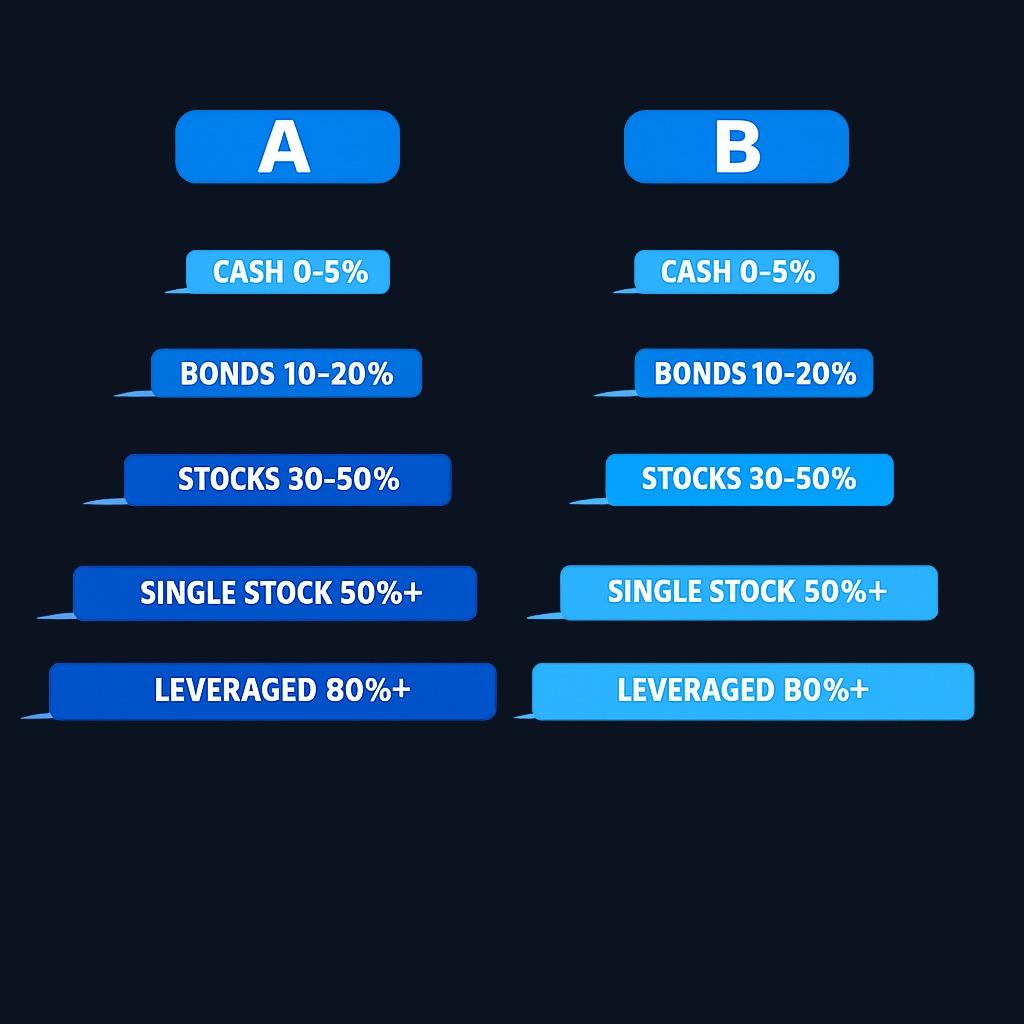
Strategies to keep drawdowns survivable
You cannot eliminate drawdowns, but you can shape them:
- Diversify across assets that fall at different times. Spreading money across stocks, bonds, and other assets is the classic way to soften portfolio-level declines. See diversification for the mechanics.
- Size positions so no single loss is fatal. Concentration is how ordinary drawdowns become account-ending ones.
- Use exit rules for active trades. Traders cap individual trade drawdowns with a stop-loss placed before entry, when judgment is still calm.
- Keep a cash buffer. Money you will need within a few years does not belong in assets that can spend years underwater. The principle is simple: match the investment to the horizon.
- Rebalance on a schedule. Trimming winners and adding to laggards keeps your intended risk level from drifting upward in good times, which is exactly when future drawdown risk builds.
- Average in over time. Contributing steadily through declines, known as dollar-cost averaging, turns part of a drawdown into cheaper purchases rather than pure pain.
Practice investing with Finelo
Build practical investing skills with guided lessons, simulator practice, and structured challenges.
What to know before deciding
Maximum drawdown is a backward-looking statistic. It describes the worst that has happened in the measured window, not the worst that can happen; the next cycle can always set a deeper record. It is also period-sensitive: a fund launched after a crash will show a flattering drawdown history simply because it missed the storm.
The raw number also hides duration. Two strategies can share a 30% maximum drawdown while one recovered in six months and the other took five years. When you evaluate any track record, look at the depth, the length of the underwater period, and how often meaningful drawdowns occurred. And because a single statistic never captures a strategy, read it alongside volatility, risk-adjusted return measures, and plain common sense about what drove the losses.
Decision framework: how to use maximum drawdown in your plan
- Choosing between funds or strategies? Prefer the one whose historical drawdown you could genuinely endure, not just the higher-return line on the chart.
- Building your first portfolio? Pick an allocation whose realistic worst case would not force you to sell; a shallower planned drawdown you can hold beats a deeper one you abandon.
- Actively trading? Track your own equity-curve drawdown weekly and set a hard limit that triggers a break and review when hit.
- Nearing a spending goal? Shift toward assets with historically shallow drawdowns as the date approaches, because recovery time is the one resource you no longer have.
FAQ
What is a good maximum drawdown?
There is no universal threshold. Use a named benchmark and matched period, then judge the result against the strategy's objectives, return, exposure, liquidity, and your capacity to bear losses.
How is maximum drawdown different from volatility?
Volatility measures the typical size of ups and downs around an average. Maximum drawdown isolates the single worst peak-to-trough decline. A strategy can have modest volatility and still carry a history of one devastating fall, which is exactly what drawdown reveals.
Does maximum drawdown predict future losses?
No. It is a historical record, useful for setting expectations and comparing strategies, but the future can produce deeper declines than anything in the data.
How do I reduce my portfolio's maximum drawdown?
Diversify across asset classes, size positions modestly, keep short-horizon money out of risky assets, rebalance regularly, and use predefined exit rules for active trades. Each step trades some upside for a shallower, more survivable worst case.
Conclusion and next steps
Maximum drawdown answers the question every investor eventually asks: how bad did it get? Calculate it for your own portfolio, compare it against what you honestly believe you can endure, and adjust allocation, position sizes, and rules until the worst case is one you can live through without abandoning the plan. Risk you can survive is the price of returns; risk you cannot survive is just a countdown.
InvestingFundamental AnalysisBeginner
Practice investing with Finelo
Build practical investing skills with guided lessons, simulator practice, and structured challenges.
About the author
Finelo Team
The Finelo Team creates practical investing and trading education designed to help beginners learn faster with structured challenges, simulator practice, and bite-sized lessons.
Keep reading — Related articles

Investing
Tax-gain harvesting vs. tax-loss harvesting
Compare realizing investment gains with realizing losses, including holding periods, wash sales, offsets, and portfolio tradeoffs.
Finelo Team

Investing
Stable value fund vs. money market fund
Compare investment structure, contract protections, transfer restrictions, net yields, and access inside a retirement account.
Finelo Team

Investing
Single-life vs. joint-life annuity
Compare income for one lifetime with continued payments to a survivor, using equal premiums and matching guarantee terms.
Finelo Team


