Methodology note: Use after-tax operating profit (NOPAT) divided by average invested capital over the period. Define excess cash, leases, goodwill, acquired intangibles, restructuring items, and the tax rate consistently. CFA Institute's financial-ratio list provides a standard operating formula. Compare ROIC with WACC only when definitions, period, currency, and capital base are compatible; there is no universal 8–10% cost of capital or 20% “elite” cutoff.
What Is Return on Invested Capital (ROIC) and Why It Matters
Return on invested capital (ROIC) measures how much after-tax operating profit a company generates for every dollar of capital invested in the business: ROIC = NOPAT ÷ invested capital. A company earning more than its…
9 min read
Practice investing with Finelo
Build practical investing skills with guided lessons, simulator practice, and structured challenges.
Want to learn more?
Build practical investing skills with guided lessons, simulator practice, and structured challenges.
Explore FineloExplore Finelo's 28-day challenges
Turn learning into a daily habit with guided challenge paths.
Return on invested capital (ROIC) measures how much after-tax operating profit a company generates for every dollar of capital invested in the business: ROIC = NOPAT ÷ invested capital. A company earning more than its cost of capital is creating value; one earning less is destroying it, no matter how fast revenue grows. This page is for investors and students who want to use return on invested capital to separate genuinely great businesses from merely big ones. Work through the calculation and interpretation below, then practice on real companies with guided lessons in the Finelo app.
What is return on invested capital?
ROIC answers the most fundamental question in business analysis: how well does this company turn investor money into profit? It compares the operating profit the business produces, after tax, against all the capital tied up to produce it - both the shareholders' equity and the borrowed money.
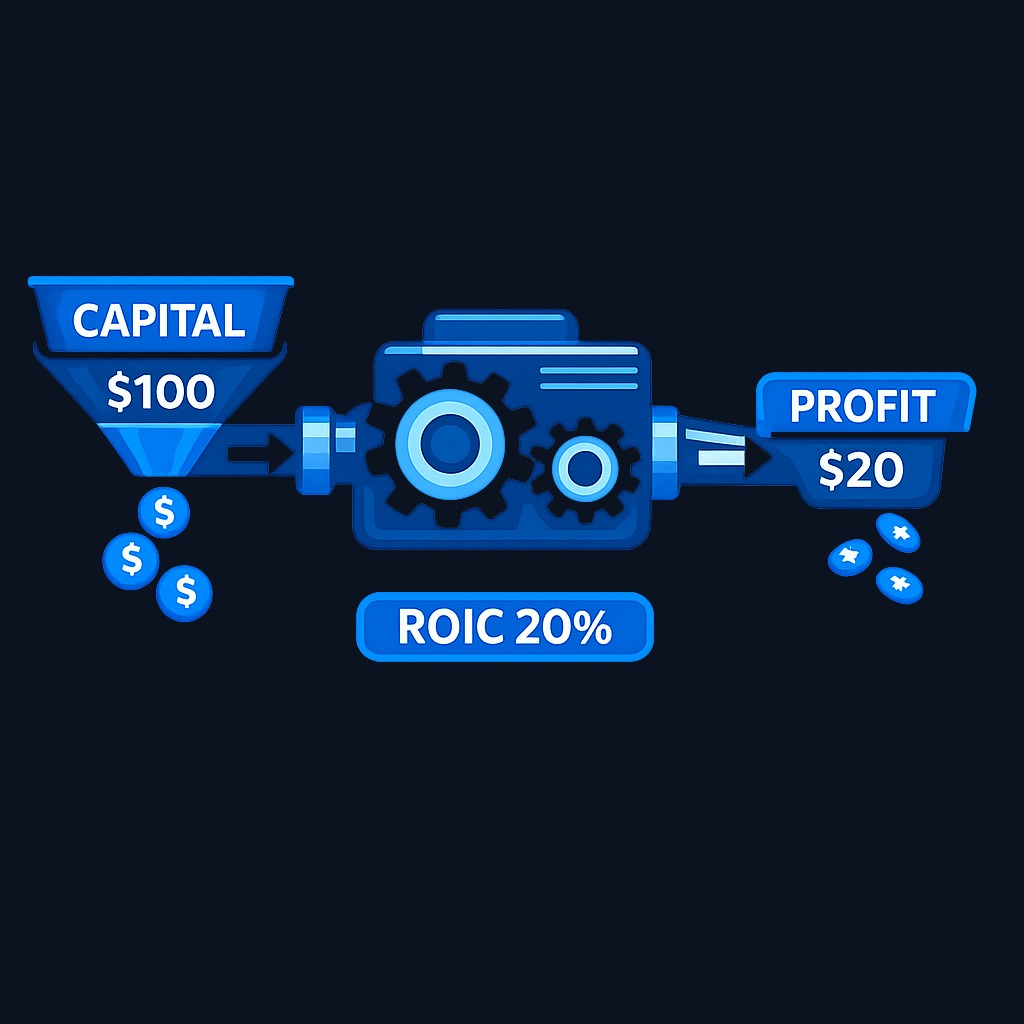
Think of a company as a machine. Investors and lenders feed capital in one end; operating profits come out the other. ROIC is the machine's efficiency rating. A 20% ROIC means every $100 of capital inside the machine generated $20 of after-tax operating profit this year. A 4% ROIC means the same $100 produced only $4 - likely less than the capital cost to raise.
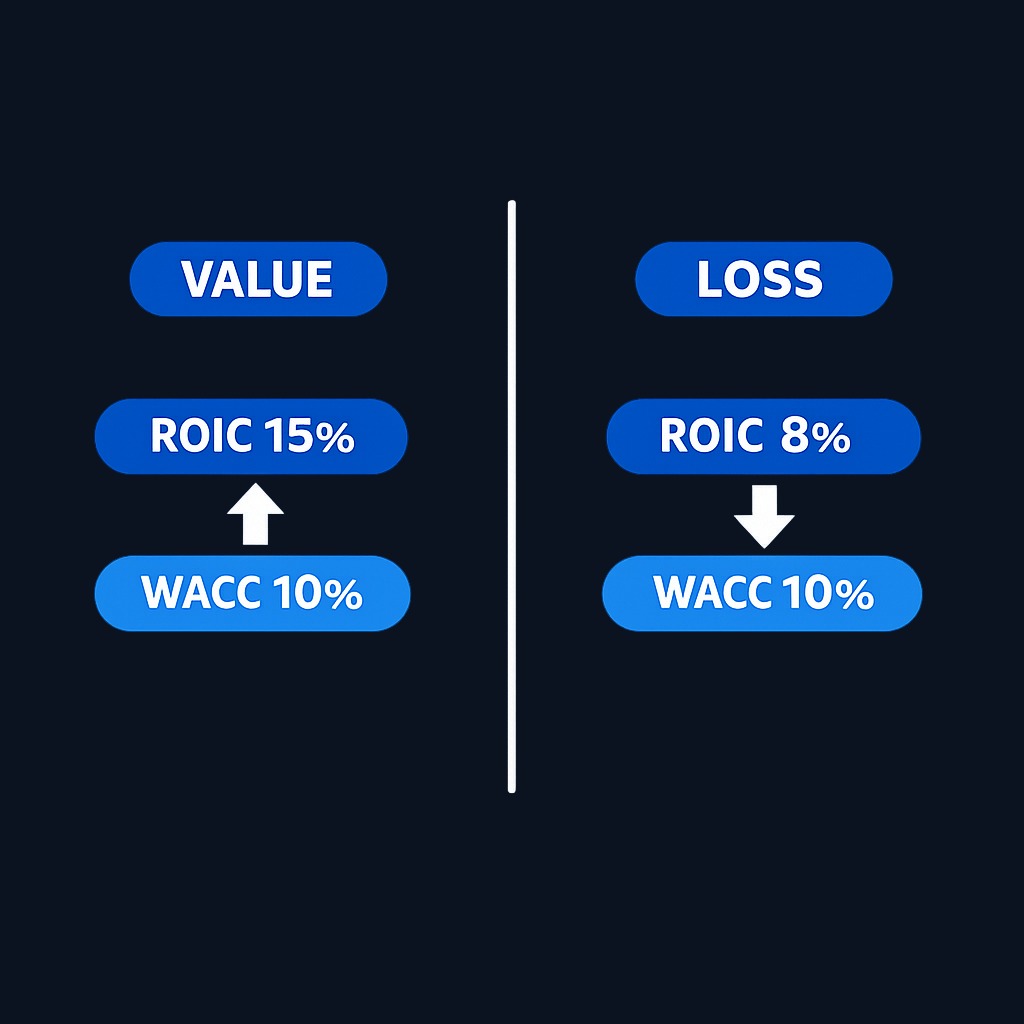
That comparison against the cost of capital is what gives the metric meaning. Capital is never free: equity investors expect returns, and lenders charge interest. When ROIC exceeds the blended cost of that capital, each new dollar invested makes owners wealthier. When ROIC sits below it, growth actually accelerates value destruction, because the company keeps pouring money into a machine that returns less than the money costs.
How to calculate roic
The formula is:
ROIC = NOPAT ÷ Invested capital
| Input | How to derive it |
|---|---|
| NOPAT | Operating income × (1 − tax rate) |
| Invested capital | Total debt + shareholders' equity − excess cash, or equivalently net working capital + fixed assets |
NOPAT - net operating profit after tax - starts with operating income (EBIT) and removes taxes as if the company had no debt. Using operating profit keeps financing choices out of the numerator, so companies with different debt loads stay comparable.
Invested capital is every dollar deliberately deployed in operations. The most common shortcut adds interest-bearing debt to shareholders' equity and subtracts cash beyond what operations need, since idle cash is not really "invested."
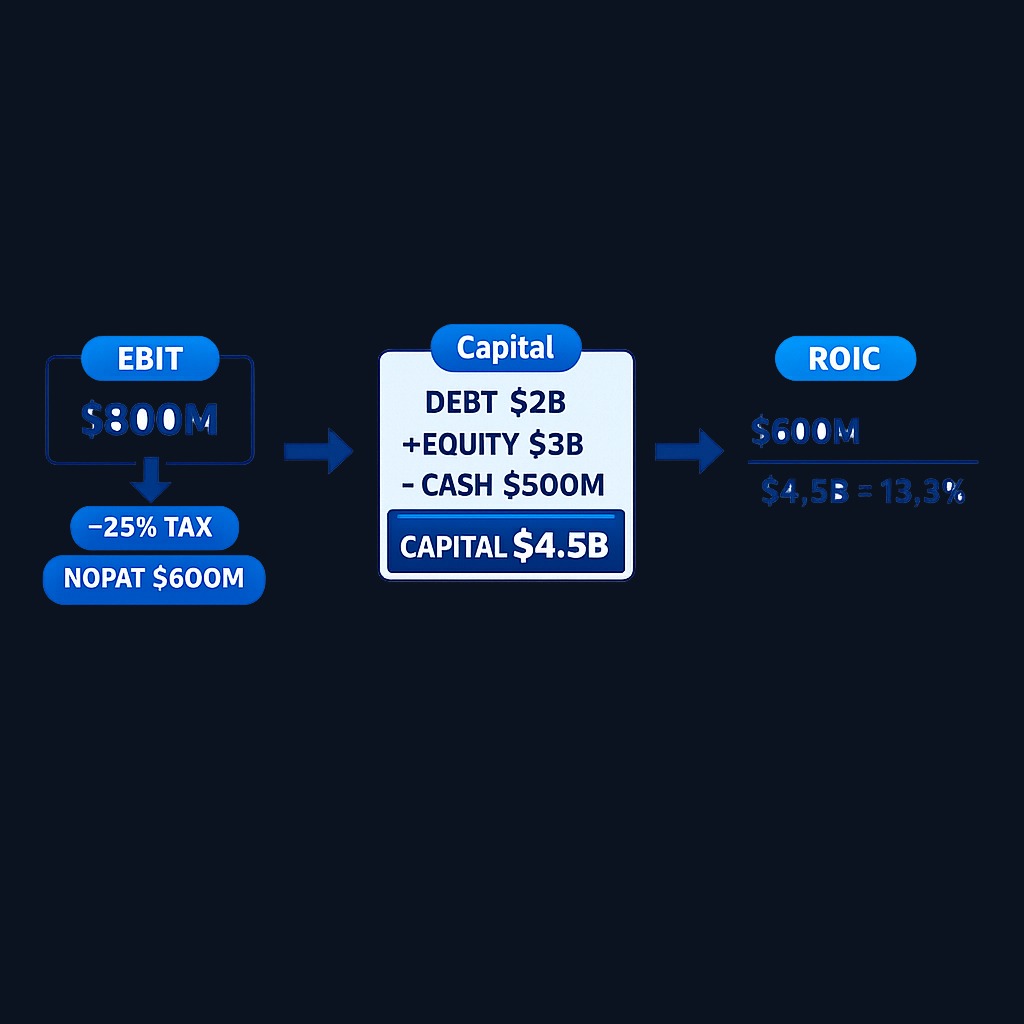
A worked example: a company reports $800 million of operating income and pays an effective tax rate of 25%, giving NOPAT of $600 million. It carries $2 billion of debt and $3 billion of equity, with $500 million of excess cash. Invested capital is $4.5 billion. ROIC = 600 ÷ 4,500 = about 13.3%.
Every input comes from the income statement and balance sheet of public filings, which you can access free through the SEC's EDGAR database. Use average invested capital across the year when the balance sheet moved materially.
Why roic matters for investors
Three reasons ROIC earns its reputation as a quality metric:
- It defines value creation. Growth is only worth paying for when it comes at returns above the cost of capital. High-ROIC growth compounds wealth; low-ROIC growth burns it. Two companies growing revenue at the same rate can have opposite effects on shareholder value.
- It reveals competitive advantage. Sustained high returns attract competition, and competition normally grinds returns down toward the cost of capital. A company that holds ROIC well above that level for a decade is demonstrating some durable edge - a brand, network effect, switching cost, or cost advantage - in numbers rather than narrative.
- It disciplines management judgment. Every retained dollar management reinvests should clear the ROIC hurdle. Investors can compare a company's reinvestment rate and its ROIC to estimate how fast intrinsic value should compound.
Comparing roic with other financial metrics
| Metric | Formula | Blind spot |
|---|---|---|
| ROIC | NOPAT ÷ invested capital | Complex to compute consistently |
| ROE | Net income ÷ equity | Leverage inflates it |
| ROA | Net income ÷ total assets | Mixes financing and operations |
| Profit margin | Income ÷ revenue | Ignores capital required |
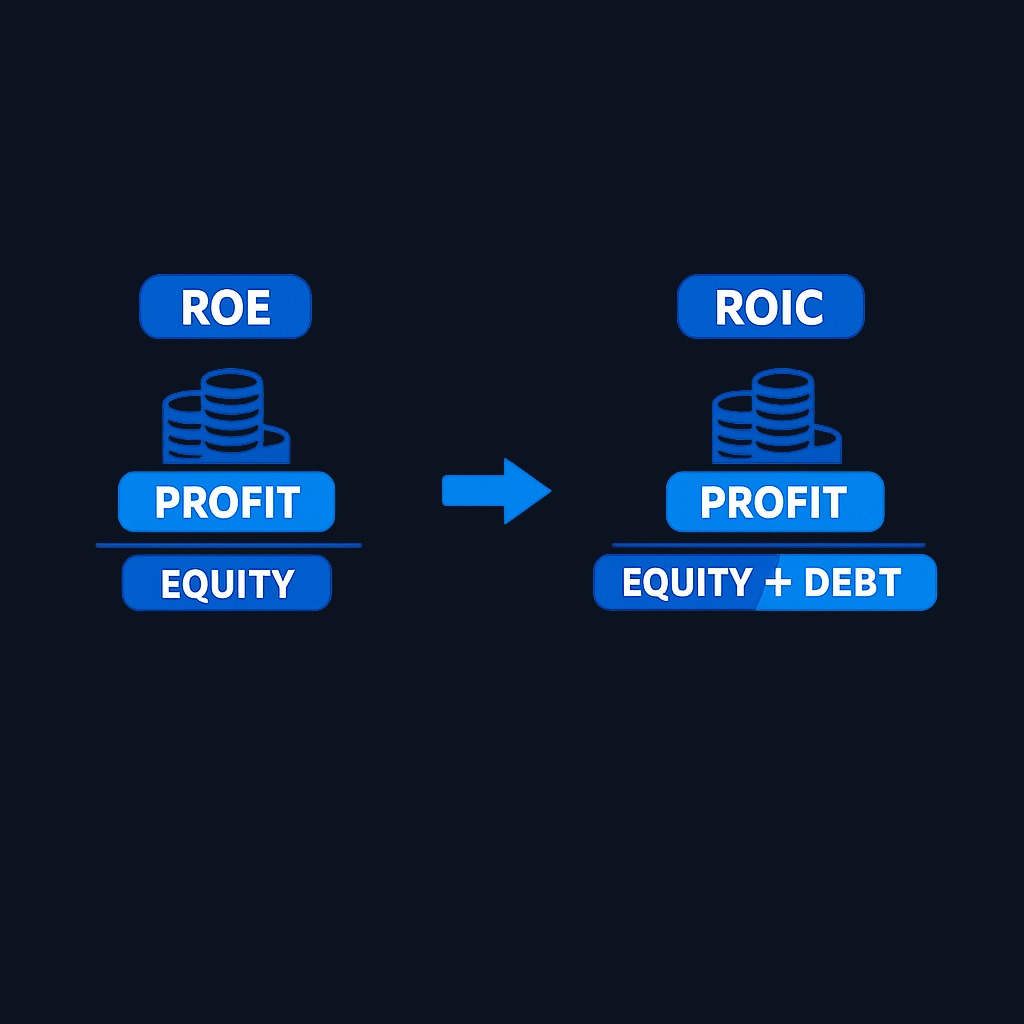
ROE is the most popular cousin, but debt flatters it: a company can double ROE simply by borrowing more, without improving the business at all. ROIC neutralizes that trick by counting debt in the denominator. ROA includes every asset, even idle cash and goodwill from old acquisitions, so it blurs operating performance. Margins ignore the balance sheet entirely - a 30%-margin business that needs enormous capital can be worse than a 10%-margin business that needs almost none.
The practical pairing: use ROIC to judge business quality, ROE to see what shareholders earn after financing choices, and the gap between them to understand how much leverage is doing the work.
Common pitfalls in calculating roic
- Goodwill decisions. Including goodwill measures management's acquisition record; excluding it measures the underlying business's economics. Both are legitimate - just be consistent and know which question you are asking.
- Excess cash left in. Leaving a giant cash pile in invested capital drags ROIC down and understates operating quality.
- One-year snapshots. A single great year can reflect a cyclical peak. Average NOPAT across a cycle, or track ROIC across five to ten years, before drawing conclusions.
- Operating leases and adjustments. Capital-intensive companies with heavy lease obligations need consistent treatment of those liabilities, or cross-company comparisons break.
- Tax noise. One-time tax benefits can inflate NOPAT; use a normalized tax rate for a fairer picture.
Practice investing with Finelo
Build practical investing skills with guided lessons, simulator practice, and structured challenges.
What high and low roic look like in practice
Asset-light businesses can report high ROIC because the accounting denominator may omit internally developed intangible capital and because growth can require less recorded property. Investigate the capitalized-versus-expensed distinction and durability rather than using a 20% label.
Capital-heavy businesses require substantial reinvestment and can show cyclical ROIC. Compare the measure with a company-specific, consistently defined cost of capital and consider regulation, asset age, replacement cost, and the cycle rather than assuming a 6–8% hurdle.
The lesson is not "avoid capital-intensive industries." It is that the price you pay should reflect the returns the machine can actually generate. A mediocre-ROIC business at a deep discount can outperform a brilliant one bought at any price.
How companies improve roic
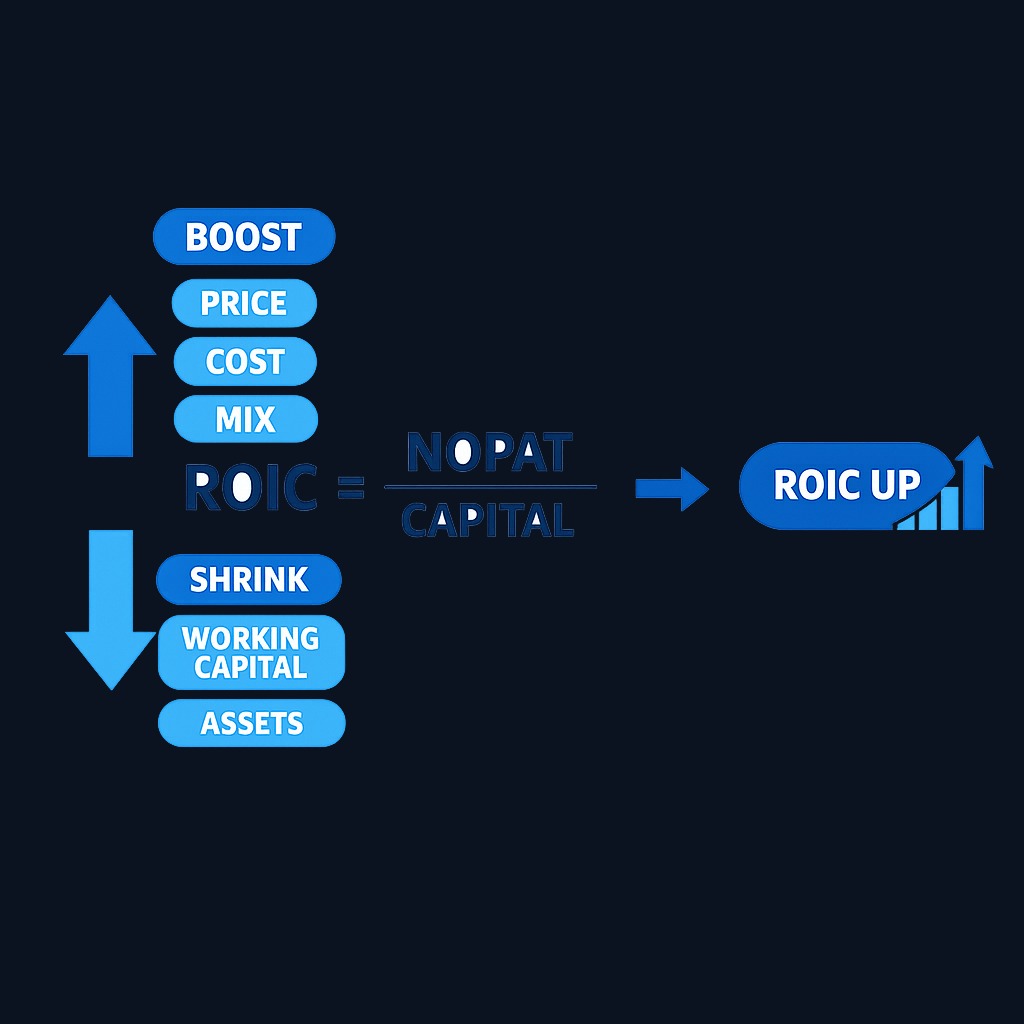
Management teams work both ends of the fraction. On the numerator: raising prices, cutting costs, and shifting mix toward higher-margin products lift NOPAT. On the denominator: tightening working capital, selling underperforming divisions, and disciplined capital budgeting shrink invested capital. Share buybacks, notably, do not improve ROIC - they change the financing mix, not the operating machine.
For investors, the trajectory matters. A rising ROIC often marks a business hitting scale advantages or pruning weak segments; a sliding one can flag eroding pricing power years before margins visibly collapse.
What to know before deciding
ROIC is a quality thermometer, not a complete investment case. It says nothing about valuation - wonderful businesses can be terrible investments at the wrong price. Definitions vary across data providers, so numbers from different screeners rarely match; recompute it yourself for anything you take seriously. Young companies investing ahead of revenue can show low or negative ROIC while building genuinely valuable positions, and cyclical companies can show spectacular ROIC at exactly the wrong moment to buy. Read the metric across time, across peers, and beside a valuation discipline.
Decision framework: using roic in stock analysis
- Compute five-plus years of history to see level and trend through a cycle.
- Compare against the company's cost of capital. The spread, not the absolute number, defines value creation.
- Benchmark against direct competitors to separate industry economics from company skill.
- Check the reinvestment runway. High ROIC plus abundant reinvestment opportunities is the compounding jackpot; high ROIC with nowhere to deploy it means cash returns instead.
- Cross-check with ROE and leverage to see how financing amplifies or masks the operating story.
- Then, and only then, ask about price relative to the quality you have established.
FAQ
What is a good roic?
An ROIC estimate above a consistently measured WACC can indicate value creation, but both inputs contain estimation choices and uncertainty. Avoid universal 8–10% or 20% cutoffs; compare the spread, reinvestment, trend, and peer definitions.
What is the difference between roic and roe?
ROE measures net income against shareholders' equity alone, so borrowing can inflate it. ROIC measures after-tax operating profit against equity plus debt, which isolates the operating business from financing choices.
Is a high roic always better?
Generally yes for quality, but pair it with reinvestment opportunity and price. A high-ROIC business with no room to redeploy capital compounds slowly, and even the best business can be overpriced.
Where do I find the inputs for roic?
Operating income and taxes come from the income statement; debt, equity, and cash from the balance sheet. Public-company filings on EDGAR contain everything needed.
Conclusion and next steps
Return on invested capital is the cleanest single lens on business quality: it tells you what the operating machine earns on the money entrusted to it, before financing tricks and accounting noise. Learn to compute it consistently, judge it against the cost of capital, and watch its trend across years and competitors. Then let valuation decide whether quality is worth the price. To turn the concept into a reliable habit, practice full ROIC workups on real filings with Finelo's structured lessons and simulations.
InvestingFundamental AnalysisFinancial StatementsBeginner
Practice investing with Finelo
Build practical investing skills with guided lessons, simulator practice, and structured challenges.
About the author
Finelo Team
The Finelo Team creates practical investing and trading education designed to help beginners learn faster with structured challenges, simulator practice, and bite-sized lessons.
Keep reading — Related articles

Investing
Tax-gain harvesting vs. tax-loss harvesting
Compare realizing investment gains with realizing losses, including holding periods, wash sales, offsets, and portfolio tradeoffs.
Finelo Team

Investing
Stable value fund vs. money market fund
Compare investment structure, contract protections, transfer restrictions, net yields, and access inside a retirement account.
Finelo Team

Investing
Single-life vs. joint-life annuity
Compare income for one lifetime with continued payments to a survivor, using equal premiums and matching guarantee terms.
Finelo Team


