Methodology note: Receivables turnover ideally equals net credit sales divided by average trade receivables. Net credit sales are often undisclosed, so total revenue is a proxy and must be labeled. DSO = days in the period ÷ turnover only when both metrics use the same period, sales proxy, and average-receivables convention. Use multiple balance-sheet dates for seasonal firms and inspect aging, allowances, write-offs, and factoring.
What Is the Accounts Receivable Turnover Ratio?

The accounts receivable turnover ratio measures how many times a company collects its average outstanding customer credit balances during a period, usually a year. It is calculated as net credit sales divided by average…
8 min read
Practice investing with Finelo
Build practical investing skills with guided lessons, simulator practice, and structured challenges.
Want to learn more?
Build practical investing skills with guided lessons, simulator practice, and structured challenges.
Explore FineloExplore Finelo's 28-day challenges
Turn learning into a daily habit with guided challenge paths.
The accounts receivable turnover ratio measures how many times a company collects its average outstanding customer credit balances during a period, usually a year. It is calculated as net credit sales divided by average accounts receivable, and a higher number generally means faster collection and healthier cash flow. This page is for investors reading financial statements, students learning ratio analysis, and business owners tracking their own collections. Learn the formula and the worked example first, then use the interpretation and improvement sections to put the number in context.
The formula is only the start; the sales proxy, averaging method, payment terms, and receivables quality determine whether a high or low result is informative.

How to calculate the accounts receivable turnover ratio
Accounts receivable turnover = Net credit sales ÷ Average accounts receivable
The pieces:
- Net credit sales are sales made on credit, minus returns and allowances. Cash sales are excluded because they never create a receivable.
- Average accounts receivable is typically the beginning balance plus the ending balance for the period, divided by two. Averaging smooths out seasonal spikes at the period ends.
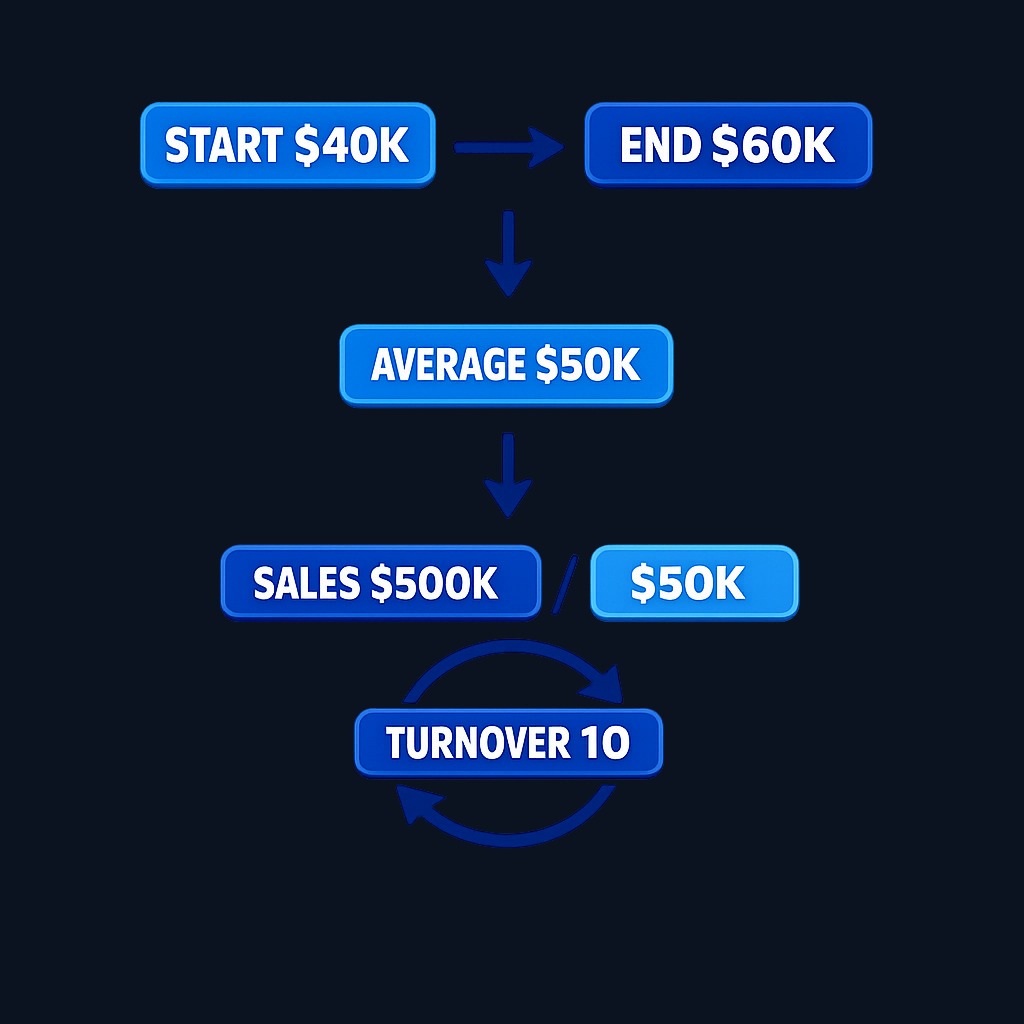
A worked example: suppose a company reports net credit sales of $500,000 for the year, receivables of $40,000 at the start of the year, and $60,000 at the end. Average receivables are ($40,000 + $60,000) ÷ 2 = $50,000. The turnover ratio is $500,000 ÷ $50,000 = 10. The company collected its average receivables balance ten times over the year.
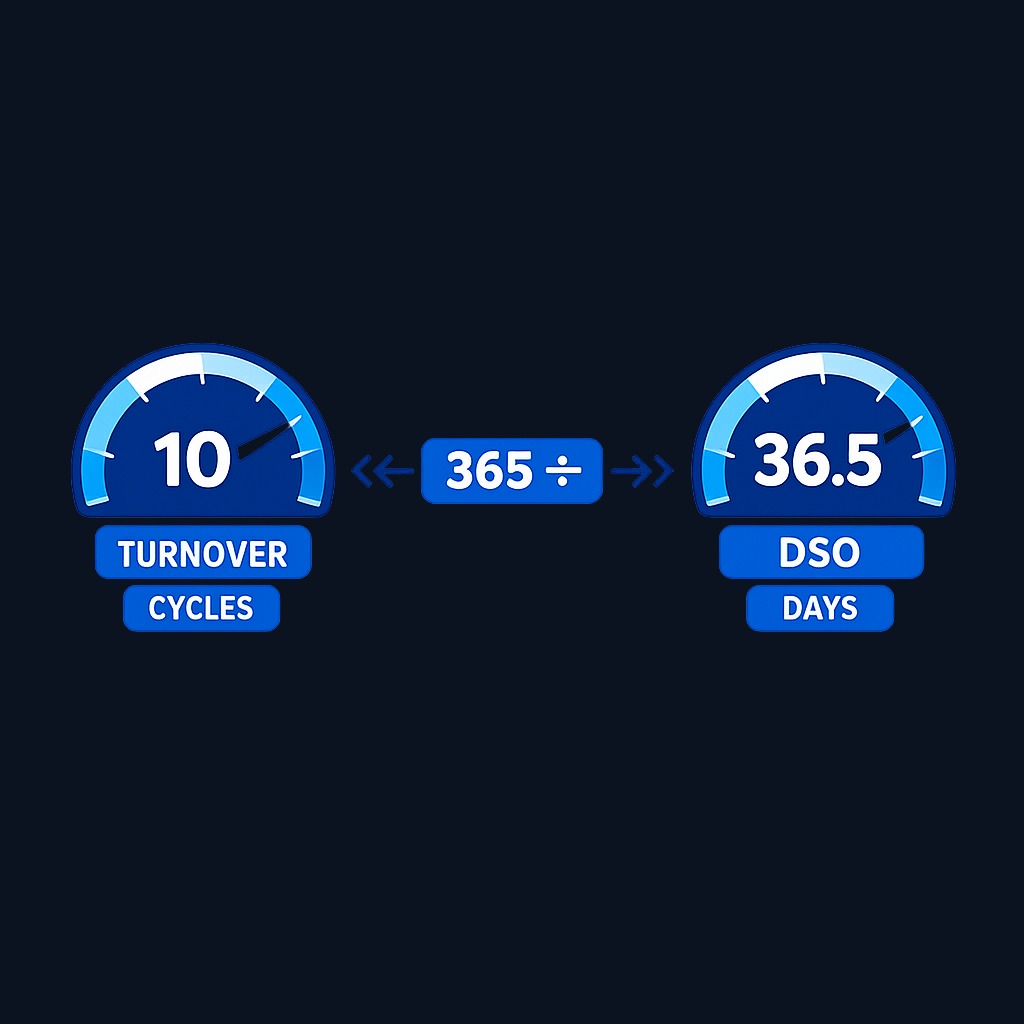
A companion metric converts the same inputs into days. For an annual calculation using the same sales proxy and average receivables, DSO = 365 ÷ turnover; here, 365 ÷ 10 = 36.5 days. Use the actual days in shorter periods and do not interpret the result as the exact collection time for every invoice.

One practical note: public companies rarely disclose credit sales separately, so outside analysts often substitute total revenue in the numerator. That is acceptable for comparisons as long as you use the same convention for every company you compare.
Why the accounts receivable turnover ratio matters
Receivables are sales that have not become cash yet, and cash pays the bills. The turnover ratio tells you how quickly the gap closes:
- Cash flow health. Faster collection means the company finances less of its customers' purchasing and needs less working capital to run.
- Credit policy quality. The ratio reflects how well the company screens customers and enforces terms. Deteriorating turnover often precedes bad-debt write-offs.
- Earnings quality. Revenue growth paired with slowing collections is a classic warning sign: sales may be inflated by loose credit terms rather than genuine demand.
- Operational discipline. Invoicing speed, dispute resolution, and follow-up processes all show up in this one number.
For investors, the ratio is a liquidity and quality check that raw revenue numbers hide. For operators, it is a management dashboard item tied directly to survival, since profitable companies can still fail waiting on unpaid invoices.
Interpreting the number and industry variations
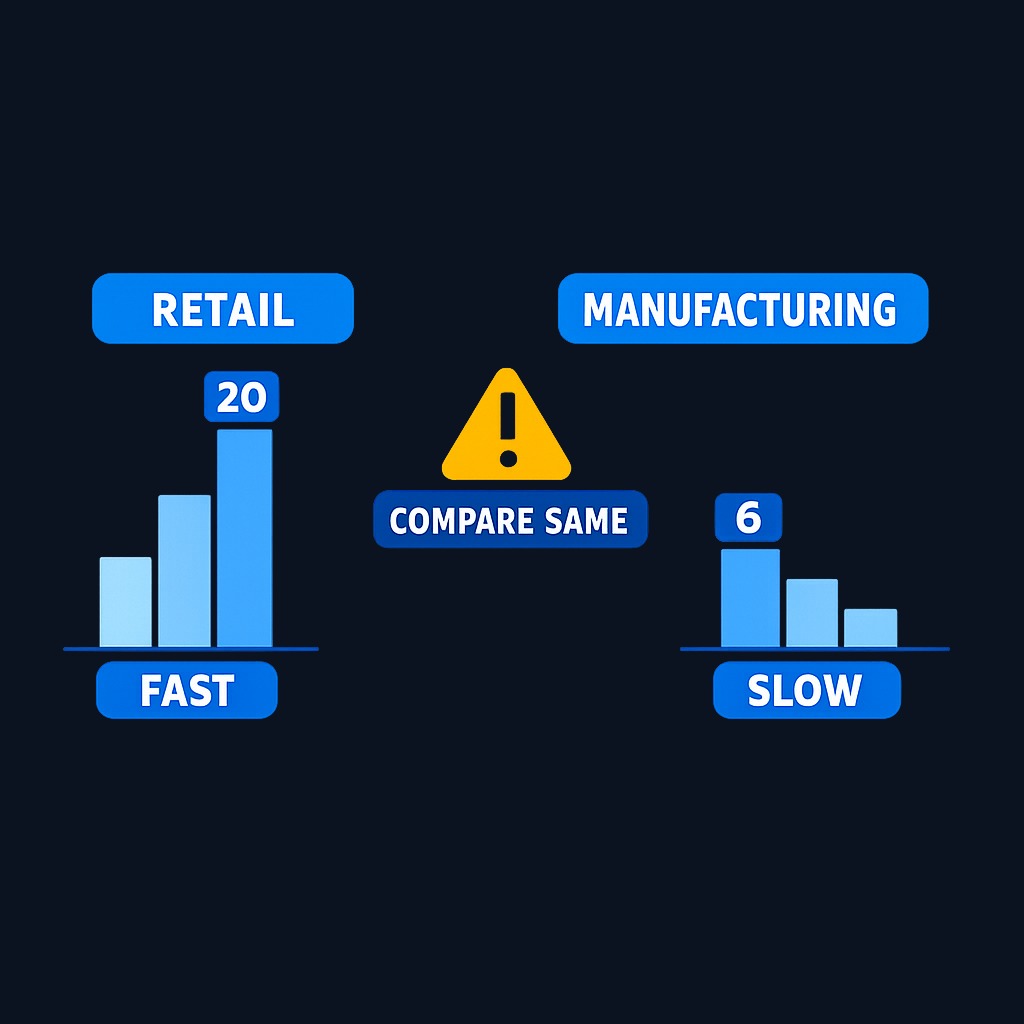
There is no universal good value; payment norms differ enormously by industry. A grocery business with mostly cash and card sales can show extremely high turnover, while an industrial equipment supplier selling on net-60 terms will structurally sit far lower. Sensible interpretation follows three rules:
- Compare within the industry. A ratio of 6 may be strong in heavy manufacturing and alarming in retail.
- Compare against the company's own history. A slide from 10 to 7 over two years is a trend worth investigating regardless of industry norms.
- Compare against stated payment terms. If terms are net 30 but DSO runs at 55 days, customers are paying nearly a month late on average.
Also read the direction with nuance. An extremely high ratio is not automatically ideal: it can indicate credit terms so strict that the company turns away creditworthy customers a looser competitor happily serves. As with most financial ratios, the extremes on both ends invite questions rather than verdicts. Public companies' receivables balances and revenue appear in the financial statements filed with the SEC, freely accessible through the EDGAR database, which makes the calculation reproducible for any listed business.
Strategies to improve the ratio
For business operators, improving turnover is mostly process work:
- Invoice immediately and accurately. Delayed or disputed invoices add days before the clock even starts.
- Tighten credit screening. Check new customers' payment history before extending terms, and set credit limits proportional to trust.
- Make paying easy. Electronic invoicing and multiple payment methods remove friction that slows remittance.
- Offer early-payment incentives carefully. Small discounts for fast payment can accelerate cash, though they trade margin for speed.
- Systematize follow-up. Reminders before the due date and prompt escalation after it beat sporadic collection pushes.
- Review terms by segment. Chronic late payers may warrant shorter terms, deposits, or cash-only status.
Each tactic shortens the sale-to-cash cycle, and the ratio simply reports the aggregate result.
Practice investing with Finelo
Build practical investing skills with guided lessons, simulator practice, and structured challenges.
Common pitfalls in calculating and using the ratio
- Using total sales when credit sales are available. Mixing conventions inflates the ratio and breaks comparability.
- Skipping the averaging step. Using only the year-end receivables balance distorts the ratio for seasonal businesses.
- Ignoring one-off events. A large acquisition, a divestiture, or a change in revenue recognition can move the ratio without any change in collection behavior.
- Reading it alone. Turnover interacts with inventory and payables; a full working-capital view, including the inventory turnover ratio, tells the real story.
- Treating it as precise. The ratio is an average across all customers; a healthy overall number can hide one large, deteriorating account.
What to know before deciding
If you are using this ratio to judge a stock, anchor on trend and context: a stable or improving ratio alongside growing revenue supports earnings quality, while decelerating collections during rapid growth deserve skepticism. If you are using it to manage a business, pair it with an aging schedule, which shows exactly which invoices are how overdue, because the average conceals the outliers that become write-offs. In both cases, one period tells you little; three or more years of the same calculation, done the same way, is the minimum for a fair read.
Decision framework: acting on the ratio
| Your intent | Recommended next step |
|---|---|
| Evaluating a stock | Compute the ratio for three years from filings and compare with two industry peers |
| Spot-checking earnings quality | Compare receivables growth with revenue growth; receivables growing faster is the flag |
| Managing your own business | Track DSO monthly and reconcile it against your stated payment terms |
| Fixing slow collections | Start with invoicing speed and follow-up cadence before tightening customer credit |
| Learning ratio analysis | Practice the calculation on one real company's filings end to end |
FAQ
What is a good accounts receivable turnover ratio?
It depends on the industry and payment terms. The useful benchmarks are industry peers, the company's own history, and its stated terms. A ratio implying collections far slower than the terms suggest is the clearest warning sign.
What is the difference between receivable turnover and days sales outstanding?
They are the same information in different units. DSO equals 365 divided by the turnover ratio, converting collection speed into average days from sale to payment.
Is a very high turnover ratio always good?
Mostly, but not always. Extremely high turnover can mean credit policies are so restrictive that the company sacrifices sales competitors capture. Balance matters.
Why would a company's turnover ratio decline?
Common causes include loosened credit terms to boost sales, deteriorating customer finances, invoicing or dispute problems, and acquisitions that add slower-paying revenue. The trend flags the question; the aging schedule and filings supply the answer.
Next steps. Pick one public company, pull its revenue and receivables from its latest annual report, and compute the turnover ratio and DSO yourself; the exercise cements the concept faster than any definition. To build broader fluency with financial statements and ratios, the Finelo app breaks these skills into short interactive lessons.
InvestingFundamental AnalysisFinancial StatementsBeginner
Practice investing with Finelo
Build practical investing skills with guided lessons, simulator practice, and structured challenges.
About the author
Finelo Team
The Finelo Team creates practical investing and trading education designed to help beginners learn faster with structured challenges, simulator practice, and bite-sized lessons.
Keep reading — Related articles

Investing
Tax-gain harvesting vs. tax-loss harvesting
Compare realizing investment gains with realizing losses, including holding periods, wash sales, offsets, and portfolio tradeoffs.
Finelo Team

Investing
Stable value fund vs. money market fund
Compare investment structure, contract protections, transfer restrictions, net yields, and access inside a retirement account.
Finelo Team

Investing
Single-life vs. joint-life annuity
Compare income for one lifetime with continued payments to a survivor, using equal premiums and matching guarantee terms.
Finelo Team


