Methodology note: “The yield curve” can mean different spreads. The New York Fed's recession-probability model uses the 10-year Treasury yield minus the 3-month Treasury bill rate and estimates the probability of recession twelve months ahead. The 10y–2y spread and near-term-forward spread are different signals. Inversion reflects expected future short rates and term premia, supply, demand, and risk—not only an expectation of rate cuts.
What Is Yield Curve Inversion and Why Does It Matter?
Yield curve inversion happens when short-term government bonds pay higher yields than long-term ones, flipping the normal relationship between time and reward. The most-watched version is the U.S. Treasury curve, where…
7 min read
Practice investing with Finelo
Build practical investing skills with guided lessons, simulator practice, and structured challenges.
Want to learn more?
Build practical investing skills with guided lessons, simulator practice, and structured challenges.
Explore FineloExplore Finelo's 28-day challenges
Turn learning into a daily habit with guided challenge paths.
Yield curve inversion happens when short-term government bonds pay higher yields than long-term ones, flipping the normal relationship between time and reward. The most-watched version is the U.S. Treasury curve, where inversions of the 2-year versus 10-year, or 3-month versus 10-year, spreads have preceded most modern U.S. recessions. This page is for investors who keep hearing that "the curve inverted" and want to know what it actually measures, why it inverts, and what, if anything, to do about it. Read the explanation below, then resist the urge to overhaul a long-term plan based on any single indicator.
Understanding the yield curve
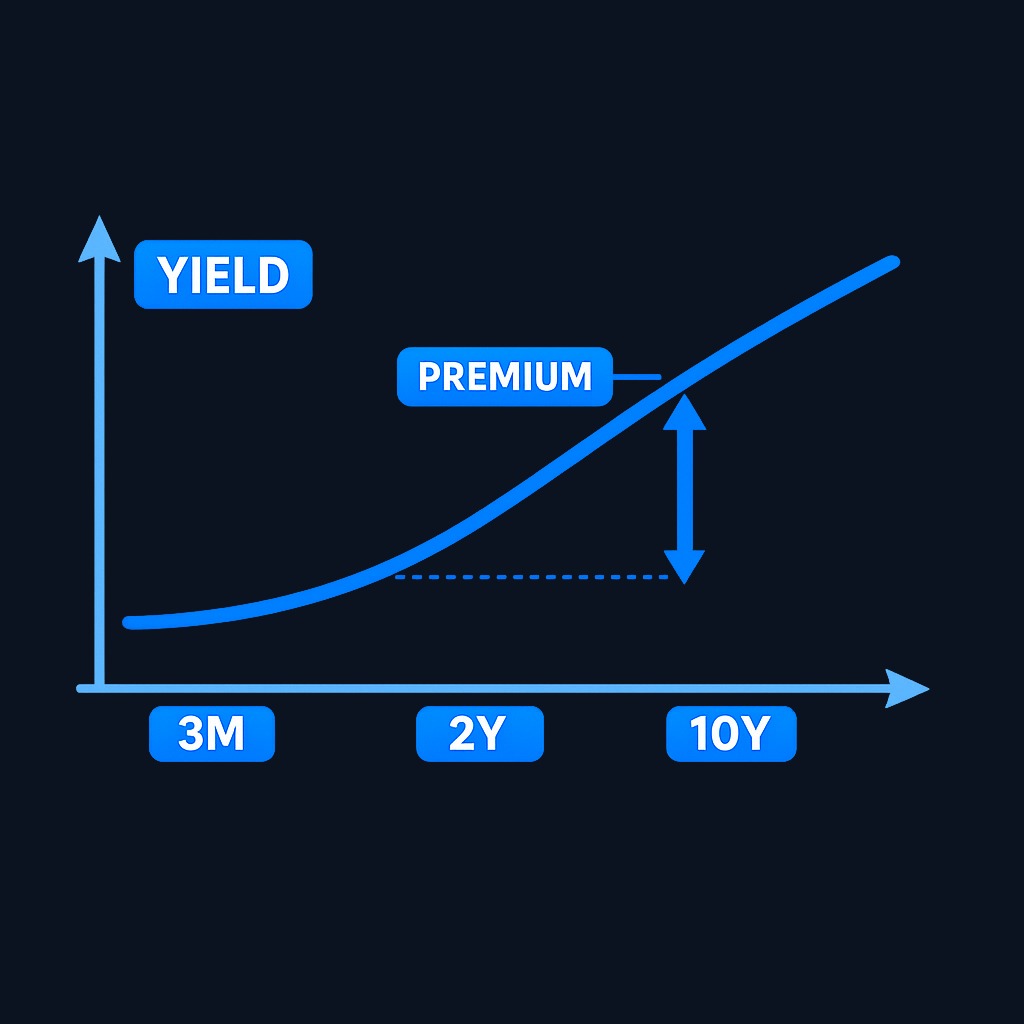
The yield curve is a line plotting the yields of government bonds against their maturities, from short bills to long bonds. Current yields across maturities are published in the Federal Reserve's H.15 selected interest rates release, which is the raw data behind most yield-curve charts you see.
In normal times, the curve slopes upward. Lending money for ten years ties up capital longer and carries more uncertainty than lending for three months, so investors demand extra yield for the longer commitment. That extra is called the term premium.
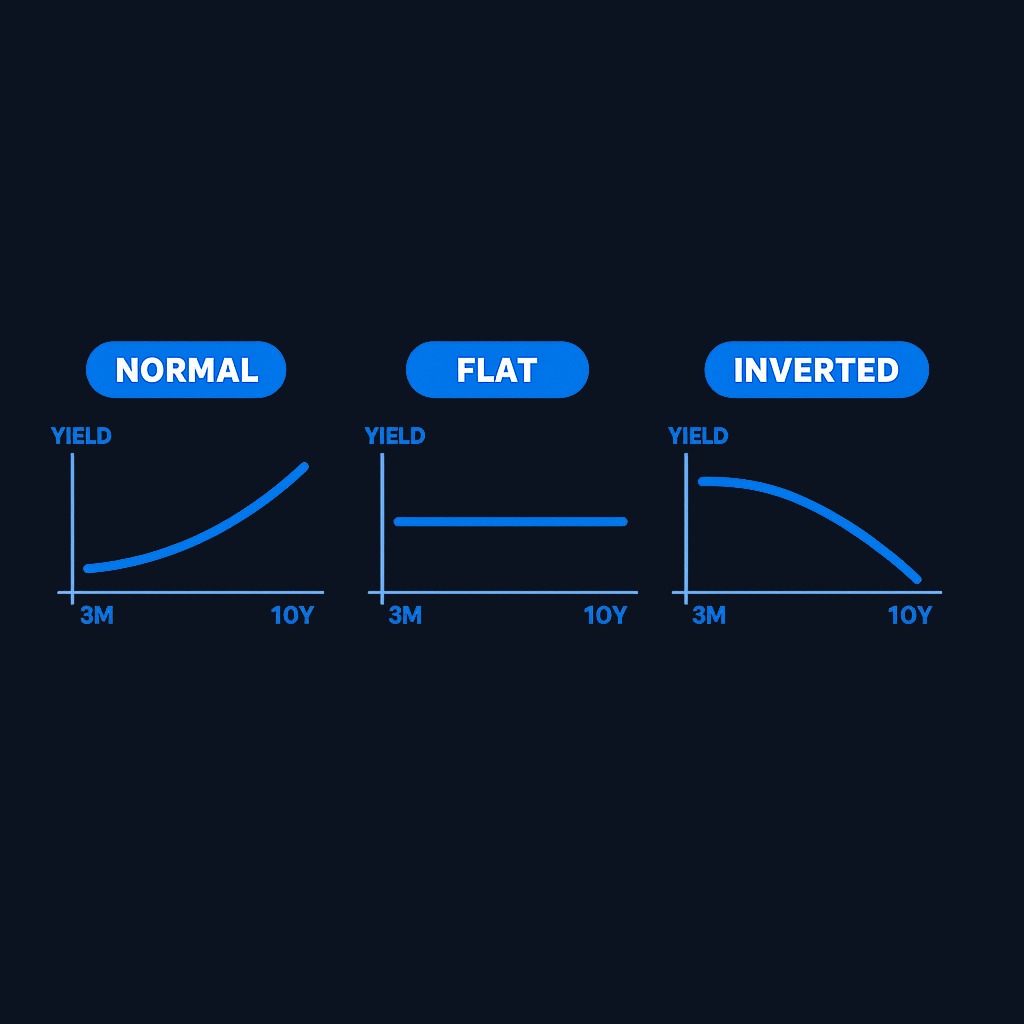
Three broad shapes matter:
- Normal (upward sloping). Long yields exceed short yields; markets expect ordinary growth.
- Flat. Short and long yields converge; markets are unsure about the path of rates and growth.
- Inverted. A specified short yield exceeds a specified long yield. Expected future short rates and term premia both contribute, so inversion cannot be reduced to one forecast of rate cuts or recession.
A bond's yield reflects both current central-bank policy and expectations of future policy. That dual role is what turns the curve's shape into an economic signal.
What causes yield curve inversion?
Inversion is a tug-of-war between the two ends of the curve.
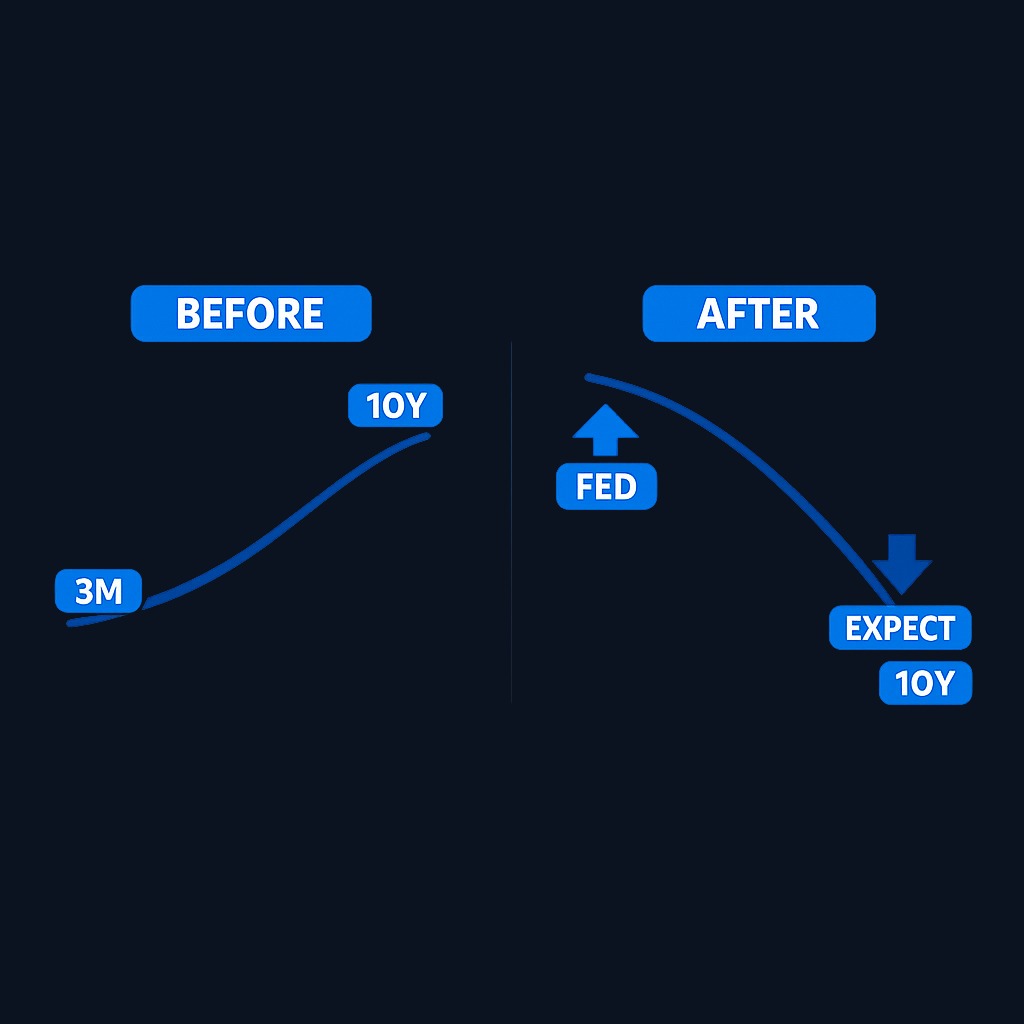
The short end tracks the central bank. When the Federal Reserve raises its policy rate to fight inflation, yields on bills and short notes climb almost mechanically.
The long end tracks expectations. Ten-year yields embed the market's forecast of average short rates over the next decade, plus a term premium. If investors believe today's high rates will slow the economy and force cuts later, their forecast of future short rates falls, pulling long yields down even as short yields rise.
When policy tightening pushes the short end above the market's expectation of the long-run path, the curve inverts. In plain terms: an inverted curve is the bond market saying it expects today's rates to prove unsustainable.
Flight-to-safety flows can deepen the effect. In nervous markets, investors buy long Treasuries for shelter, pushing long yields down further.
What history shows about inversions
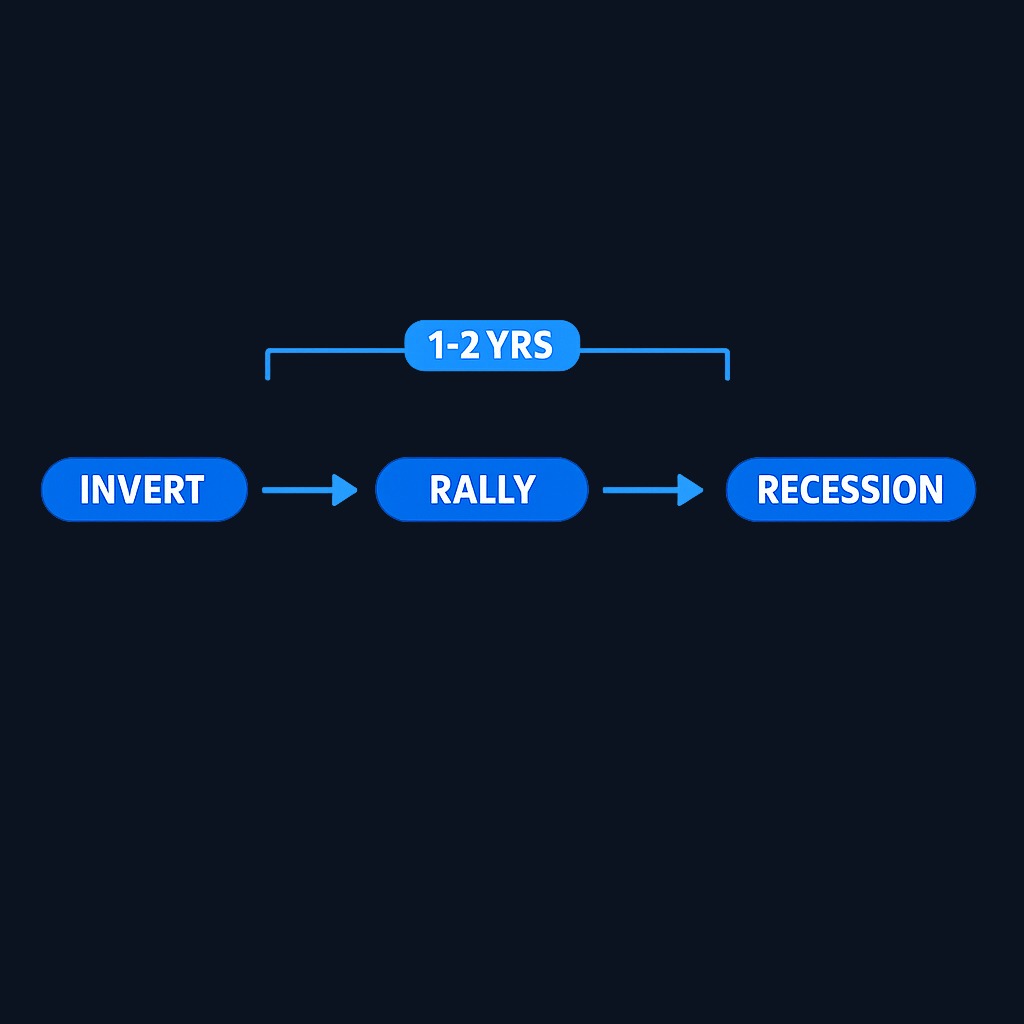
The inverted curve earned its reputation as a recession signal honestly. In the modern U.S. record, inversions of the widely watched spreads have preceded most recessions, usually with a lag of roughly one to two years. That track record is why a single basis-point flip in the 2s10s spread generates headlines.
The record also carries warnings. The lag is long and variable, so the signal says little about timing. Markets have sometimes rallied substantially between an inversion and the eventual downturn, punishing investors who fled immediately. And an indicator can weaken once everyone watches it: policy responses, changed inflation dynamics, and structural demand for long bonds can all distort the curve's meaning in any given cycle. An inversion raises the probability of trouble; it does not schedule it.
Implications of yield curve inversion for investors
For long-term investors, the honest answer is: less than the headlines suggest. Predicting recessions is hard, and predicting the market's reaction is harder, because stocks often move well before the economy does.
Still, inversions have practical uses:
- Stress-test rather than flee. Treat the signal as a prompt to check that your allocation, cash buffer, and risk tolerance would survive a downturn, not as a command to exit stocks.
- Understand your bond exposure. Inversion changes bond math. Short maturities briefly pay more than long ones, but locking in long yields can prove valuable if rates later fall.
- Watch lending-sensitive sectors. Banks borrow short and lend long, so a persistently inverted curve squeezes lending margins and can tighten credit for the wider economy.
- Expect noise. Curves can invert, un-invert, and re-invert within months. Reacting to each flip is a recipe for churn.
The steepest risk is behavioral: making a large, permanent portfolio change based on a signal with a two-year fuse and a documented history of false comfort in both directions.
Practice investing with Finelo
Build practical investing skills with guided lessons, simulator practice, and structured challenges.
What to know before deciding
The yield curve is one indicator summarizing expectations about rates, inflation, and growth; it is not a mechanical forecast. Its predictive record comes from a small sample of recessions, and each cycle has featured loud arguments about why "this time is different", occasionally correct ones. Structural forces, from regulation to pension demand for long bonds, can flatten or invert parts of the curve without signaling doom.
Diversification across assets and time remains the sturdier defense. A portfolio built for your horizon through diversification does not need the curve's permission to work. Treat curve-watching as education about the market's mood, not as a trading system, and remember that none of this is personalized financial advice.
Decision framework: responding to an inverted curve
- Long horizon, steady contributions? Keep contributing. Downturn odds rising by some amount does not beat the cost of mistimed exits.
- Nearing a spending goal within a few years? An inversion is a good prompt to move near-term money out of volatile assets, something your horizon already demanded.
- Holding concentrated stock positions? Use the moment to trim concentration risk you should not carry into any slowdown.
- Managing bond ladders? Compare short and long yields deliberately; inversion changes which rungs pay best today versus which protect against future cuts.
- Tempted to trade the signal? Paper-trade the idea first and track it honestly against a do-nothing baseline.
FAQ
What does an inverted yield curve mean?
It means short-term government bonds yield more than long-term ones. The market effectively expects rates to fall in the future, usually because it expects the economy to weaken enough to force cuts.
Does yield curve inversion always predict a recession?
No indicator is perfect. Inversions have preceded most modern U.S. recessions, but with long, variable lags, and the signal can be distorted by policy and structural demand for long bonds. It shifts probabilities rather than delivering certainty.
Which yield curve spread matters most?
The 2-year/10-year Treasury spread is the most quoted, while many economists prefer the 3-month/10-year spread for its research track record. Watching either consistently matters more than switching between them.
How long after an inversion does a recession start?
Historically the lag has ranged from several months to about two years, when a recession followed at all. The width of that range is exactly why inversion is a poor market-timing tool.
Conclusion and next steps
Yield curve inversion is the bond market pricing in a future of lower rates, and history says that mood has often preceded recessions. It is a signal worth understanding and a poor reason to abandon a plan. Check the current curve against the published data, stress-test your allocation for a slowdown you cannot schedule, and let your time horizon, not the day's spread, set your risk. If you want to build the underlying knowledge, studying how bonds, rates, and inflation interact will serve you in every cycle, inverted or not.
InvestingFundamental AnalysisBondsBeginner
Practice investing with Finelo
Build practical investing skills with guided lessons, simulator practice, and structured challenges.
About the author
Finelo Team
The Finelo Team creates practical investing and trading education designed to help beginners learn faster with structured challenges, simulator practice, and bite-sized lessons.
Keep reading — Related articles

Investing
Tax-gain harvesting vs. tax-loss harvesting
Compare realizing investment gains with realizing losses, including holding periods, wash sales, offsets, and portfolio tradeoffs.
Finelo Team

Investing
Stable value fund vs. money market fund
Compare investment structure, contract protections, transfer restrictions, net yields, and access inside a retirement account.
Finelo Team

Investing
Single-life vs. joint-life annuity
Compare income for one lifetime with continued payments to a survivor, using equal premiums and matching guarantee terms.
Finelo Team


