Portfolio beta measures how sensitive your whole portfolio is to movements in the broad market. A beta of 1 means the portfolio tends to move in line with the market. A beta of 1.3 suggests it moves about 30% more than the market in both directions, while a beta of 0.7 suggests it moves about 30% less.
What is Portfolio Beta and Why Does It Matter?

Portfolio beta measures how sensitive your whole portfolio is to movements in the broad market. A beta of 1 means the portfolio tends to move in line with the market. A beta of 1.3 suggests it moves about 30% more than…
8 min read
Practice investing with Finelo
Build practical investing skills with guided lessons, simulator practice, and structured challenges.
Want to learn more?
Build practical investing skills with guided lessons, simulator practice, and structured challenges.
Explore FineloExplore Finelo's 28-day challenges
Turn learning into a daily habit with guided challenge paths.
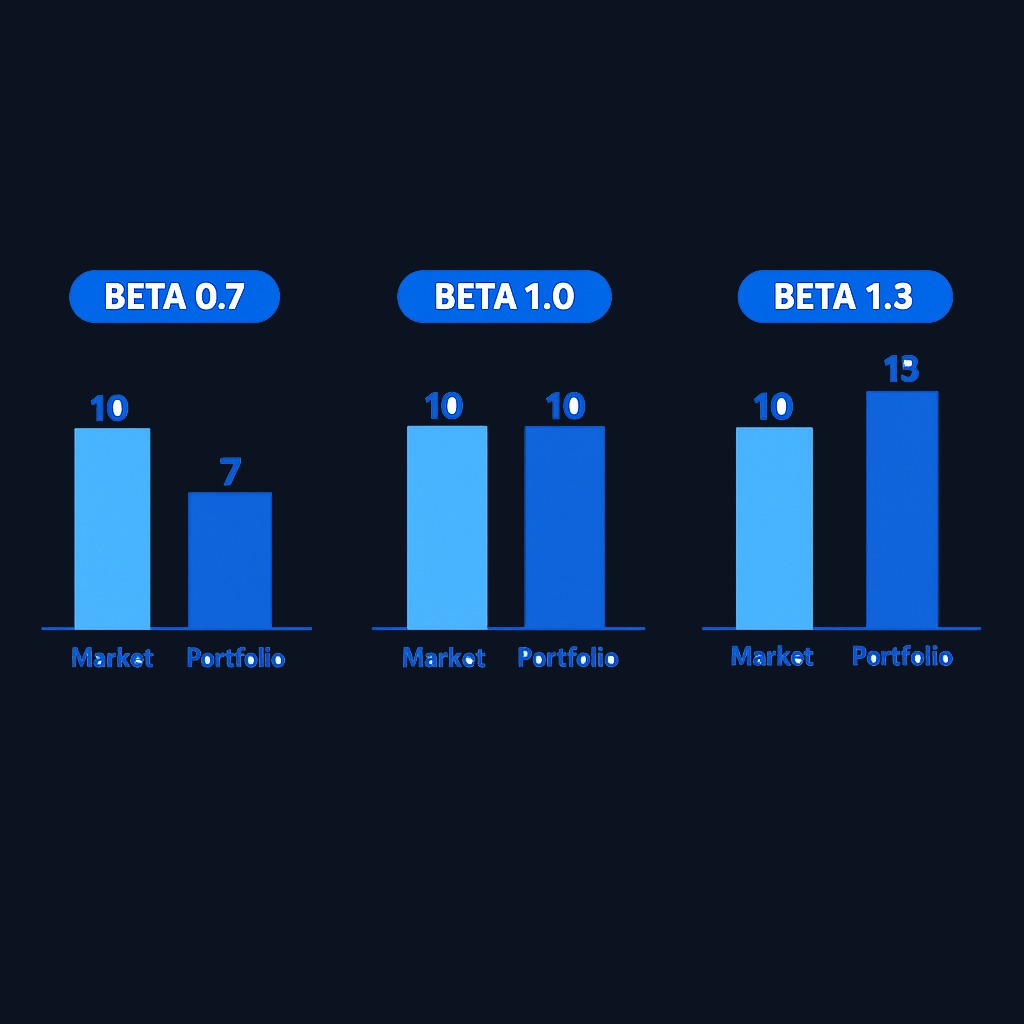
Beta matters because it tells you, in one number, how much market risk you are actually carrying. Many investors discover their "moderate" portfolio behaves aggressively in a downturn simply because its beta was higher than they assumed. This guide explains how portfolio beta is calculated, what the values mean, how to use and adjust it, and where it misleads. It is educational content, not financial advice.
How portfolio beta is calculated
Each stock or fund has its own beta, which describes how its returns have historically moved relative to a market index. Statistically, an asset's beta comes from regression: it is the covariance of the asset's returns with the market's returns, divided by the variance of the market's returns.
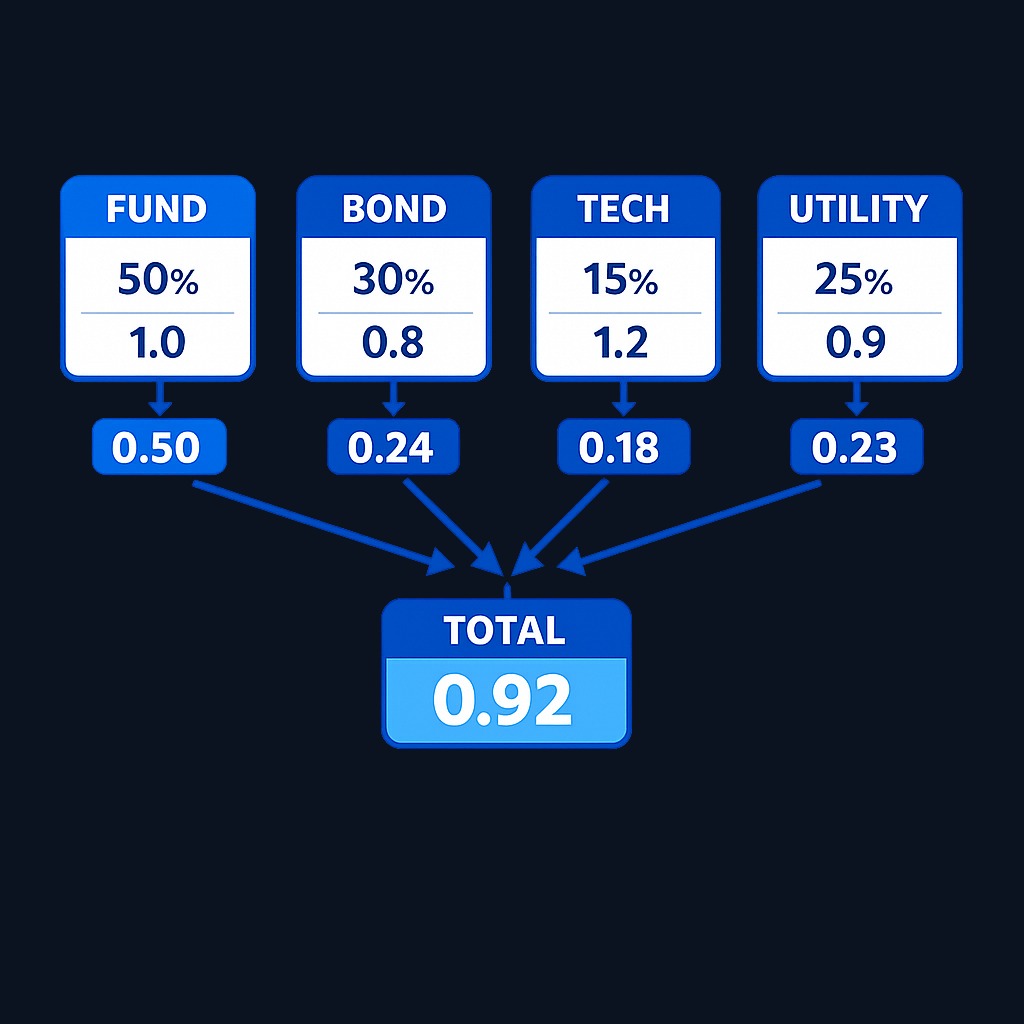
You rarely need to run that regression yourself. Betas for individual stocks and funds are widely published on financial data platforms. What you do need is the portfolio-level calculation, and that part is simple: portfolio beta is the weighted average of the betas of everything you hold, weighted by each position's share of the portfolio's value.
Portfolio beta = Σ (position weight × position beta)
A worked example with a four-position portfolio:
| Holding | Weight | Beta | Contribution |
|---|---|---|---|
| Broad index fund | 40% | 1.00 | 0.40 |
| Technology stock | 25% | 1.60 | 0.40 |
| Utility stock | 20% | 0.50 | 0.10 |
| Government bond fund | 15% | 0.10 | 0.015 |
| Total | 100% | ≈ 0.92 |
This portfolio's beta is roughly 0.92, so it has historically moved slightly less than the market overall. Notice the detail that surprises people: the technology position contributes as much beta as the index fund despite holding much less money, because its individual beta is so high.
Interpreting portfolio beta values
Use these bands as a starting map:
- Beta above 1: amplified market exposure. Gains and losses both tend to run hotter than the index.
- Beta near 1: market-like behavior. Broad index portfolios live here by construction.
- Beta between 0 and 1: dampened exposure. The portfolio participates in market moves but with smaller swings.
- Beta near 0: little relationship with the market, typical for cash and short-term bonds.
- Negative beta: tends to move opposite the market, rare and usually associated with hedging instruments.
Two cautions keep the interpretation honest. First, beta describes relative movement, not safety. A low-beta portfolio of fragile assets can still lose money for reasons the market never shares. Second, beta is estimated from a specific past period against a specific index. Change the period or the index and the number changes too, sometimes a lot.
Real-world applications of portfolio beta
Risk budgeting. Beta converts a vague feeling of "aggressive" or "conservative" into a measurable target. An investor who wants roughly two-thirds of market volatility can build toward a 0.65 beta and check the portfolio against that target after every major change.
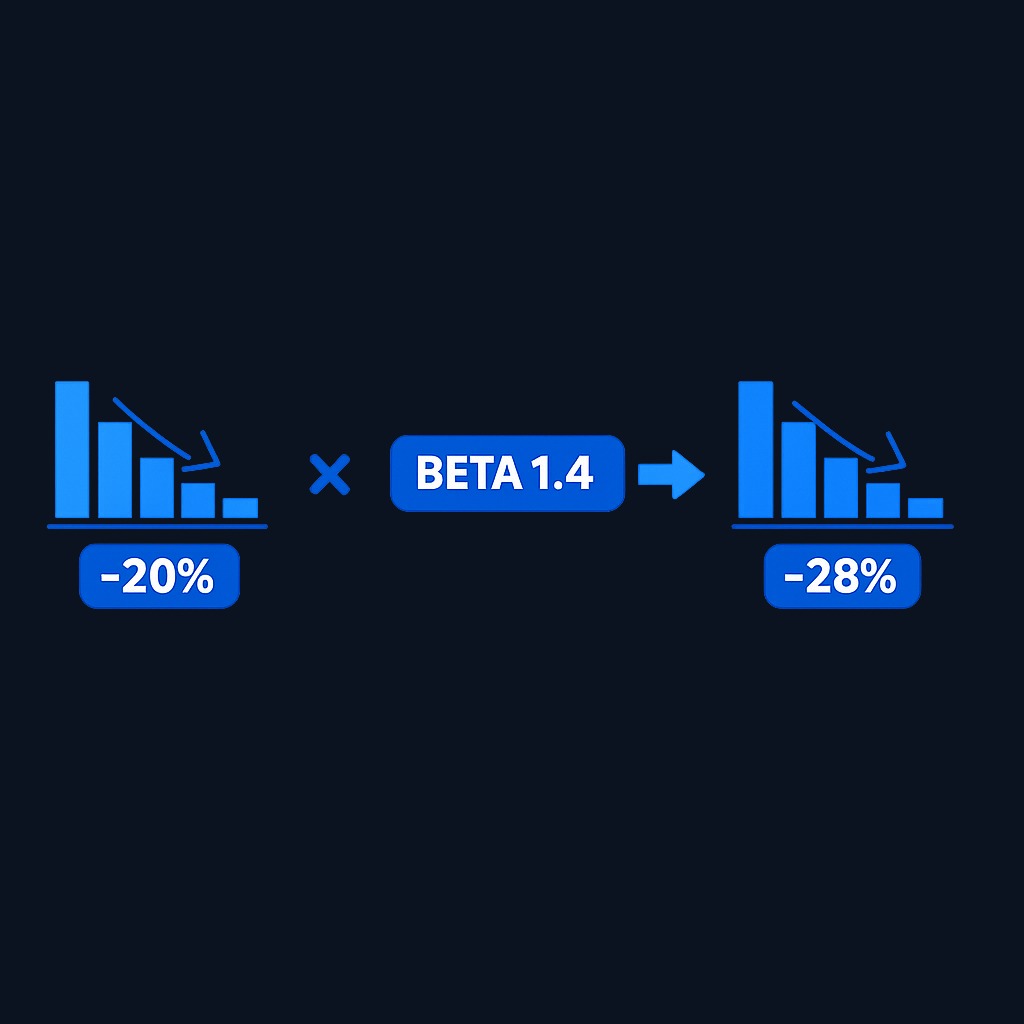
Stress estimation. Beta gives quick, rough answers to uncomfortable questions. With a portfolio beta of 1.4, a 20% market decline implies something like a 28% portfolio decline, before any asset-specific surprises. If that number is unlivable, the time to discover it is before the decline.
Explaining performance. Beta separates market-driven results from skill or selection. A portfolio that gained 15% while the market gained 15% and its beta was 1.5 did not add value; it merely leveraged the market's ride. Reviewing returns through a beta lens keeps scorekeeping honest.
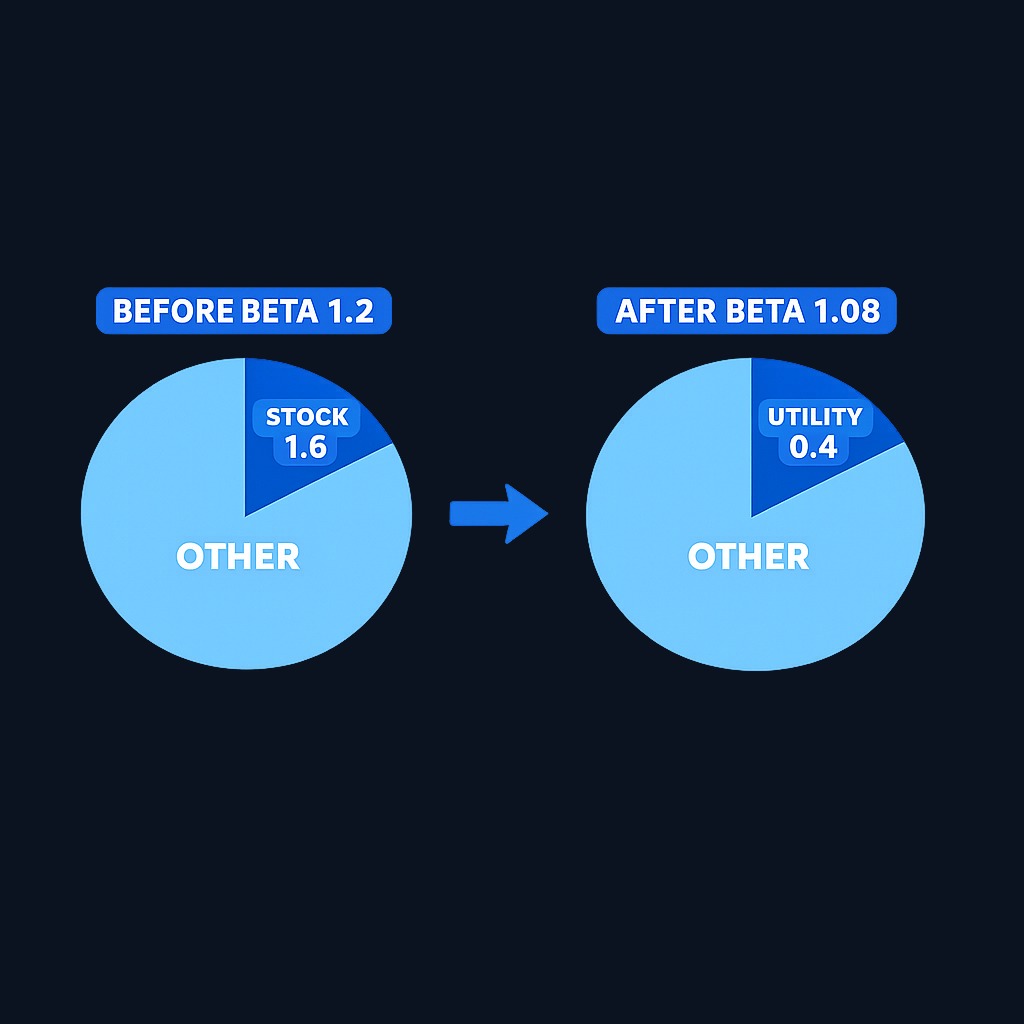
Position sizing. Because portfolio beta is a weighted average, it shows exactly how much any trade shifts your market exposure. Swapping 10% of the portfolio from a beta-1.6 stock into a beta-0.4 utility cuts portfolio beta by 0.12 in one move.
Portfolio beta vs other risk metrics
Beta answers one question: how much does the portfolio move with the market? Other metrics answer different ones, and the differences matter.
Standard deviation measures total volatility from all sources, market-related or not. A concentrated portfolio of two stocks can have moderate beta and enormous standard deviation, because company-specific risk does not show up in beta at all.
Alpha measures return beyond what beta alone would predict. It is the skill claim; beta is the exposure fact.
Maximum drawdown records the worst peak-to-trough loss, which captures how a portfolio actually felt to hold in its worst stretch. Beta only implies this; drawdown states it.
Correlation tells you how reliably two things move together, but not how large the moves are. Beta combines direction and magnitude relative to the market.
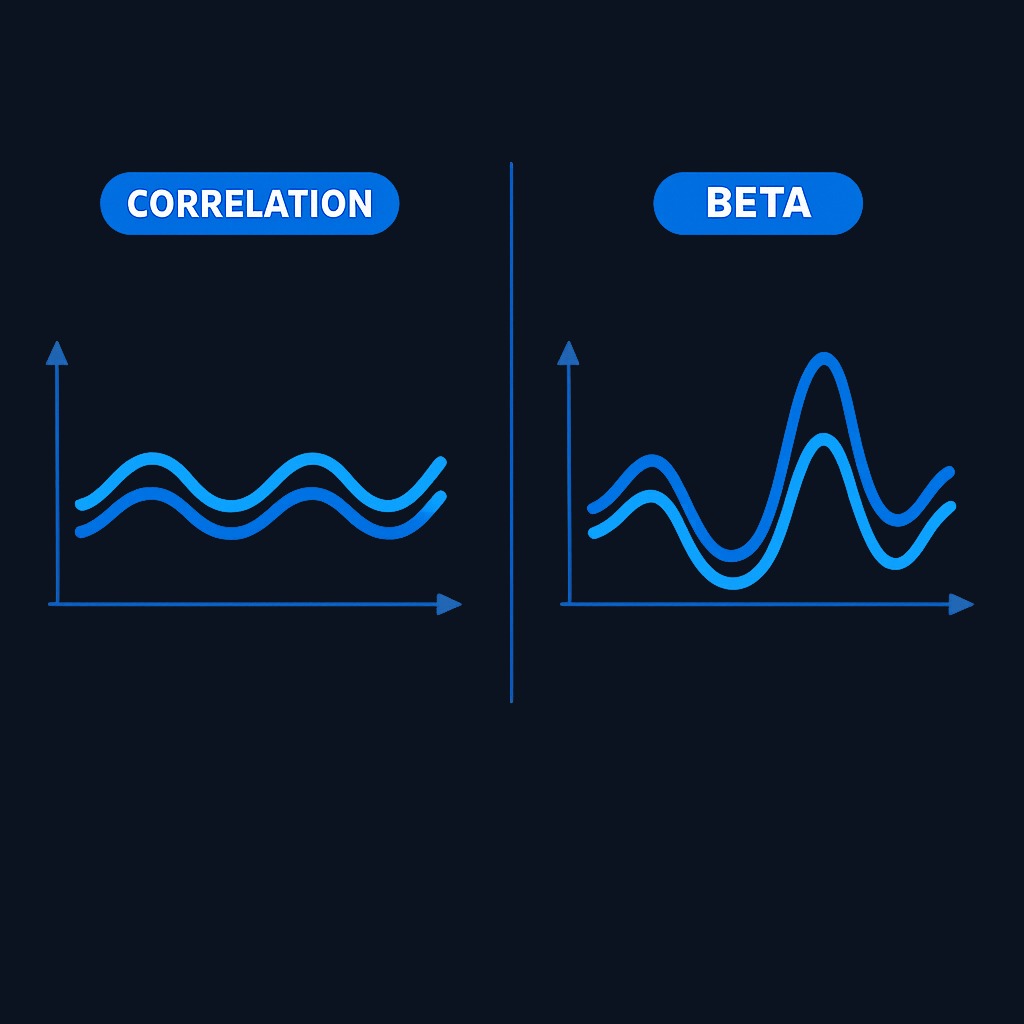
The practical takeaway: beta is the right tool for measuring and managing market exposure, and the wrong tool for judging total risk in concentrated or unusual portfolios. Diversified portfolios get the most meaning from beta because company-specific noise has been averaged away.
Practice investing with Finelo
Build practical investing skills with guided lessons, simulator practice, and structured challenges.
Adjusting portfolio beta as conditions change
Portfolio beta is adjustable through ordinary trades. To lower it, trim high-beta positions and add low-beta assets such as short-term bonds, defensive sectors, or cash. To raise it, do the reverse. Because the portfolio number is a weighted average, each change is easy to plan in advance: multiply the weight you are moving by the difference in betas.
Some investors adjust beta tactically, dialing exposure down when they judge markets fragile and up when they see opportunity. Be honest about what this is: market timing with a risk label. Evidence on sustained timing skill is not encouraging, and every adjustment in a taxable account can realize capital gains, with tax consequences the IRS outlines in Topic 409, Capital Gains and Losses. A steadier use of beta is structural: pick a target range that matches your goals and risk tolerance, then rebalance back into that range when drift pulls you out of it.
Remember also that betas themselves drift. A company's beta changes as its business, debt load, and industry evolve. Recheck holding betas periodically rather than trusting numbers gathered years ago.
Tools for calculating and tracking portfolio beta
You can maintain portfolio beta with modest tooling. Individual betas are published on most major financial data websites and broker platforms. A spreadsheet that lists each holding's weight and beta, multiplies them, and sums the results is a complete tracking system, and updating it quarterly takes minutes. Many brokerages also display a portfolio-level beta automatically in their analytics sections.
Whichever tool you use, keep two habits. Note the index and time period behind each beta figure, since mixing five-year betas against one index with one-year betas against another muddies the total. And track the number over time: a portfolio whose beta creeps upward is quietly getting more aggressive, and creeping risk is the kind investors notice too late.
What to know before deciding
Before using beta to steer real decisions, know what your number is built on. Check betas from a source that states its index and estimation window, weight them by current position values, and treat the result as an estimate with error bars rather than a precision instrument. Beta works best for diversified equity portfolios judged over meaningful horizons. It works worst for concentrated portfolios, unusual assets, and short windows, and it says nothing about risks the market itself does not experience. If your portfolio is heavy in one stock or one sector, pair beta with standard deviation and a plain look at concentration before trusting any single number.
Decision framework: putting beta to work
- Measure the current number. Weighted average across all holdings, using consistent beta sources.
- Set a target range, not a point. For example, 0.8 to 1.0 for a balanced investor. Ranges survive market drift; points demand constant tinkering.
- Translate the target into a stress test. Multiply your beta by a hypothetical 25% market drop. If the implied loss exceeds what you can hold through, lower the target.
- Adjust with the cheapest trades available. Prefer rebalancing flows, new contributions, and tax-advantaged accounts before selling appreciated positions.
- Recheck quarterly. Betas drift, weights drift, and your circumstances change. A fifteen-minute review keeps the number honest.
Conclusion and next steps
Portfolio beta compresses your market exposure into one usable number: the weighted average of holding betas. It sets risk targets, sizes stress tests, keeps performance claims honest, and makes every trade's effect on market exposure predictable. It also has clear limits, ignoring company-specific risk and leaning entirely on historical estimates, so it works best alongside other measures rather than alone.
Next steps: compute your portfolio's beta this week with the weighted-average method, run the 25% stress test against it, and set your target range. If you want guided practice with risk metrics like beta, Finelo teaches these concepts step by step for beginner investors.
Frequently asked questions
What is a good portfolio beta?
It depends on your goals and tolerance for swings. Long-horizon growth investors often accept betas near or above 1, while investors near spending goals commonly prefer 0.5 to 0.8. The good beta is the one whose implied worst-case you can genuinely hold through.
Can portfolio beta predict my losses in a crash?
It gives a first approximation: beta times the market's decline. Real outcomes deviate because correlations shift in stress and company-specific events add their own damage. Treat the estimate as a floor for planning, not a guarantee.
Is a low-beta portfolio always safer?
No. Beta only captures market-linked movement. A low-beta portfolio concentrated in one company or one illiquid asset can carry large risks the market never sees. Pair beta with a concentration check and total volatility.
How often should I recalculate portfolio beta?
Quarterly is enough for most investors, plus after any major trade. Position weights change with prices, so beta drifts even when you do nothing.
portfoliobeta
Practice investing with Finelo
Build practical investing skills with guided lessons, simulator practice, and structured challenges.
About the author
Finelo Team
The Finelo Team creates practical investing and trading education designed to help beginners learn faster with structured challenges, simulator practice, and bite-sized lessons.
Keep reading — Related articles

Investing
Tax-gain harvesting vs. tax-loss harvesting
Compare realizing investment gains with realizing losses, including holding periods, wash sales, offsets, and portfolio tradeoffs.
Finelo Team

Investing
Stable value fund vs. money market fund
Compare investment structure, contract protections, transfer restrictions, net yields, and access inside a retirement account.
Finelo Team

Investing
Single-life vs. joint-life annuity
Compare income for one lifetime with continued payments to a survivor, using equal premiums and matching guarantee terms.
Finelo Team


