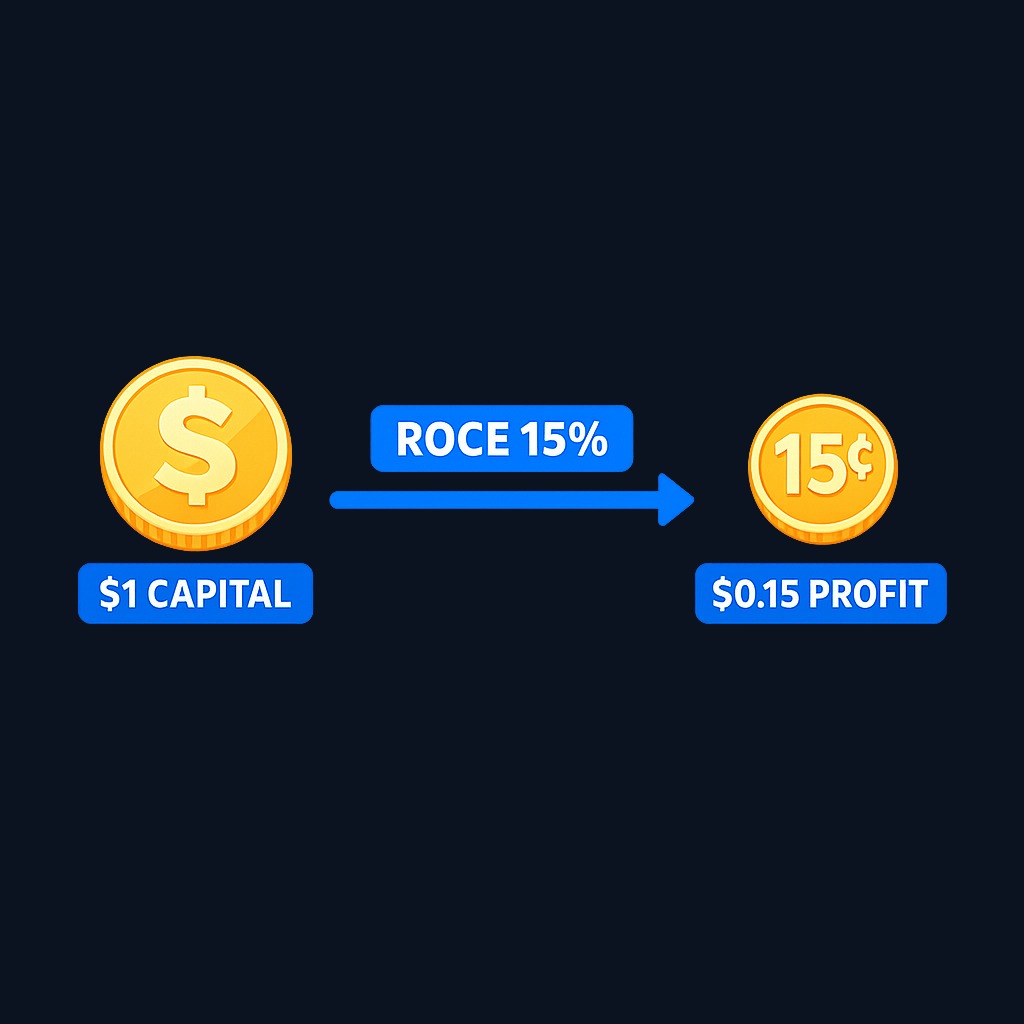
Return on capital employed, or ROCE, is a profitability ratio that shows how efficiently a company turns the total capital it uses into operating profit. You calculate it by dividing operating profit (EBIT) by capital employed, which is total assets minus current liabilities. A ROCE of 15% means the business generates 15 cents of operating profit for every dollar of long-term capital working inside it.
What is Return on Capital Employed (ROCE)?
Return on capital employed, or ROCE, is a profitability ratio that shows how efficiently a company turns the total capital it uses into operating profit. You calculate it by dividing operating profit (EBIT) by capital…
8 min read
Practice investing with Finelo
Build practical investing skills with guided lessons, simulator practice, and structured challenges.
Want to learn more?
Build practical investing skills with guided lessons, simulator practice, and structured challenges.
Explore FineloExplore Finelo's 28-day challenges
Turn learning into a daily habit with guided challenge paths.
Investors lean on ROCE because it judges management's use of all funding, both shareholders' equity and borrowed money. This guide covers the formula, interpretation, comparisons with related ratios, common traps, and a worked example. It is educational content, not financial advice, so verify any company's figures in its official filings before acting.
How to calculate ROCE
The formula has two parts:
ROCE = EBIT ÷ capital employed
- EBIT is earnings before interest and taxes, also called operating profit. It measures what the core business earns before financing choices and tax effects.
- Capital employed is the funding that stays in the business for the long haul. The most common definition is total assets minus current liabilities. An equivalent view is shareholders' equity plus long-term debt.
Both inputs come straight from a company's financial statements: EBIT from the income statement, and capital employed from the balance sheet. Because balance-sheet values are snapshots, many analysts average the capital employed at the start and end of the period for a fairer denominator.
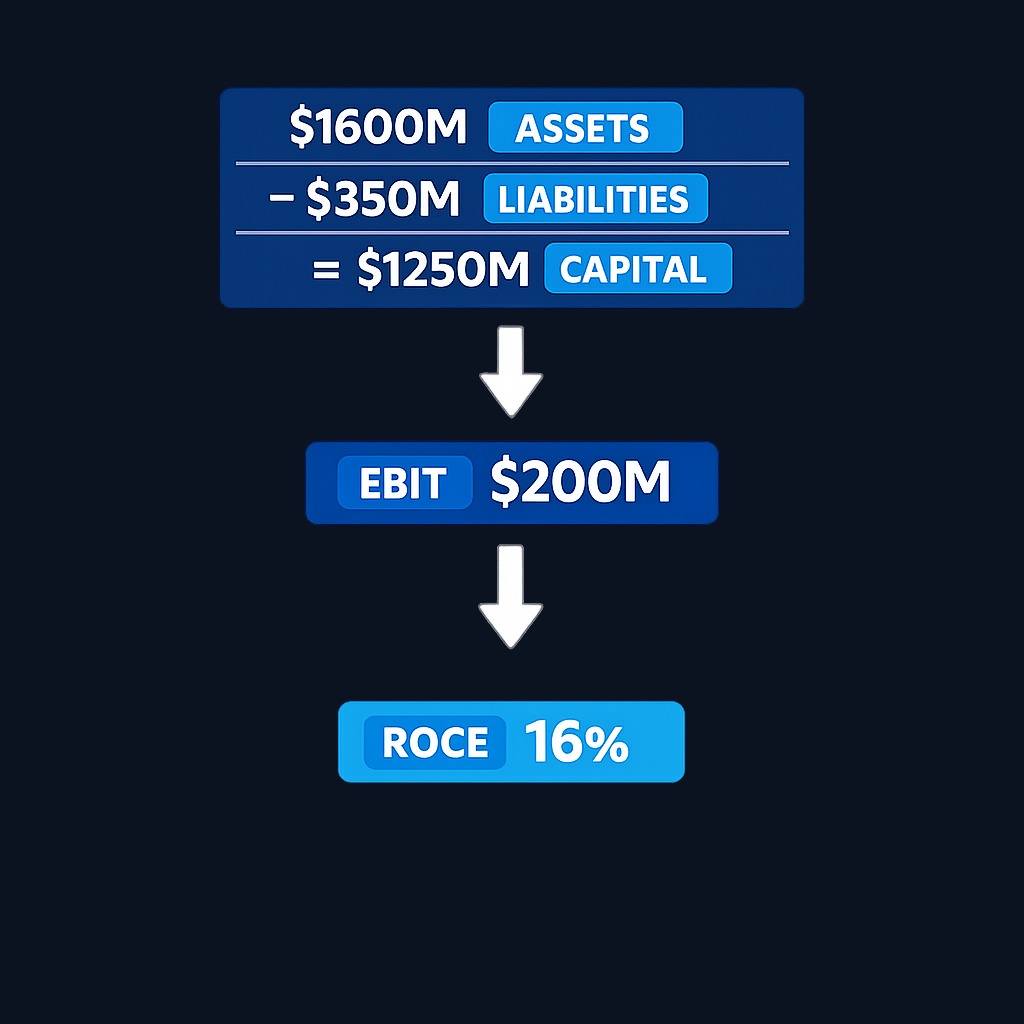
A quick example. A company reports EBIT of $200 million, total assets of $1.6 billion, and current liabilities of $350 million. Capital employed is 1,600 − 350 = $1.25 billion. ROCE is 200 ÷ 1,250 = 16%. Every dollar of long-term capital produced sixteen cents of operating profit that year.
Why ROCE matters for investors
ROCE answers the question every owner should ask: what does this business earn on the money trapped inside it?
That framing has three practical uses. First, it measures management quality. Executives decide where capital goes, and ROCE grades those decisions across the whole balance sheet, not just the equity slice. Second, it exposes capital intensity. Two companies with identical profit margins can have very different ROCE if one needs twice the factories, inventory, and equipment to produce the same profit. Third, it supports compounding logic: a business that can reinvest profits at a high ROCE grows value faster than one that cannot, which is why long-term investors watch the trend as closely as the level.
ROCE also travels well across financing styles. Because EBIT sits above interest costs, the ratio lets you compare a debt-heavy company against a debt-free one on the productivity of their operations rather than the shape of their balance sheets.
Interpreting ROCE: what do the numbers mean?
Reading a ROCE figure requires three comparisons:
- Against the company's cost of capital. A business creates value only when ROCE exceeds what its capital costs. A ROCE below the cost of capital means the company is busy destroying value even while reporting profits.
- Against industry peers. Capital intensity varies enormously by sector. Software firms often post high ROCE because they need little physical capital, while utilities and manufacturers run structurally lower figures. Compare within the industry, not across it.
- Against the company's own history. A rising ROCE trend suggests improving efficiency or discipline; a falling trend can flag overexpansion, weakening pricing power, or acquisitions that added capital faster than profit.
As a loose orientation, sustained double-digit ROCE is generally considered healthy in most industries, and a wide, durable gap over peers often marks a business with genuine competitive advantages. Treat any single-year figure with suspicion in both directions, since one-off events can inflate or crush it temporarily.
ROCE vs other financial ratios
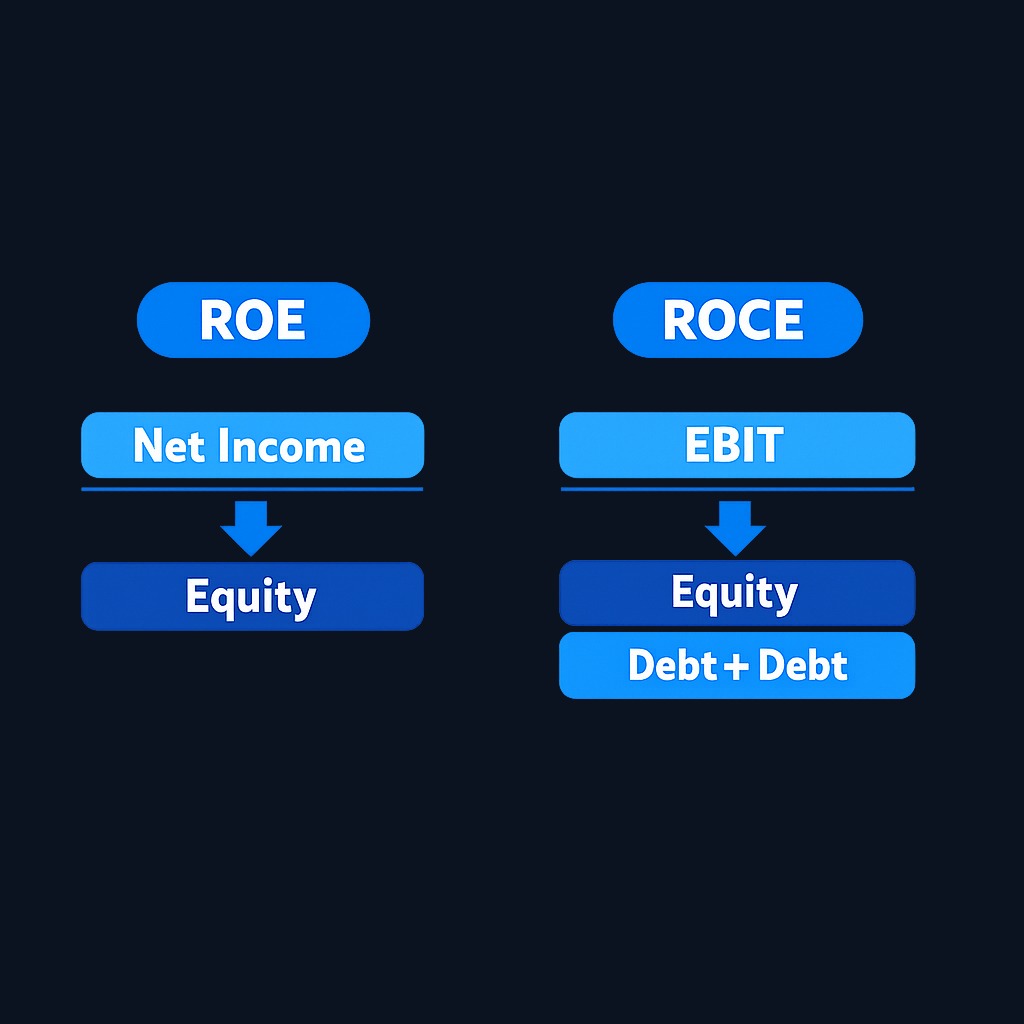
ROCE vs ROE. Return on equity divides net income by shareholders' equity only. ROE rewards leverage: borrow more, shrink the equity base, and ROE rises even if the business itself improved nothing. ROCE includes debt in the denominator, so it is harder to flatter with financing. Reading the pair together is revealing: high ROE with mediocre ROCE usually signals a leverage story rather than an operating one.
ROCE vs ROA. Return on assets uses total assets as the base, including short-term liabilities that finance themselves through the operating cycle. ROCE's subtraction of current liabilities focuses the ratio on long-term funding, which better reflects deliberate capital decisions.
ROCE vs ROIC. Return on invested capital is a close cousin that typically uses after-tax operating profit and a more surgically defined capital base. ROIC is more precise for valuation work; ROCE is simpler and faster to compute from headline statements. They usually tell the same story directionally.
ROCE vs profit margin. Margin measures profit per dollar of sales; ROCE measures profit per dollar of capital. A supermarket chain can pair thin margins with high ROCE by turning its capital rapidly, while a heavy industrial can pair fat margins with poor ROCE. Neither metric substitutes for the other.
Practice investing with Finelo
Build practical investing skills with guided lessons, simulator practice, and structured challenges.
Common pitfalls in calculating and interpreting ROCE
- Inconsistent definitions. Some sources use EBIT, others use NOPAT or even net income; some subtract all current liabilities, others only non-interest-bearing ones. When comparing companies, compute the ratio yourself the same way for each.
- Snapshot denominators. Using year-end capital employed after a big acquisition or divestiture distorts the ratio. Average the period's opening and closing balances.
- Old assets flattering the number. Long-depreciated factories shrink the capital base, inflating ROCE for mature companies whose real replacement costs are far higher. Check asset age when a figure looks too good.
- One great year. Cyclical peaks, asset sales, and accounting one-offs can spike EBIT. Look at ROCE across at least a full business cycle.
- Cross-industry rankings. Ranking a software firm against a railroad by ROCE mostly measures their industries, not their managers.
- Ignoring the reinvestment question. A high ROCE only compounds wealth if the company can reinvest at similar rates. A high-ROCE business with nowhere to reinvest behaves more like a bond than a compounder.
A real-world style example
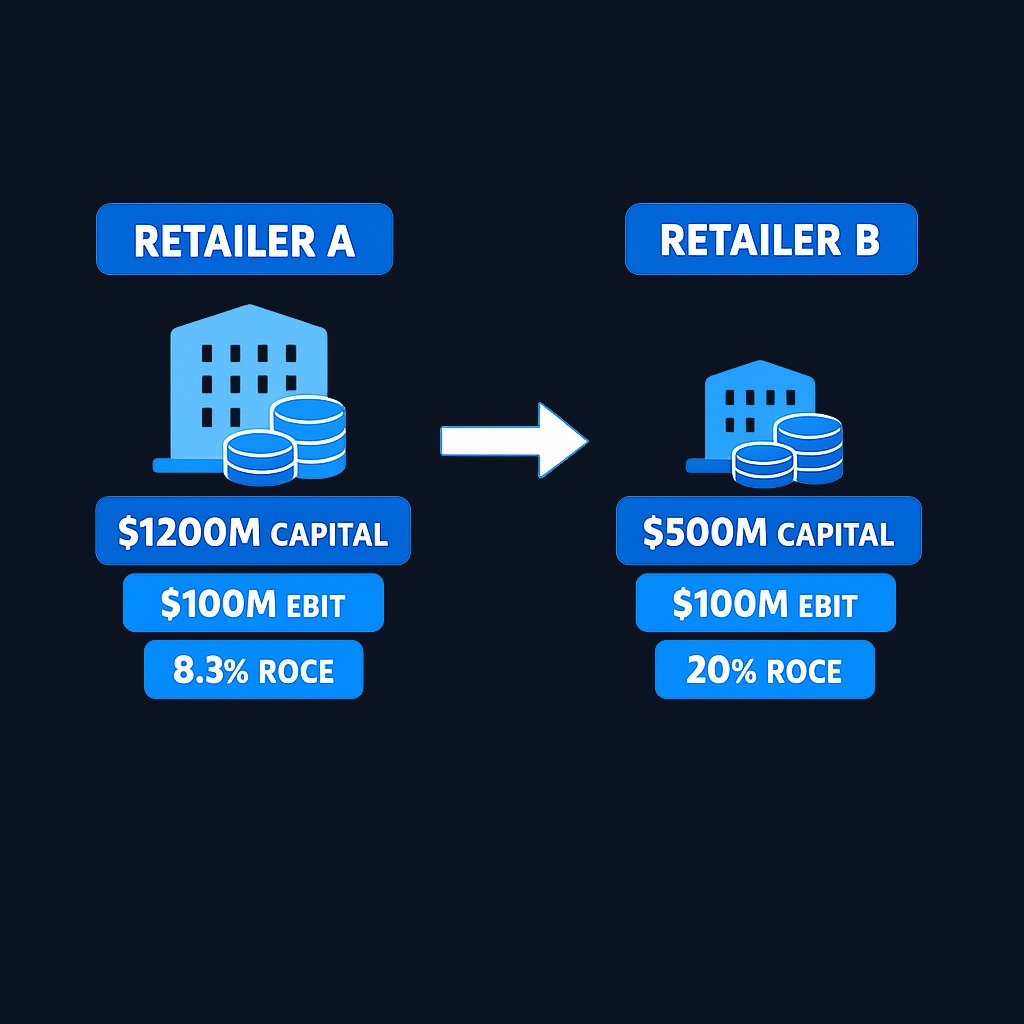
Consider two fictional retailers with identical $100 million EBIT. Retailer A owns its stores: total assets $1.4 billion, current liabilities $200 million, capital employed $1.2 billion, ROCE about 8.3%. Retailer B leases most locations and runs lean inventory: total assets $700 million, current liabilities $200 million, capital employed $500 million, ROCE 20%.
Same profit, very different businesses. Retailer B produces the same operating result with less than half the trapped capital, leaving more room to fund growth, repay debt, or return cash. The comparison also shows why context matters: A's heavy ownership model may bring stability and hidden real-estate value that the ratio ignores. ROCE starts the conversation about capital efficiency; it does not end the analysis.
What to know before deciding
Before using ROCE to pick or drop a stock, confirm the inputs yourself from the company's official filings; public companies' reports are available through the SEC's EDGAR database. Check which profit measure the ratio uses, whether the capital base is averaged, and whether recent acquisitions, asset sales, or write-downs distort either input. Then place the figure in context: the industry's normal range, the company's five-year trend, and the company's cost of capital. A single strong year proves little. A decade of high, stable ROCE alongside real reinvestment opportunities is the pattern long-term investors look for.
Decision framework: using ROCE in stock selection
- Screen within one industry. Rank direct peers by five-year average ROCE, not single-year figures.
- Demand a spread over cost of capital. Favor companies whose ROCE comfortably exceeds a reasonable capital-cost estimate; discard chronic under-earners.
- Check the trend. Prefer stable or rising ROCE; investigate any steady decline before excusing it.
- Cross-examine with ROE and debt. If ROE is high but ROCE is ordinary, leverage is doing the work; weigh that risk deliberately.
- Ask the reinvestment question. Can the company deploy new capital at similar returns? If yes, the compounding case strengthens; if no, expect value to come from dividends and buybacks instead.
- Verify with the source documents. Recompute the ratio from the filings once, the same way, for every finalist.
Conclusion and next steps
Return on capital employed grades how productively a company uses all of its long-term funding: EBIT divided by total assets minus current liabilities. Judge it against the cost of capital, the industry, and the company's own history; pair it with ROE to spot leverage flattery; and beware old-asset and one-year distortions.
Next steps: pick two companies in the same industry, compute ROCE for each from their latest filings using the same definitions, and compare the five-year trends. That single exercise builds more skill than memorizing benchmarks. For guided lessons on financial ratios like return on capital employed, Finelo offers structured investing education for beginners.
Frequently asked questions
What is a good ROCE?
A useful benchmark is the company's cost of capital plus a margin of safety, and sustained figures in the mid-teens or higher are generally strong in most industries. Always judge against sector peers and the company's own multi-year trend rather than a universal cutoff.
How is ROCE different from ROE?
ROCE measures operating profit against all long-term funding, equity plus debt, while ROE measures net income against equity alone. ROE can be inflated by borrowing; ROCE is designed to resist that distortion.
Where do I find the inputs for ROCE?
In a company's official financial statements: EBIT on the income statement, and total assets and current liabilities on the balance sheet. Most financial data platforms also publish precomputed ROCE, though definitions vary between providers.
Can ROCE be negative?
Yes. A company with an operating loss has negative EBIT and therefore negative ROCE, meaning the capital in the business generated no operating return that period. Persistent negative ROCE is a serious warning sign outside early-stage or turnaround situations.
returncapitalemployedroce
Practice investing with Finelo
Build practical investing skills with guided lessons, simulator practice, and structured challenges.
About the author
Finelo Team
The Finelo Team creates practical investing and trading education designed to help beginners learn faster with structured challenges, simulator practice, and bite-sized lessons.
Keep reading — Related articles

Investing
Tax-gain harvesting vs. tax-loss harvesting
Compare realizing investment gains with realizing losses, including holding periods, wash sales, offsets, and portfolio tradeoffs.
Finelo Team

Investing
Stable value fund vs. money market fund
Compare investment structure, contract protections, transfer restrictions, net yields, and access inside a retirement account.
Finelo Team

Investing
Single-life vs. joint-life annuity
Compare income for one lifetime with continued payments to a survivor, using equal premiums and matching guarantee terms.
Finelo Team


