Return on equity (ROE) measures how much profit a company generates for every dollar shareholders have invested in it. You calculate it by dividing net income by average shareholders' equity, expressed as a percentage. A business earning $150 million on $1 billion of equity has an ROE of 15%, meaning each dollar of owner capital produced 15 cents of annual profit.
What is Return on Equity (ROE) and Why It Matters
Return on equity (ROE) measures how much profit a company generates for every dollar shareholders have invested in it. You calculate it by dividing net income by average shareholders' equity, expressed as a percentage…
7 min read
Practice investing with Finelo
Build practical investing skills with guided lessons, simulator practice, and structured challenges.
Want to learn more?
Build practical investing skills with guided lessons, simulator practice, and structured challenges.
Explore FineloExplore Finelo's 28-day challenges
Turn learning into a daily habit with guided challenge paths.
This page is for beginner investors learning to judge how efficiently a company uses its owners' money. You will learn the formula, how to interpret the ratio, what distorts it, sector benchmarks, and a practical framework for using return on equity in real analysis. This content is educational, not financial advice.
How to calculate return on equity
The formula:
ROE = net income ÷ average shareholders' equity × 100
Net income comes from the income statement: the profit left after all expenses, interest, and taxes. Shareholders' equity comes from the balance sheet: total assets minus total liabilities, the accounting value of what owners hold. Using the average of the starting and ending equity for the period smooths out mid-year changes like buybacks or new share issuance.
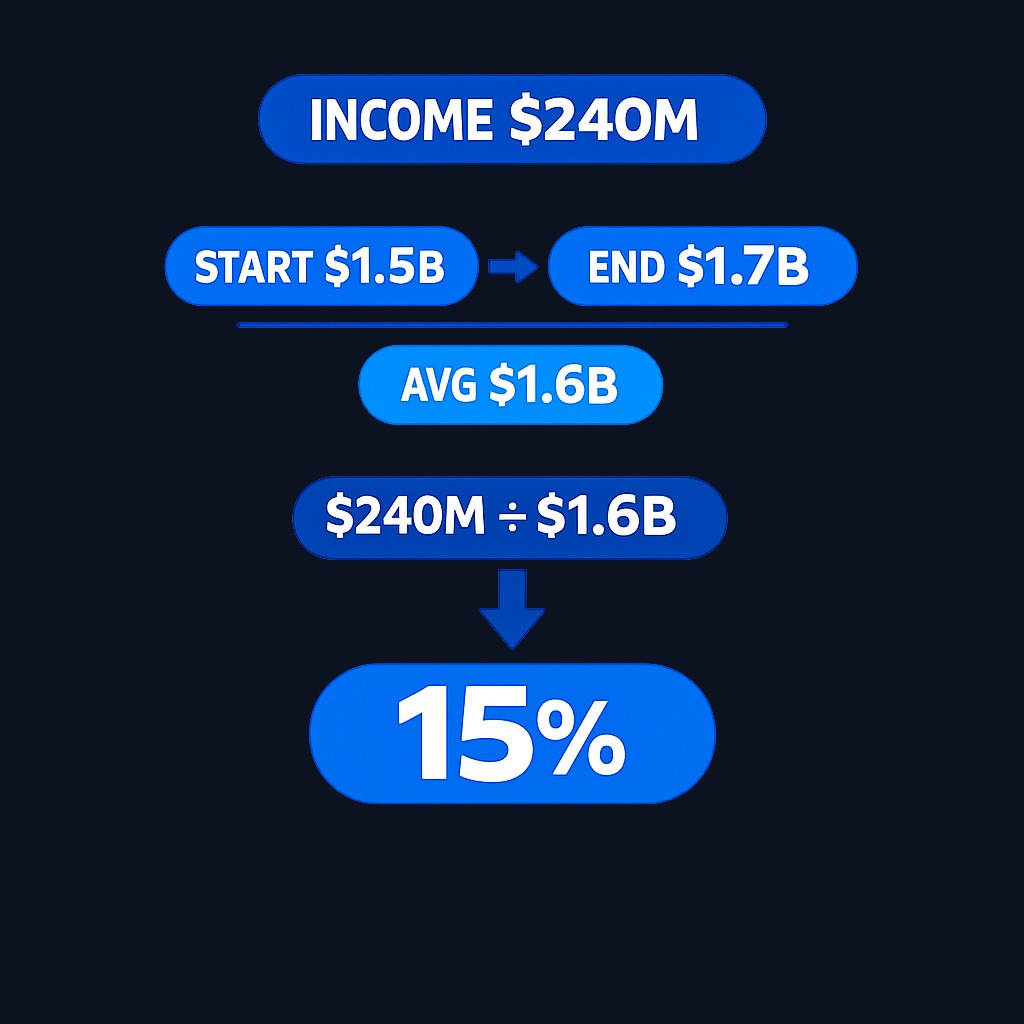
Example: a company earns net income of $240 million. Equity was $1.5 billion at the start of the year and $1.7 billion at the end, so average equity is $1.6 billion. ROE = 240 ÷ 1,600 = 15%. On its own the number says little; its meaning comes from comparison against the company's history, its industry, and the return you could earn elsewhere for similar risk.
Why return on equity matters
ROE compresses a fundamental question into one figure: is this management team a good steward of shareholder capital?
- Efficiency check. Two companies with equal profits are not equal if one needed twice the equity capital to produce them.
- Compounding signal. A business that consistently reinvests profits at a high ROE can grow shareholder value quickly, because each retained dollar earns a strong return in the business.
- Management scorecard. Capital allocation, pricing, cost control, and financing choices all flow into the ratio over time.
- Cross-company ranking. Within a single industry, ROE ranks competitors on how well they convert owner capital into profit.
Investors focused on quality often look for firms with stable, high ROE sustained across many years, since durable returns on capital usually reflect real competitive advantages in the business.
Interpreting ROE values
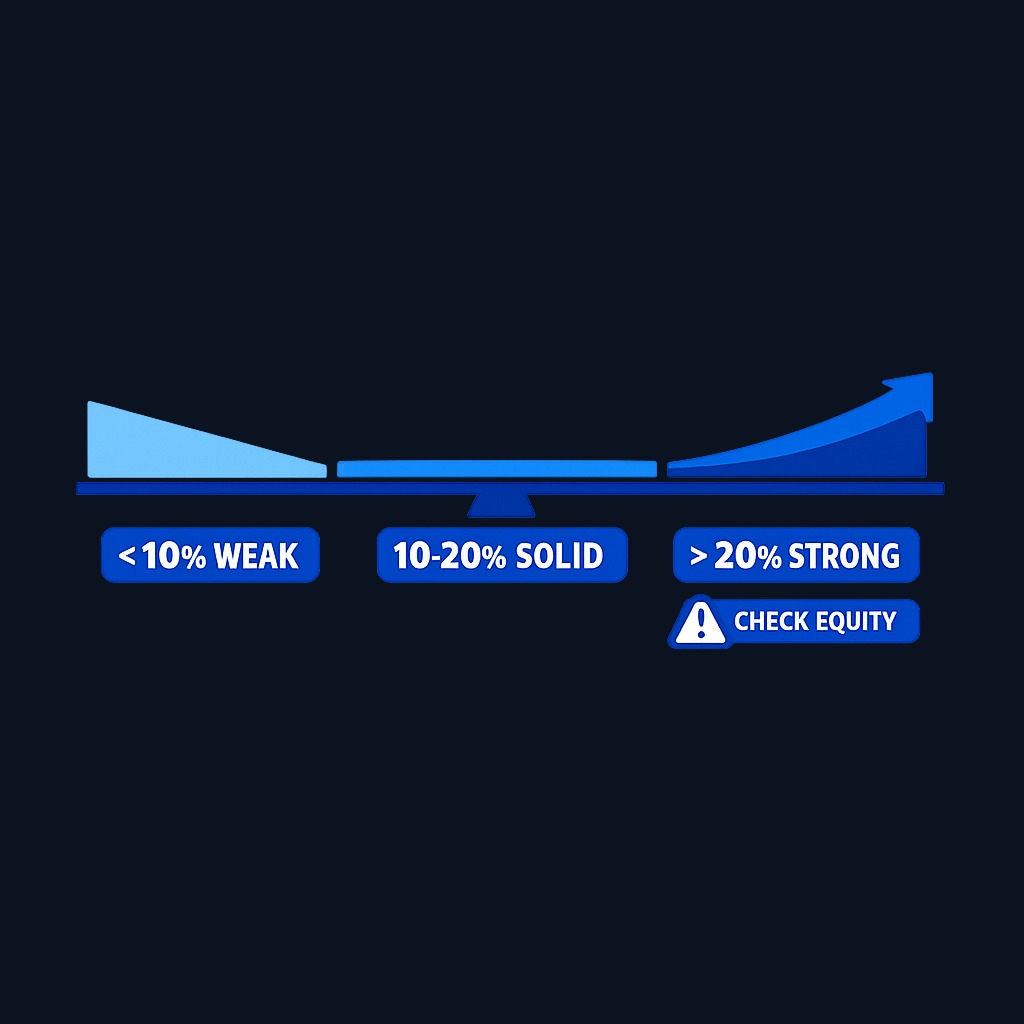
Rough reading bands help calibrate expectations, though industry context always comes first:
| ROE level | Typical interpretation |
|---|---|
| Below 5% | Weak use of equity capital, or a struggling period |
| 5-10% | Modest; common in capital-heavy businesses |
| 10-20% | Solid to strong for most industries |
| Above 20% | Excellent, but verify what is driving it |
| Extremely high or negative | Often a distorted denominator; investigate |
The last row deserves emphasis. Because equity is the denominator, a company that has shrunk its equity through heavy buybacks or losses can show a spectacular ROE that reflects accounting structure rather than operating brilliance. Negative equity makes the ratio meaningless entirely. Always ask what the denominator looks like before applauding the percentage.
Factors that influence ROE
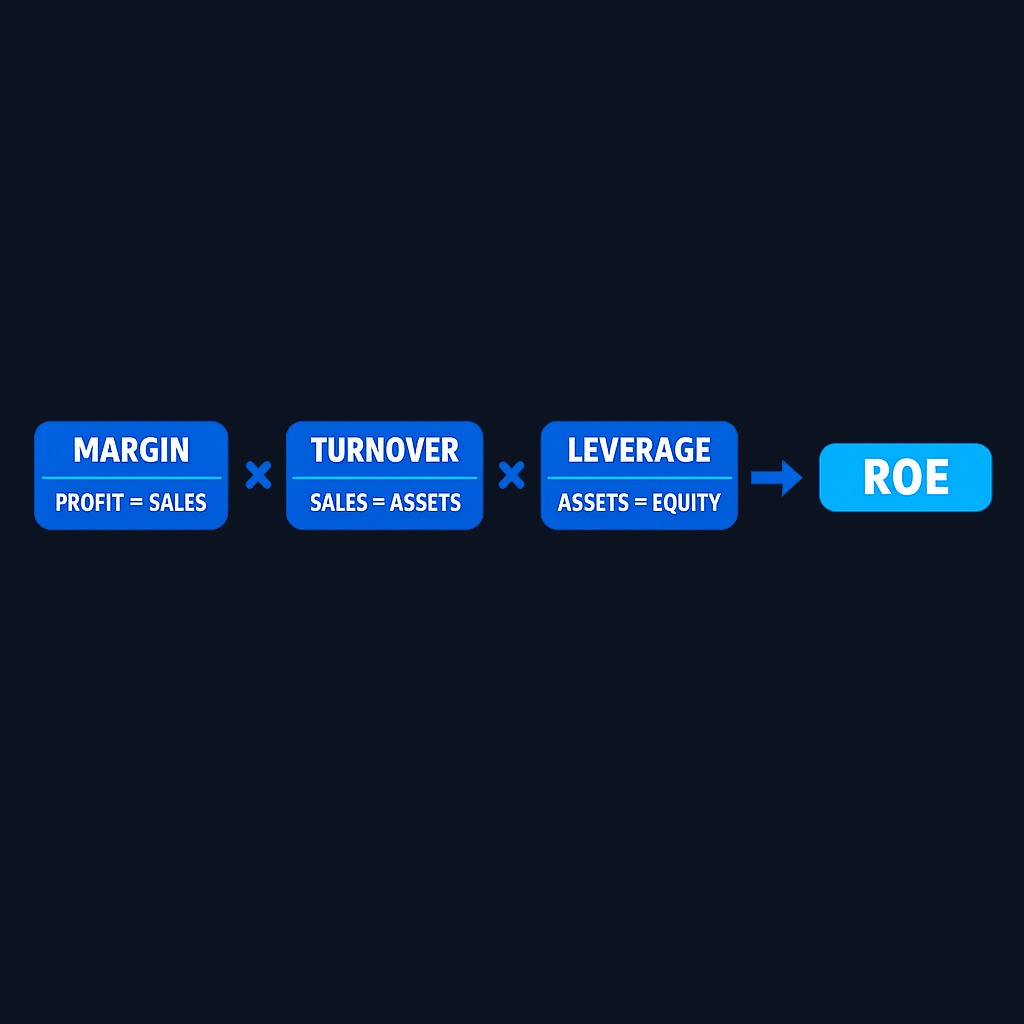
The DuPont framework breaks return on equity into three drivers, and it is the fastest way to understand why a ratio is high or low:
ROE = profit margin × asset turnover × equity multiplier
- Profit margin (net income ÷ revenue): how much of each sales dollar becomes profit.
- Asset turnover (revenue ÷ assets): how much revenue each dollar of assets generates.
- Equity multiplier (assets ÷ equity): how much the company relies on debt to fund its assets.
Two companies can both post 18% ROE by completely different routes: one through fat margins and little debt, another through thin margins, high volume, and heavy leverage. The decomposition reveals which. Rising leverage lifts ROE mechanically while adding financial risk, which is why an improving ratio is not automatically good news.
Common pitfalls in analyzing ROE
- Ignoring debt. Leverage inflates ROE. Cross-check with return on assets or the equity multiplier to see how much of the return is borrowed.
- Trusting one year. A single period can be flattered by one-time gains or depressed by write-downs. Use a multi-year view.
- Comparing across industries. A software firm and a utility live in different capital worlds; comparing their ROE directly misleads.
- Overlooking buyback effects. Repurchases shrink equity and raise ROE without changing the business's earning power.
- Missing accounting noise. Goodwill write-offs, pension adjustments, and currency effects can move equity sharply from one balance sheet to the next.
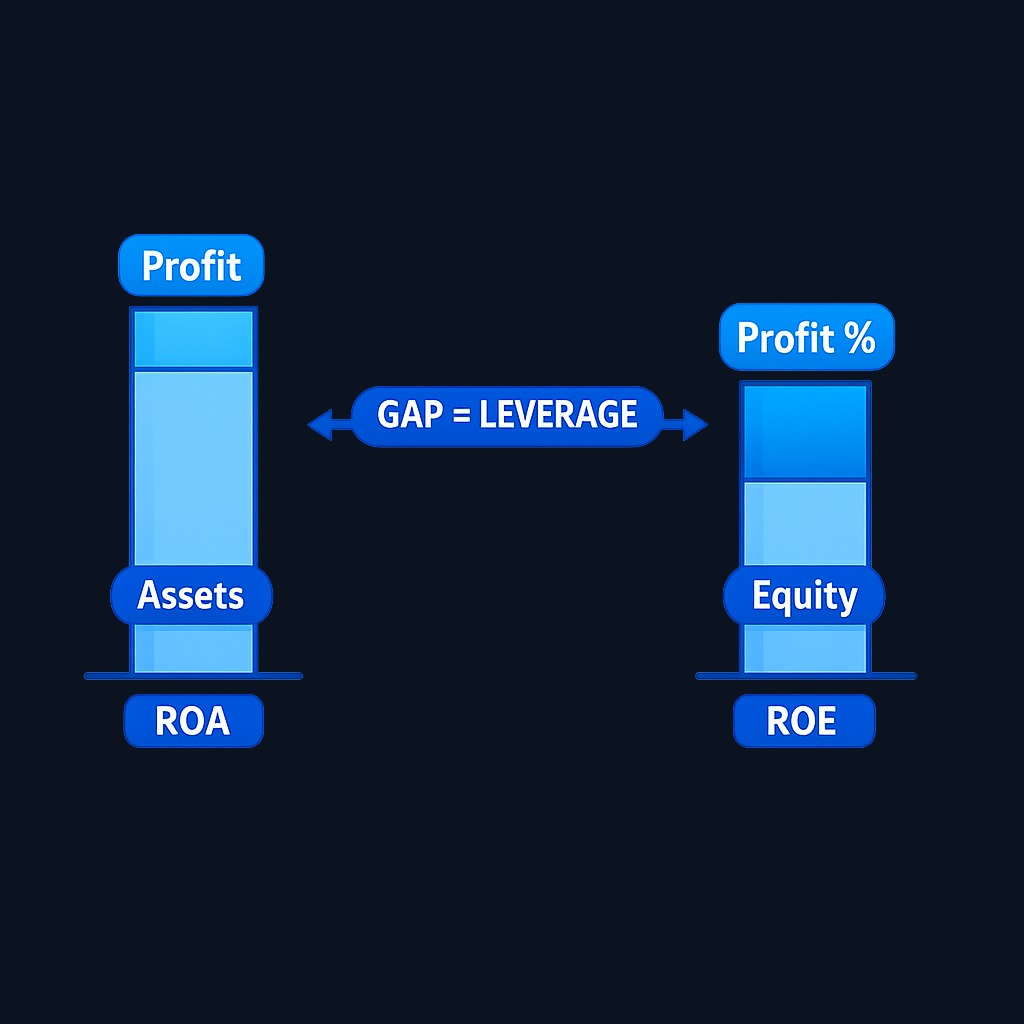
A simple discipline avoids most traps: never quote an ROE without also knowing the company's leverage and its five-year ROE trend.
Practice investing with Finelo
Build practical investing skills with guided lessons, simulator practice, and structured challenges.
Sector-specific ROE benchmarks
Capital intensity shapes what a normal return on equity looks like:
- Software and asset-light services often sustain high ROE, since growth requires little incremental capital.
- Consumer brands with pricing power typically land in the solid-to-strong range.
- Banks and financial firms run structurally leveraged balance sheets, so their ROE needs reading alongside capital ratios rather than at face value.
- Utilities, telecoms, and heavy industry carry enormous asset bases and usually post modest ROE, with regulation capping returns in some markets.
The practical rule: benchmark a company against its direct industry peers and its own history. A 12% ROE could be disappointing for an asset-light business and excellent for a capital-intensive one.
Case studies: high and low ROE in practice
- The quality compounder. A branded consumer company holds ROE near 25% for a decade with low debt. The DuPont breakdown shows strong margins doing the work. Retained profits reinvested at those rates compound book value and support long-run share performance.
- The leveraged illusion. A retailer's ROE jumps from 14% to 28% in three years. Decomposition shows margins flat and the equity multiplier doubling: debt-funded buybacks shrank equity. The business did not improve; the balance sheet got riskier.
- The cyclical whipsaw. An industrial firm swings from 20% ROE at the peak of a boom to negative in a downturn. Averaging across the full cycle, not sampling the best year, gives the honest picture of its earning power.
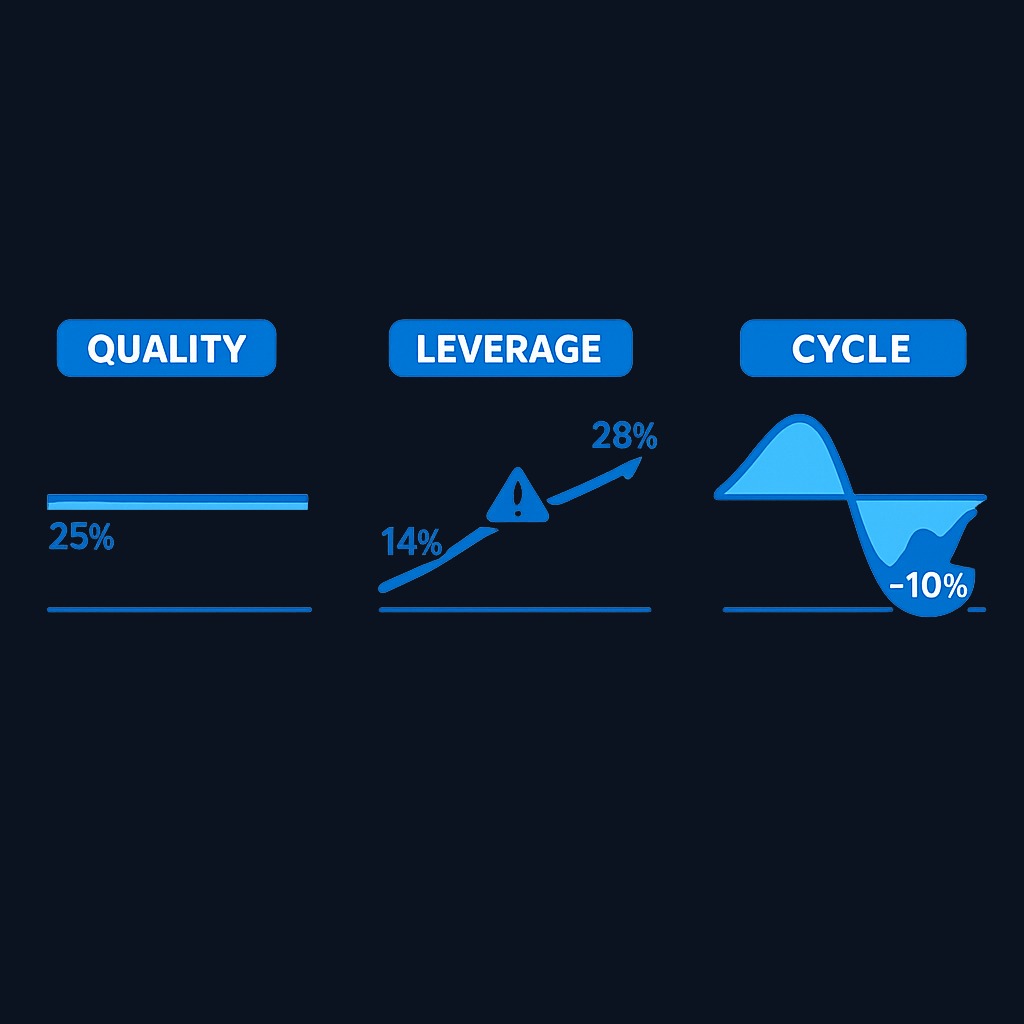
The lesson repeats: the ratio starts the analysis, and the drivers behind it finish the analysis.
What to know before deciding
Before letting ROE influence a buy or sell decision, confirm three things. First, the data source: pull net income and equity from official financial statements, since screener databases sometimes mix trailing and annual figures. Second, the company's leverage: an ROE built on a towering equity multiplier is a different proposition from the same number built on margins. Third, your comparison set: the ratio only ranks fairly inside one industry and against the company's own past. If any of the three is unclear, the honest answer is more research, not a bigger position.
Decision framework: using ROE in your analysis
- Compute or look up ROE for five or more years. Consistency matters more than any single reading.
- Run the DuPont breakdown. Identify whether margins, turnover, or leverage drive the result.
- Compare within the industry. Rank against direct competitors, not the whole market.
- Check the denominator. Large buybacks, write-downs, or negative equity distort everything downstream.
- Pair with valuation. A wonderful ROE can still be a poor investment at the wrong price, so connect quality to what you are paying.
- Verify the numbers in official financial statements rather than relying on screener summaries alone.
And before applying any of it, secure your own base: regulators encourage holding a liquid emergency fund so that investing capital stays invested through rough markets.
Conclusion and next steps
Return on equity distills capital efficiency into one percentage: profit earned per dollar of owner investment. Read it across years, decompose it into margin, turnover, and leverage, benchmark it within the industry, and stay skeptical of extremes driven by the denominator. Used this way, ROE is one of the fastest quality filters in fundamental analysis.
Next steps: pick two competitors in one industry, compute five years of ROE for each, and run the DuPont breakdown to explain the difference. If you want guided, beginner-friendly practice with ratios like this, Finelo offers structured investing education built around real-world skills.
Frequently asked questions
What is a good return on equity?
Between 10% and 20% is solid for most industries, with the caveat that capital-light sectors run higher and capital-heavy sectors lower. Consistency across years, backed by margins rather than mounting debt, matters more than one impressive figure.
What is the difference between ROE and ROA?
ROE measures profit against shareholders' equity only, while return on assets measures profit against everything the company controls, debt-funded assets included. Comparing the two exposes leverage: a big gap means debt is amplifying shareholder returns and risk together.
Can ROE be too high?
Yes. Extremely high ROE often signals a shrunken equity base from buybacks or accumulated losses rather than exceptional operations. Check the equity multiplier and the balance sheet history before treating a very high ratio as a strength.
Why is ROE negative for some companies?
Either the company lost money for the period, or its shareholders' equity is negative after sustained losses or aggressive buybacks. In both cases the ratio stops being informative, and metrics like cash flow and debt capacity tell you more.
returnequityroe
Practice investing with Finelo
Build practical investing skills with guided lessons, simulator practice, and structured challenges.
About the author
Finelo Team
The Finelo Team creates practical investing and trading education designed to help beginners learn faster with structured challenges, simulator practice, and bite-sized lessons.
Keep reading — Related articles

Investing
Tax-gain harvesting vs. tax-loss harvesting
Compare realizing investment gains with realizing losses, including holding periods, wash sales, offsets, and portfolio tradeoffs.
Finelo Team

Investing
Stable value fund vs. money market fund
Compare investment structure, contract protections, transfer restrictions, net yields, and access inside a retirement account.
Finelo Team

Investing
Single-life vs. joint-life annuity
Compare income for one lifetime with continued payments to a survivor, using equal premiums and matching guarantee terms.
Finelo Team


