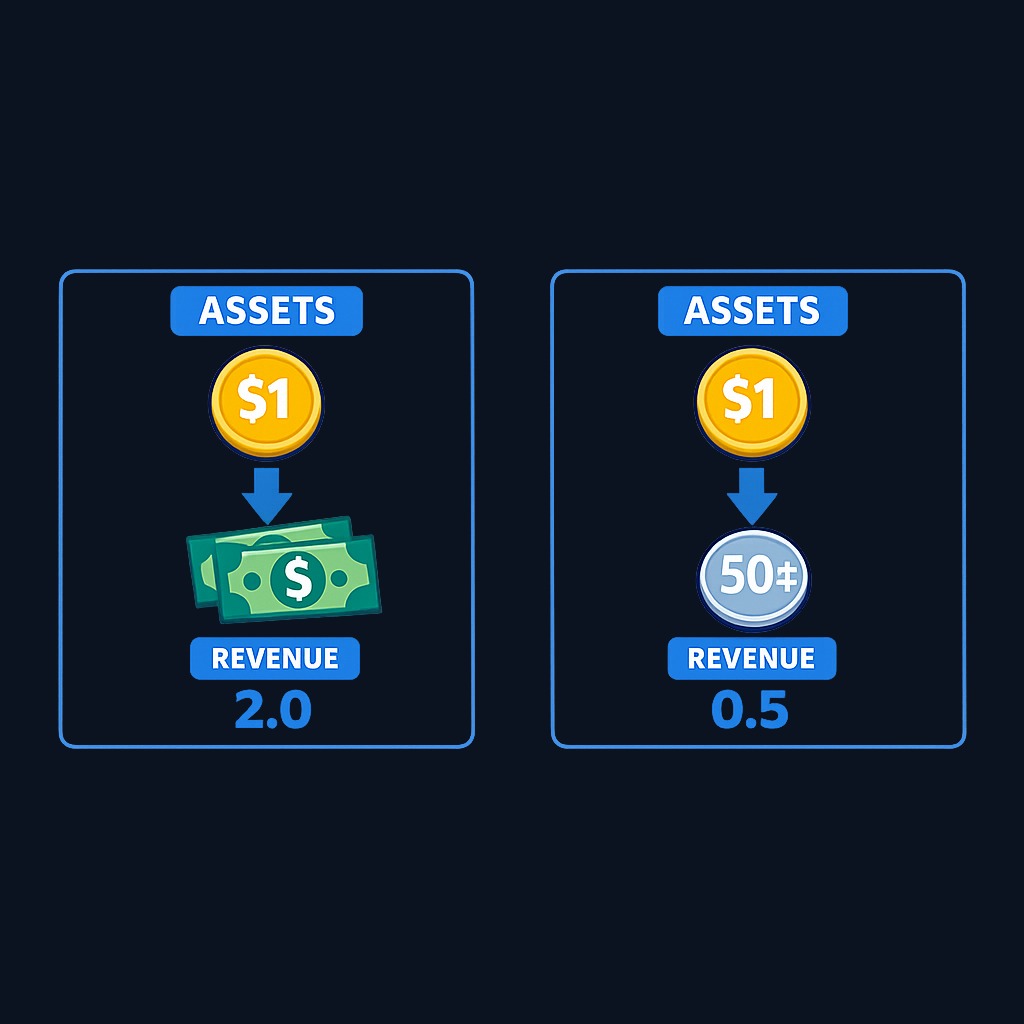
The asset turnover ratio measures how much revenue a company generates for every dollar of assets it owns. You calculate it by dividing total sales by average total assets for the period. A ratio of 2 means each dollar of assets produced two dollars of revenue; a ratio of 0.5 means the same dollar produced only fifty cents. It is the standard test of how efficiently management sweats the asset base.
What is the Asset Turnover Ratio and Why It Matters

The asset turnover ratio measures how much revenue a company generates for every dollar of assets it owns. You calculate it by dividing total sales by average total assets for the period. A ratio of 2 means each dollar…
7 min read
Practice investing with Finelo
Build practical investing skills with guided lessons, simulator practice, and structured challenges.
Want to learn more?
Build practical investing skills with guided lessons, simulator practice, and structured challenges.
Explore FineloExplore Finelo's 28-day challenges
Turn learning into a daily habit with guided challenge paths.
This page is for beginner investors learning to judge operating efficiency from financial statements. You will learn the formula, what counts as a good number by industry, real-world reading examples, the traps, and a framework for using the asset turnover ratio properly. This content is educational, not financial advice.
What the asset turnover ratio tells you
Every company is, at heart, a machine that turns assets, factories, inventory, software, receivables, cash, into sales. The asset turnover ratio measures the speed of that machine. High turnover means the company squeezes a lot of revenue from a lean asset base. Low turnover means assets sit heavy relative to the sales they produce.
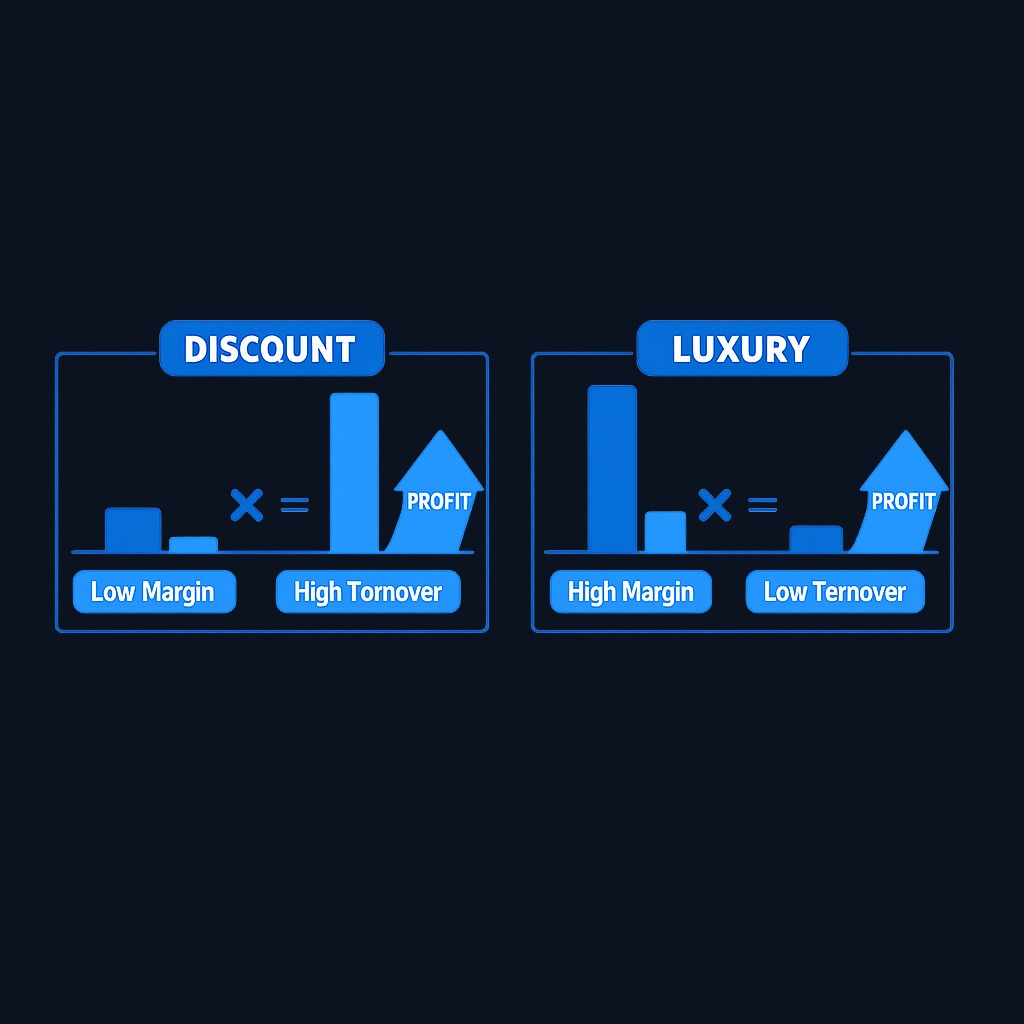
Efficiency is only half of the profitability story, which is why this ratio is best read with margins. The classic tradeoff: discount retailers run thin profit margins but enormous turnover. Luxury brands do the opposite, earning fat margins on slow turnover. Both models can create excellent returns for shareholders; what matters is that the combination of margin and turnover works. The DuPont framework formalizes this idea. It multiplies profit margin by asset turnover to explain return on assets, making turnover one of the core levers of business performance.
How to calculate the asset turnover ratio
The formula:
Asset turnover ratio = total revenue ÷ average total assets
Revenue (net sales) comes from the income statement. Total assets come from the balance sheet; use the average of beginning and ending assets to smooth mid-year acquisitions, disposals, or write-downs.
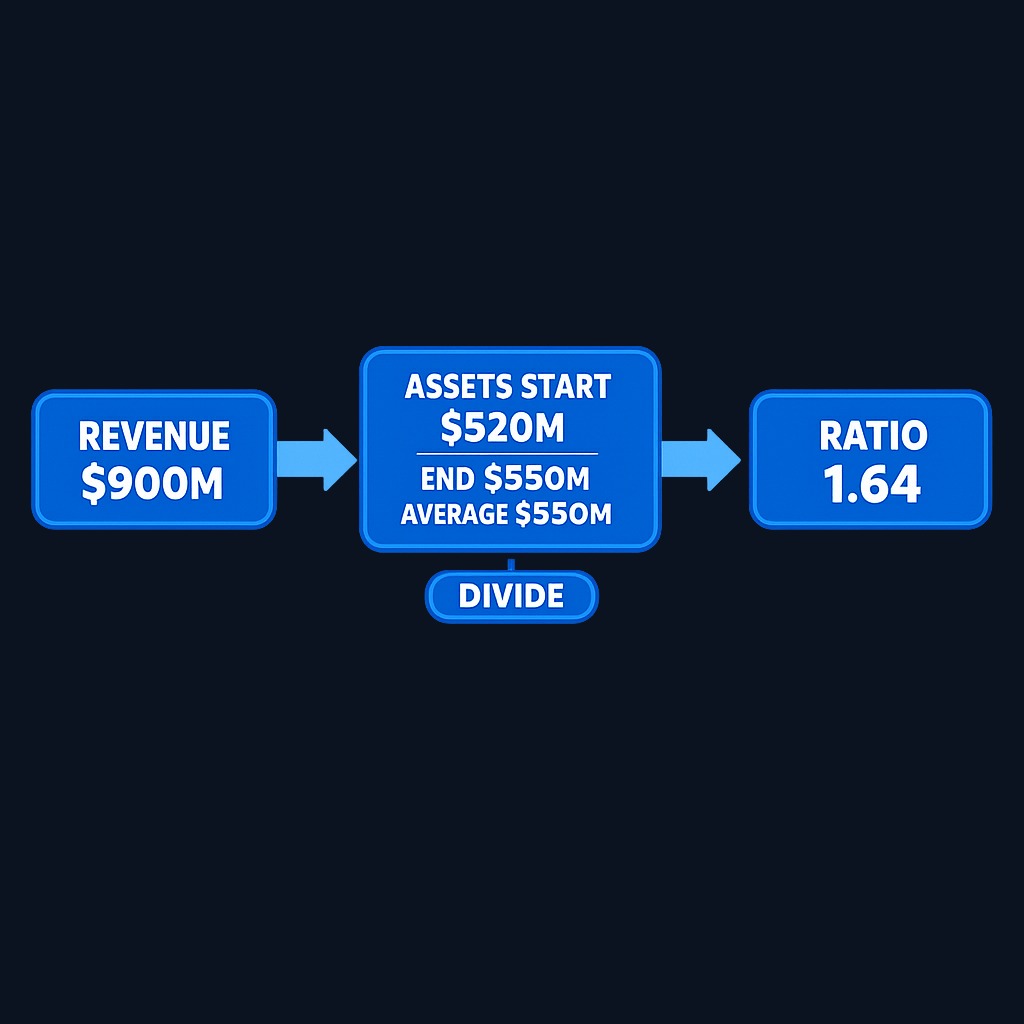
Worked example: a company reports revenue of $900 million. Total assets were $520 million at the start of the year and $580 million at the end, so average assets are $550 million. Asset turnover = 900 ÷ 550 = 1.64. Each dollar of assets generated about $1.64 in sales.
A stricter cousin exists: the fixed asset turnover ratio. It divides revenue by net fixed assets only, property, plant, and equipment. This isolates how hard the physical, long-term asset base works. Manufacturers and transport firms watch the fixed-asset version closely, since buildings and machinery dominate their balance sheets. Whichever version you use, keep the definition consistent across every company and year you compare.
Why the asset turnover ratio matters
- Efficiency scorecard. It shows whether revenue growth comes from genuinely productive assets or from continually pouring capital into the business.
- Driver of returns. Through the DuPont lens, turnover multiplies with margin to produce return on assets; improving either lever lifts overall profitability.
- Capital discipline check. A declining ratio warns that assets are piling up faster than sales. That is a common symptom of over-expansion.
- Business model X-ray. The ratio instantly reveals whether a company competes on volume (high turnover, thin margins) or on premium pricing (low turnover, rich margins).
- Trend diagnosis. Within one company, several years of the ratio expose whether new investments are ramping up productively or diluting efficiency.
Lenders and analysts also fold turnover into broader efficiency reviews. Alongside inventory turnover and receivables collection, it locates exactly where capital gets stuck.
What is a good asset turnover ratio? Industry comparisons
There is no universal benchmark, because asset intensity varies enormously by sector:
| Sector type | Typical turnover profile | Why |
|---|---|---|
| Grocery and discount retail | High, often above 2 | Low-priced goods sold in huge volume from lean stores |
| Consumer products | Moderate, around 1 | Balanced asset base of plants, brands, inventory |
| Software and services | Moderate to high | Few physical assets, though acquisitions add goodwill |
| Utilities, telecom, railroads | Low, often below 0.5 | Massive infrastructure generates revenue slowly |
| Real estate | Very low | Property values dwarf annual rental income |
The comparison rule is strict: rank a company only against direct industry peers and its own history. A supermarket chain at 2.5 and a railroad at 0.4 can both be best-in-class operators. Cross-industry comparisons of raw turnover numbers mislead every time.

Practice investing with Finelo
Build practical investing skills with guided lessons, simulator practice, and structured challenges.
Real-world reading examples
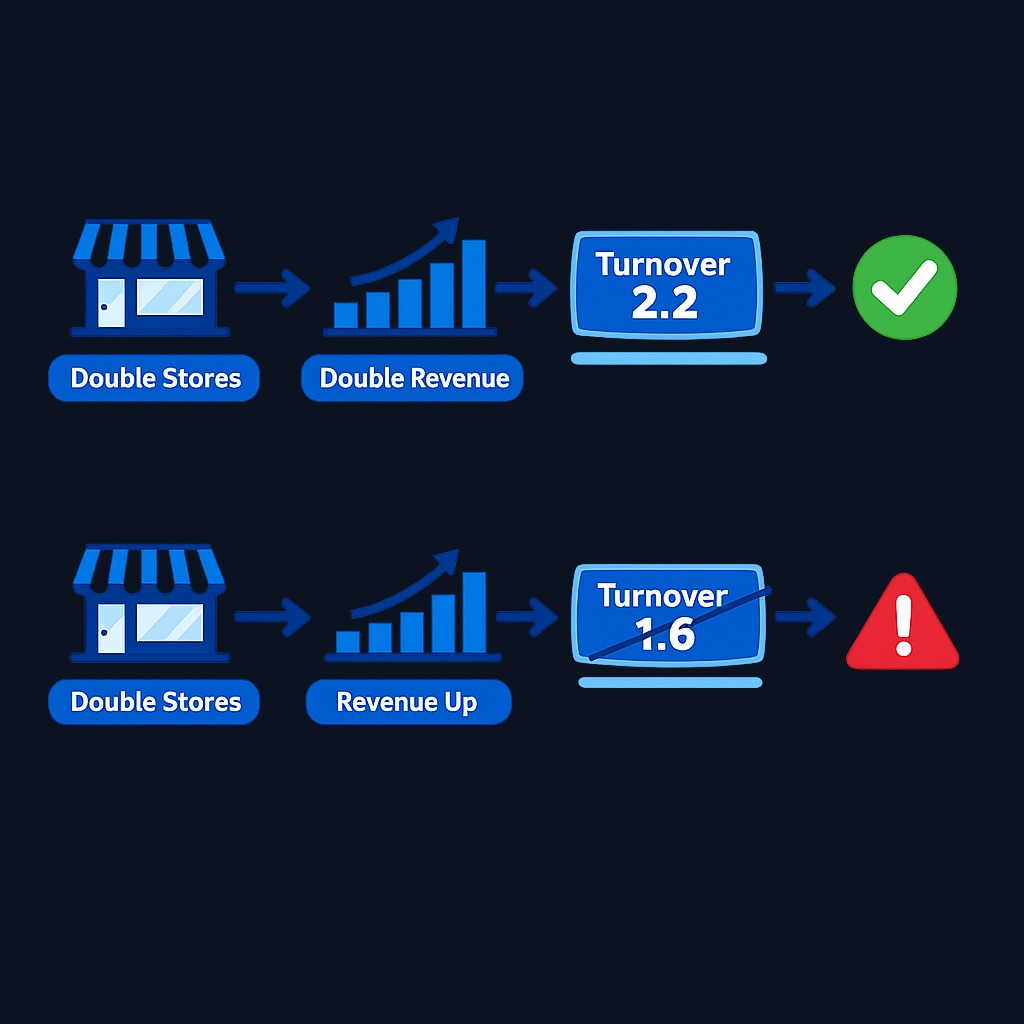
- The expansion test. A retailer doubles its store count over five years. If asset turnover holds steady while revenue doubles, the new stores are pulling their weight. If turnover slides from 2.2 to 1.6, the expansion is outrunning demand, and each new dollar of assets earns less than the last.
- The asset-light pivot. A manufacturer sells factories and outsources production. Assets shrink, so turnover jumps, even with flat sales. The ratio improved because the balance sheet changed, not because demand did; margins now carry the outsourcing cost. Reading turnover alongside margins catches the real tradeoff.
- The acquisition drag. A software firm makes a large acquisition, loading the balance sheet with goodwill. Turnover falls sharply on the bigger asset base. The drop is a mechanical effect of purchase accounting, not an operating collapse, but it resets the baseline for future comparisons.
Each example repeats one lesson: the ratio flags a change; the financial statements explain it.
Common pitfalls in interpreting the ratio
- Comparing across industries. The most frequent error, and the most misleading, given how widely asset intensity varies.
- Ignoring asset age. Old, heavily depreciated assets shrink the denominator and inflate turnover. A competitor with newer assets may look less efficient while being operationally stronger.
- Missing seasonality. Retail assets and sales swing across the year, so use full-year revenue and average assets rather than one quarter's snapshot.
- Leases and accounting shifts. Changes in lease accounting can move large asset values onto balance sheets, cutting measured turnover without any change in the business.
- Confusing efficiency with profitability. High turnover with negative margins still loses money; the ratio measures speed, not profit.
- One-year verdicts. Acquisitions, disposals, and write-downs jolt a single year's figure; trends across three to five years are the honest signal.
What to know before deciding
Before this ratio influences an investment view, verify three things. First, the inputs. Pull revenue and total assets from official financial statements, and confirm whether a data source uses year-end or average assets. Second, the composition of the asset base: goodwill from acquisitions, new leases, or aging equipment each distort comparisons in a different way. Third, the pairing: turnover only matters multiplied by margin, so check both before concluding a company uses capital well. A high-turnover, low-margin business and a low-turnover, high-margin business can be equally strong.
Decision framework: using asset turnover in your analysis
- Compute three to five years of the ratio from official statements, using average assets consistently.
- Benchmark against direct peers in the same industry, never across sectors.
- Pair with profit margin via the DuPont lens to see the full path to return on assets.
- Explain every big move. Acquisitions, disposals, accounting changes, and expansion phases all shift the ratio mechanically.
- Check the fixed-asset version for capital-intensive businesses, where machinery efficiency is the real question.
- Then form the view. Rising turnover with stable margins is a genuine efficiency gain; rising turnover from asset shrinkage deserves more skepticism.
The personal parallel is worth keeping too: households also do better when every dollar works. Regulators encourage keeping a liquid emergency fund as the base layer before putting capital to work in markets.
Conclusion and next steps
The asset turnover ratio compresses operating efficiency into one division: sales over average assets. Read it within an industry, across several years, and always beside margins, since speed and profitability only matter together. Watch for mechanical distortions from acquisitions, leases, and asset age, and let the trend, not any single figure, carry the verdict.
Next steps: choose two competitors in the same sector, compute three years of asset turnover for each, and explain the gap using their balance sheets. For structured, beginner-friendly practice with efficiency and profitability metrics, Finelo offers guided investing education you can work through at your own pace.
Frequently asked questions
What does an asset turnover ratio of 1 mean?
It means the company generated revenue equal to its average total assets over the period, one dollar of sales for each dollar of assets. Whether that is good depends entirely on the industry: strong for a utility, weak for a discount retailer.
Is a higher asset turnover ratio always better?
Generally higher signals efficiency, but not always quality. Turnover can rise because assets are old and depreciated, because the company under-invests, or because it sold productive capacity. Pair the ratio with margins and asset-age context before judging.
What is the difference between asset turnover and inventory turnover?
Asset turnover measures revenue against all assets; inventory turnover measures cost of goods sold against inventory alone. The first grades the whole capital base, while the second isolates how quickly stock moves. Retail analysis typically uses both.
Why did a company's asset turnover fall after an acquisition?
Purchase accounting adds the target's assets, plus goodwill, to the balance sheet immediately. The acquired revenue may take time to consolidate and grow. The denominator jumps first, so the ratio dips mechanically and rebuilds as integration proceeds.
assetturnoverratio
Practice investing with Finelo
Build practical investing skills with guided lessons, simulator practice, and structured challenges.
About the author
Finelo Team
The Finelo Team creates practical investing and trading education designed to help beginners learn faster with structured challenges, simulator practice, and bite-sized lessons.
Keep reading — Related articles

Investing
Tax-gain harvesting vs. tax-loss harvesting
Compare realizing investment gains with realizing losses, including holding periods, wash sales, offsets, and portfolio tradeoffs.
Finelo Team

Investing
Stable value fund vs. money market fund
Compare investment structure, contract protections, transfer restrictions, net yields, and access inside a retirement account.
Finelo Team

Investing
Single-life vs. joint-life annuity
Compare income for one lifetime with continued payments to a survivor, using equal premiums and matching guarantee terms.
Finelo Team


