The dividend coverage ratio measures how many times a company could pay its dividend out of its earnings. You calculate it by dividing net income by the total dividends paid. A ratio of 2 means the company earns twice what it pays out. A ratio near or below 1 means the dividend consumes most or all of the profits, which raises questions about how long the payout can last.
What is the Dividend Coverage Ratio and Why Does It Matter?
The dividend coverage ratio measures how many times a company could pay its dividend out of its earnings. You calculate it by dividing net income by the total dividends paid. A ratio of 2 means the company earns twice…
7 min read
Practice investing with Finelo
Build practical investing skills with guided lessons, simulator practice, and structured challenges.
Want to learn more?
Build practical investing skills with guided lessons, simulator practice, and structured challenges.
Explore FineloExplore Finelo's 28-day challenges
Turn learning into a daily habit with guided challenge paths.
Income investors watch this number because dividends are promises funded by profits. This guide explains the formula, how to interpret the results, what moves the ratio, and the traps to avoid. It is educational content, not financial advice, so verify any company's figures in its official filings before investing.
Understanding the formula
The standard version is simple:
Dividend coverage ratio = net income ÷ total dividends paid
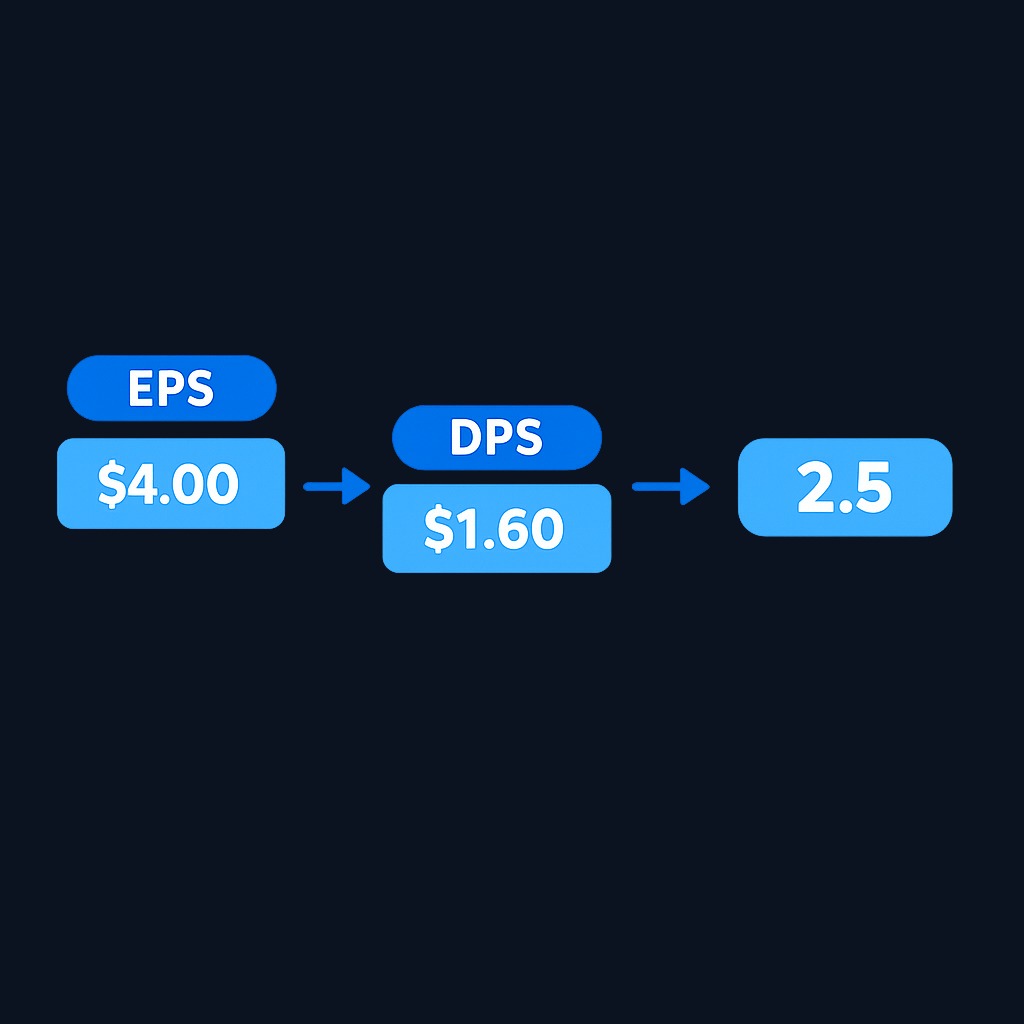
A per-share version gives the same answer: earnings per share divided by dividends per share. For example, a company earning $4.00 per share and paying $1.60 per share has a coverage ratio of 4.00 ÷ 1.60 = 2.5. The company earns two and a half times its dividend.
Two refinements make the ratio sharper:
- For companies with preferred shares, subtract preferred dividends from net income before dividing by common dividends, so the ratio reflects what is truly available to common shareholders.
- Cash-based variants replace net income with free cash flow, since dividends are paid in cash, not accounting profits. A company can report solid earnings while lacking the cash to fund its payout, and the cash version exposes that gap.
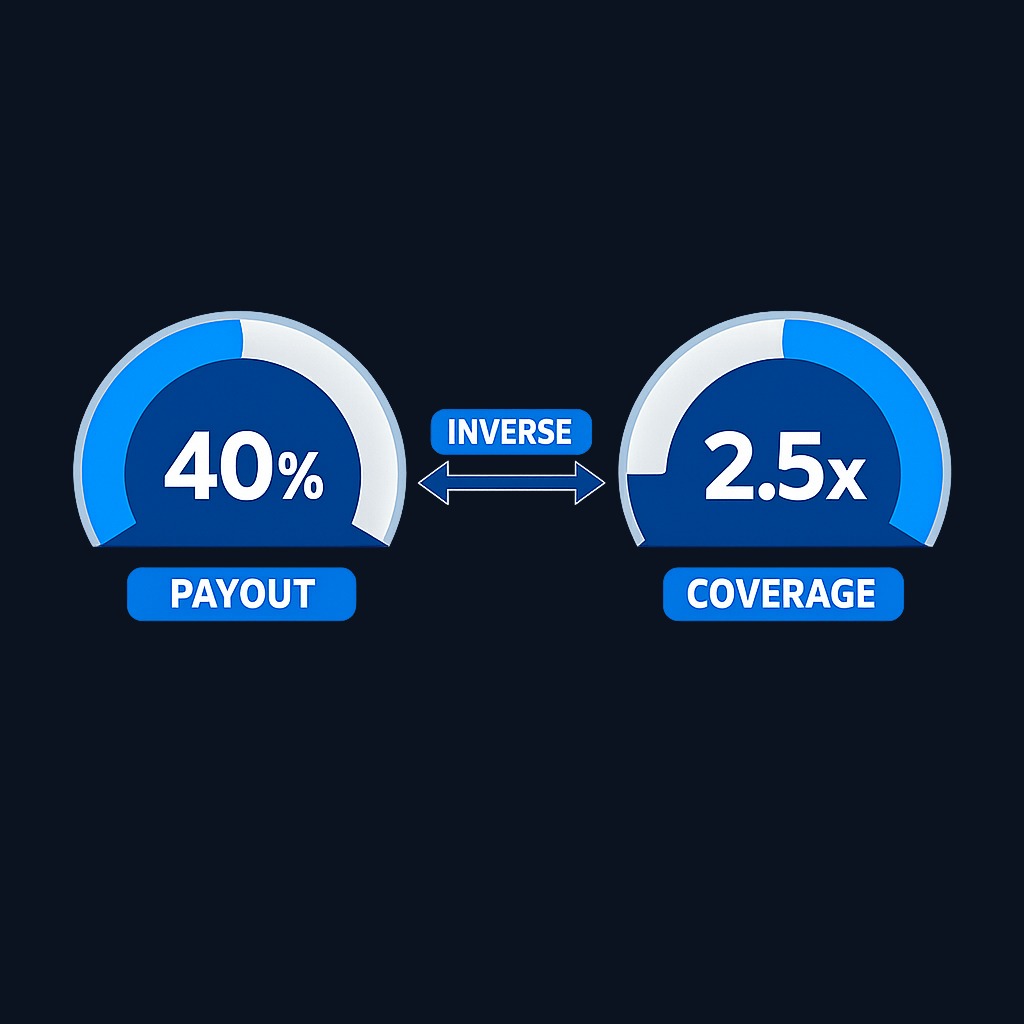
The coverage ratio is the inverse of the payout ratio. A payout ratio of 40% equals a coverage ratio of 2.5; the two numbers describe the same relationship from opposite ends.
Interpreting the dividend coverage ratio
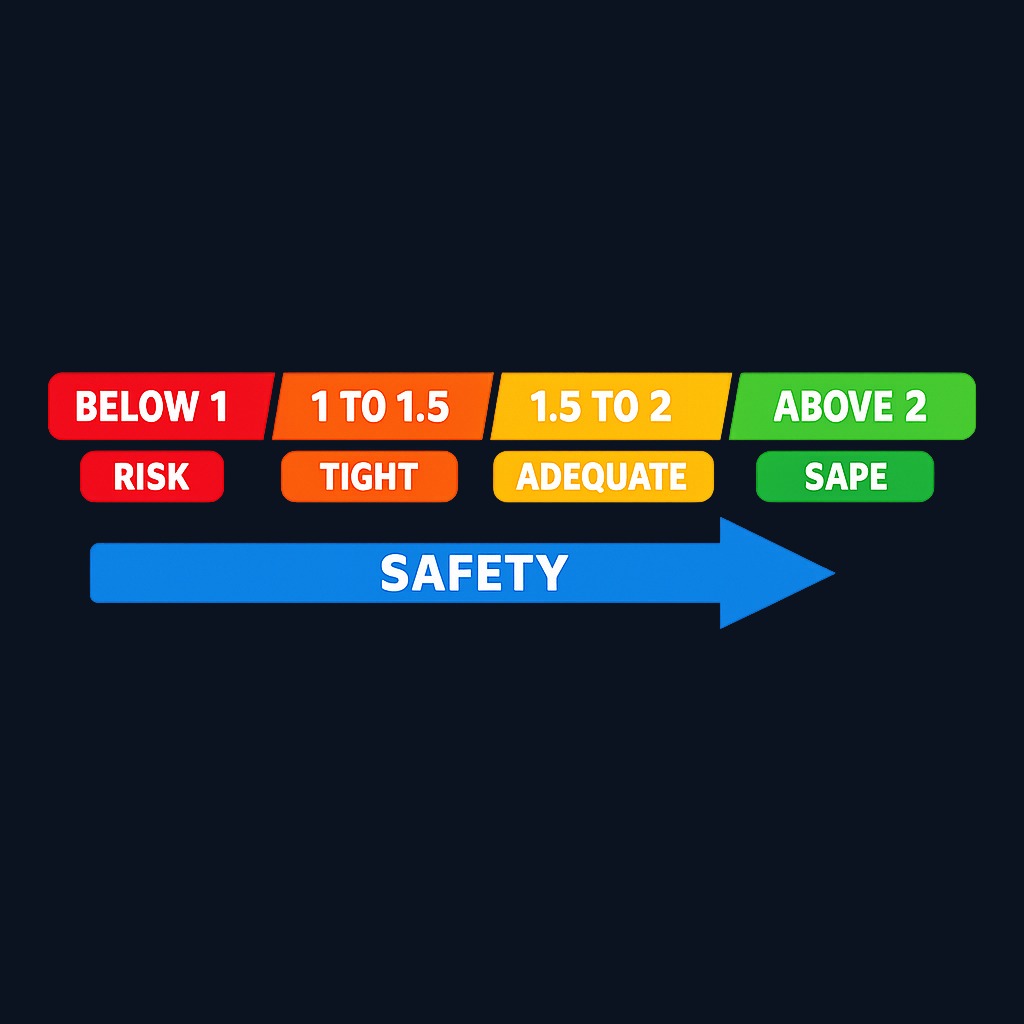
Use these bands as a starting point:
- Above 2: comfortable. The company retains at least half its earnings, leaving a cushion for bad years and money for growth.
- Between 1.5 and 2: adequate but worth monitoring, especially in cyclical industries.
- Between 1 and 1.5: tight. A modest earnings decline could force a choice between the dividend and the balance sheet.
- Below 1: the company pays out more than it earns. That can be funded temporarily from cash reserves, asset sales, or borrowing, but it is not sustainable indefinitely.
Context shapes these bands. Utilities and other regulated businesses run steadier earnings, so lower coverage is more acceptable there. Cyclical companies, such as miners or automakers, need higher coverage in good years because earnings can halve in bad ones. Certain structures, like real estate investment trusts, are designed to distribute most of their income, so their coverage will always look thin against ordinary standards; specialized cash flow measures serve better in that corner of the market.
The trend deserves as much attention as the level. A coverage ratio drifting downward across several years, from 2.5 toward 1.2, tells a story of a dividend growing faster than the profits behind it. That drift often precedes trouble, even while the ratio still sits above 1.
Factors influencing the dividend coverage ratio
Several forces move the ratio, some obvious and some sneaky:
- Earnings volatility. The numerator swings with the business cycle, so the ratio of a cyclical company can look excellent at the peak and dire at the trough on the same dividend.
- Dividend policy. Boards that raise dividends faster than earnings growth erode coverage year by year. Aggressive dividend growth streaks can become traps when management defends the streak past the point of prudence.
- One-off items. Asset sales, write-downs, and other unusual gains or losses distort net income. Strip them out, or use several years of figures, before trusting the ratio.
- Cash conversion. Earnings that never become cash cannot pay dividends. Rising receivables or heavy capital spending can leave reported profits intact while draining the cash the payout depends on.
- Debt and interest costs. Rising interest expense eats into net income before dividends are considered, so leverage quietly reduces coverage over time.
A real-world style example
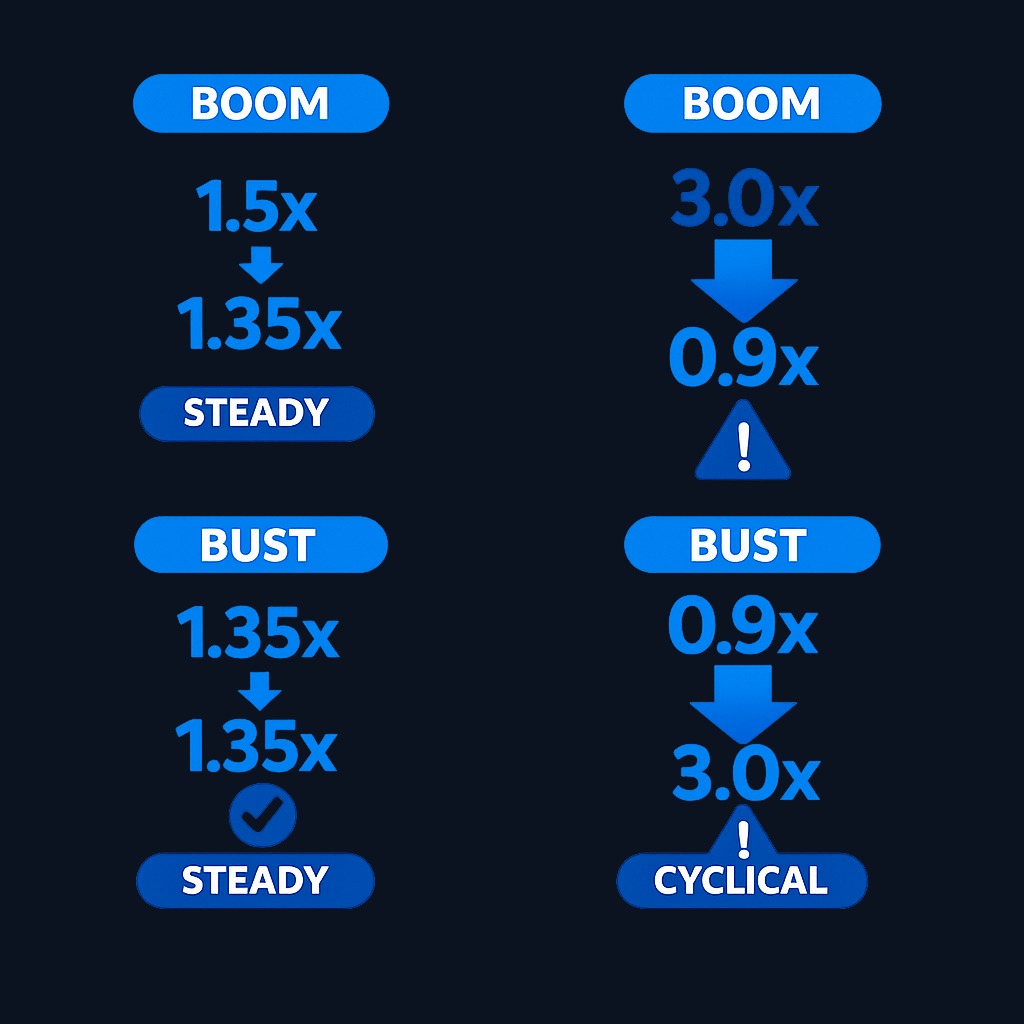
Compare two fictional companies, each paying $100 million in dividends. Steady Utilities earns $150 million with regulated, predictable revenue: coverage of 1.5, thin by general standards but reasonable for the business model. Cyclical Motors earns $300 million at the top of an auto cycle: coverage of 3.0 that looks far safer.
Now run a recession through both. Steady Utilities' earnings dip to $135 million, and coverage eases to 1.35; the dividend survives. Cyclical Motors' earnings drop 70% to $90 million, coverage falls below 1, and the board faces a cut, borrowing, or spending down reserves. The lesson: coverage must be judged against earnings volatility, not in isolation. The higher starting ratio was not conservative enough for the business attached to it.
Practice investing with Finelo
Build practical investing skills with guided lessons, simulator practice, and structured challenges.
Common misconceptions and pitfalls
"A high ratio means a safe dividend." Mostly, but not always. Coverage built on peak-cycle earnings or one-off gains can evaporate. Check the quality and stability of the earnings, not just the multiple.
"Below 1 means an immediate cut." Not necessarily immediate. Companies can bridge short gaps with cash on hand or borrowing, and some deliberately hold payouts through a known rough patch. The question is whether the gap is temporary and whether management has the balance sheet to bridge it.
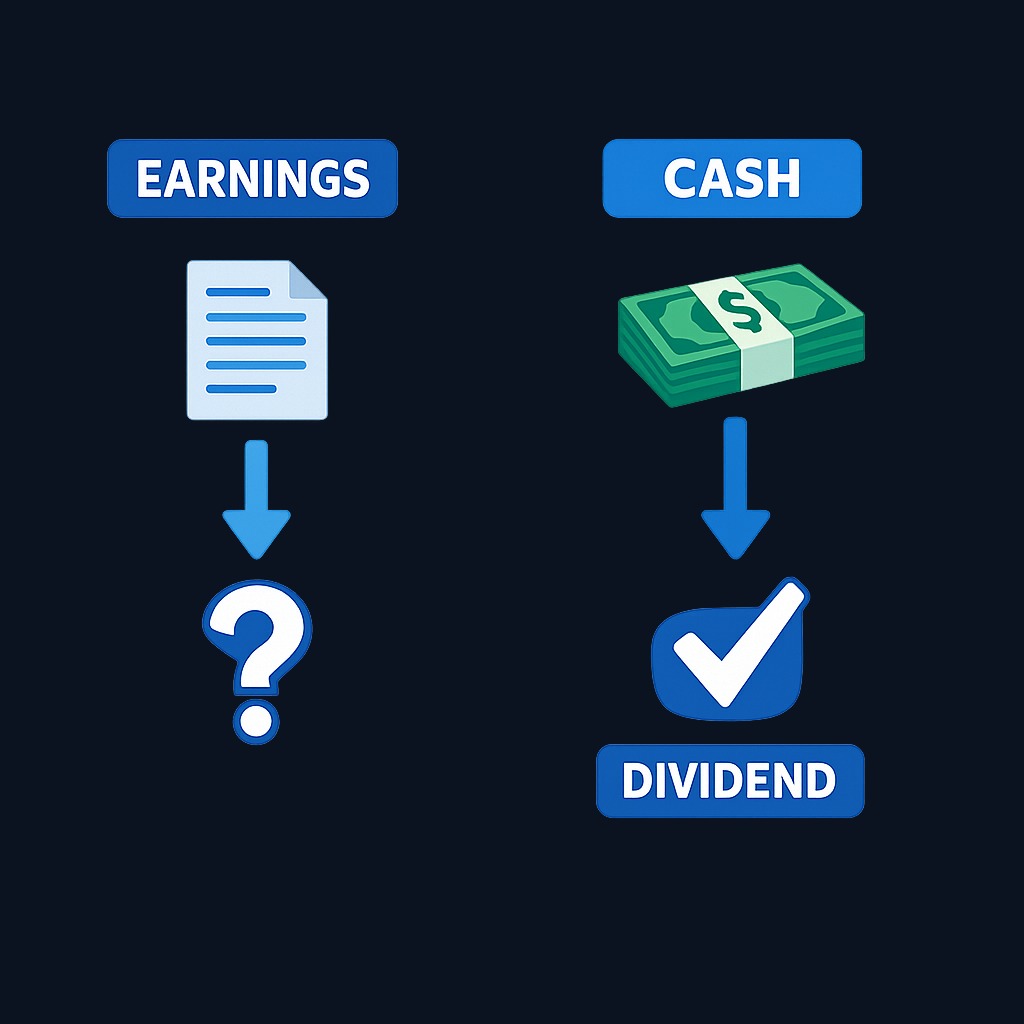
"Earnings coverage is enough." Dividends are paid in cash. When reported profits and cash flow diverge, the cash version of the ratio is the honest one.
"One year tells the story." A single year's ratio mixes cycle, accidents, and accounting. Five-year views reveal the real relationship between profits and payouts.
"All sectors follow the same benchmarks." Payout-heavy structures and regulated industries play by different rules. Compare companies against their own sector's norms.
What to know before deciding
Before buying a stock for its dividend, compute the coverage ratio from official filings for the last five years, using both earnings and free cash flow versions; public-company reports are searchable through the SEC's EDGAR database. Watch the direction of travel, strip out one-off items, and read management's own language about capital allocation priorities. Then stress-test: if earnings fell by the worst percentage this company has experienced in the past two decades, would the dividend still be covered? A yield that requires everything to go right is a risk dressed as income.
Decision framework: judging a dividend's safety
- Compute both versions. Earnings coverage and cash flow coverage, over five years.
- Set the bar by business type. Demand higher coverage from cyclical earners, accept lower from regulated, steady ones.
- Check the trend. Falling coverage with a rising dividend is the classic warning pattern.
- Inspect the balance sheet. Debt maturities and interest costs compete with shareholders for the same cash.
- Read the payout history. A company that cut before will cut again under similar pressure; a company that has held through recessions has revealed its priorities.
- Decide what the dividend is for. If your plan depends on that income, size the position so a cut would be an annoyance, not a crisis.
Conclusion and next steps
The dividend coverage ratio tells you how many times profits cover the payout: net income divided by dividends paid, ideally checked in cash flow form as well. Read it by level, trend, and business type, clean out one-off distortions, and let a five-year view rather than a single number shape your judgment about whether an attractive yield is durable income or a warning sign.
Next steps: take your highest-yielding holding and compute its coverage both ways for the past five years. If the trend points down while the dividend climbs, dig deeper before adding more. For structured lessons on dividend metrics and income investing, Finelo offers step-by-step education for beginner investors.
Frequently asked questions
What is a good dividend coverage ratio?
Above 2 is generally comfortable for most industries, meaning the company earns at least double its payout. Steadier businesses can justify somewhat less, while cyclical companies deserve a higher bar. Judge the number against the sector and the company's own history.
Is the dividend coverage ratio the same as the payout ratio?
They are mirror images. Coverage divides earnings by dividends; payout divides dividends by earnings. A coverage ratio of 2 equals a payout ratio of 50%. Investors use whichever framing they find clearer.
Should I use earnings or free cash flow to measure coverage?
Use both. Earnings coverage is the standard reference, but dividends are paid in cash, so free cash flow coverage catches problems accounting profits can hide. When the two disagree sharply, trust the cash version and investigate why.
Can a company pay dividends with a coverage ratio below 1?
Yes, for a while, by drawing on cash reserves, selling assets, or borrowing. Some companies bridge a bad year this way and recover. Sustained sub-1 coverage, though, means the payout is being funded by the balance sheet rather than the business.
dividendcoverageratio
Practice investing with Finelo
Build practical investing skills with guided lessons, simulator practice, and structured challenges.
About the author
Finelo Team
The Finelo Team creates practical investing and trading education designed to help beginners learn faster with structured challenges, simulator practice, and bite-sized lessons.
Keep reading — Related articles

Investing
Tax-gain harvesting vs. tax-loss harvesting
Compare realizing investment gains with realizing losses, including holding periods, wash sales, offsets, and portfolio tradeoffs.
Finelo Team

Investing
Stable value fund vs. money market fund
Compare investment structure, contract protections, transfer restrictions, net yields, and access inside a retirement account.
Finelo Team

Investing
Single-life vs. joint-life annuity
Compare income for one lifetime with continued payments to a survivor, using equal premiums and matching guarantee terms.
Finelo Team


