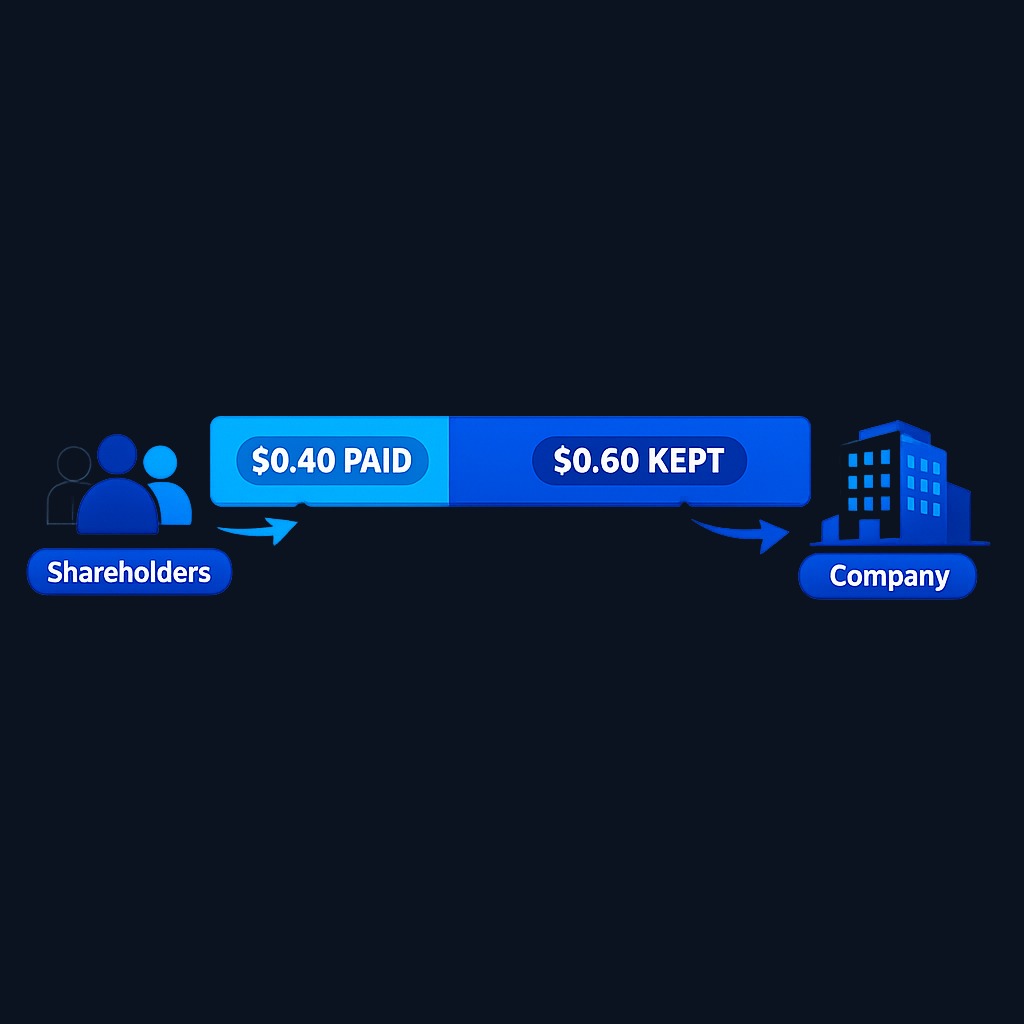
The dividend payout ratio tells you what share of a company's profit is paid to shareholders as dividends. You calculate it by dividing total dividends by net income, or dividends per share by earnings per share. A ratio of 40% means the company pays out 40 cents of every dollar it earns and keeps the rest.
What is the Dividend Payout Ratio and Why Does It Matter?
The dividend payout ratio tells you what share of a company's profit is paid to shareholders as dividends. You calculate it by dividing total dividends by net income, or dividends per share by earnings per share. A…
9 min read
Practice investing with Finelo
Build practical investing skills with guided lessons, simulator practice, and structured challenges.
Want to learn more?
Build practical investing skills with guided lessons, simulator practice, and structured challenges.
Explore FineloExplore Finelo's 28-day challenges
Turn learning into a daily habit with guided challenge paths.
This page is for investors who want to judge whether a dividend is sustainable, generous, or fragile. You will learn the formula, how to read high and low ratios, how industries differ, and the mistakes beginners make. Work through the examples, then apply the same checks to the stocks you follow. Everything here is educational, not financial advice.
What the dividend payout ratio measures
Every profitable company faces a choice each year: return profit to shareholders or reinvest it in the business. The dividend payout ratio captures that split in a single number. It shows the percentage of earnings a company chooses to pay out rather than retain.
The portion the company keeps is called retained earnings, and it funds growth, debt repayment, and rainy-day reserves. A payout ratio of 30% means 70% of profit stays inside the business. A ratio of 90% means almost every dollar earned goes straight out the door to investors. Neither number is automatically good or bad. The ratio describes a company's priorities, and your job as an investor is to decide whether those priorities match what you want from the stock, whether that is income today or growth tomorrow.
How to calculate the dividend payout ratio
There are two equivalent formulas, and both use figures from a company's income statement and dividend announcements:
Payout ratio = total dividends paid ÷ net income
Payout ratio = dividends per share (DPS) ÷ earnings per share (EPS)
Both are usually expressed as a percentage. Multiply the result by 100.
A worked example
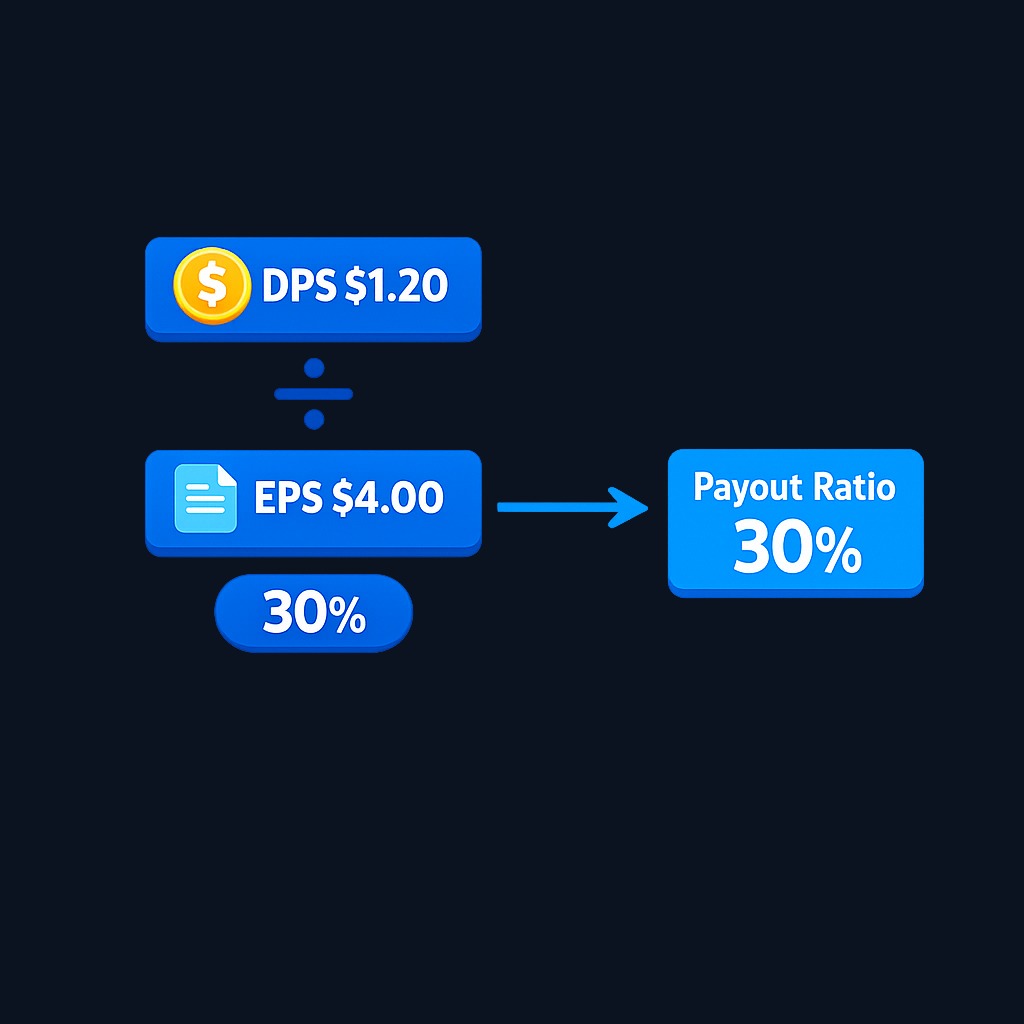
Suppose a company earns $200 million in net income for the year and pays $60 million in dividends. The payout ratio is 60 ÷ 200 = 0.30, or 30%.
On a per-share basis, imagine the same company has EPS of $4.00 and pays an annual dividend of $1.20 per share. The math is 1.20 ÷ 4.00 = 0.30. Same answer, 30%, just computed from per-share figures.
A second example with a warning sign
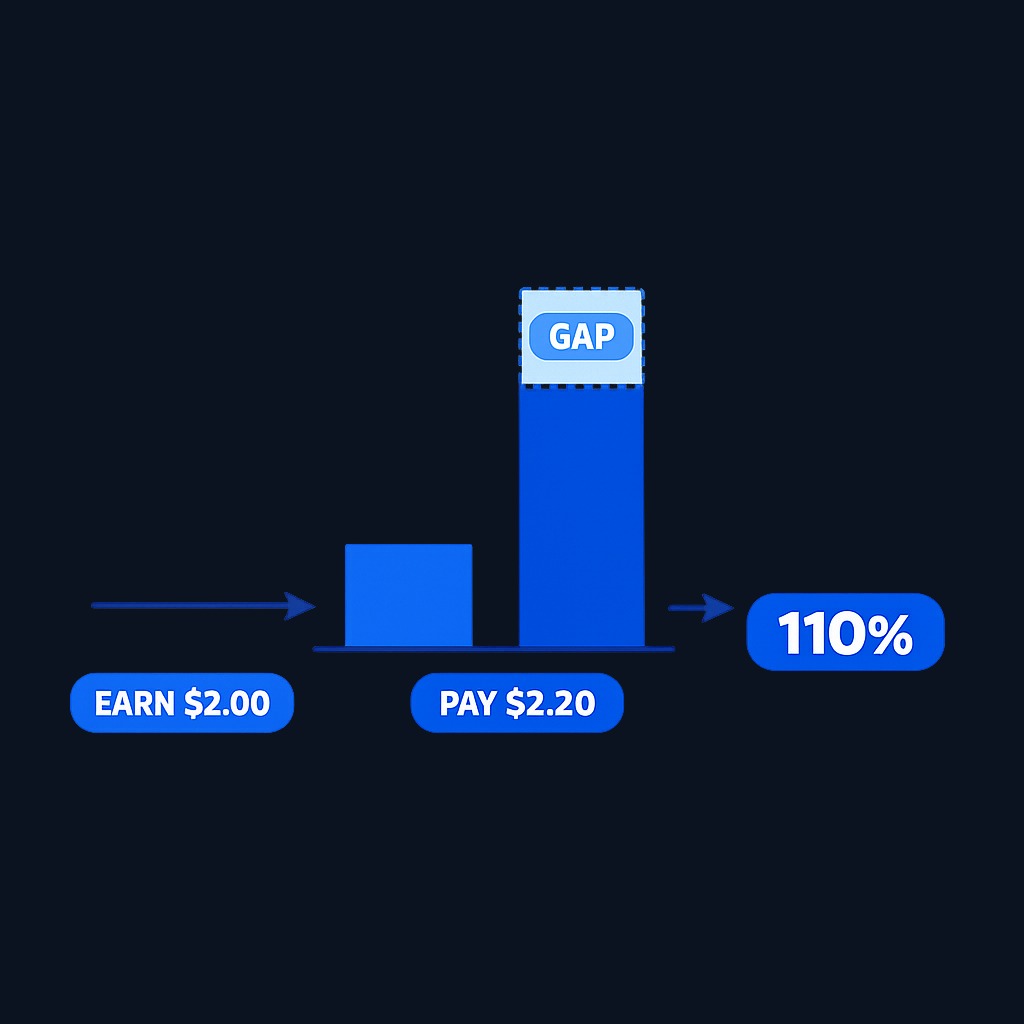
Now take a company with EPS of $2.00 paying a $2.20 annual dividend. Its payout ratio is 110%. The company is paying shareholders more than it earns. It must fund the gap from cash reserves, borrowing, or asset sales. That can continue for a while, but it is rarely sustainable for years on end.
| Company | EPS | Annual dividend per share | Payout ratio |
|---|---|---|---|
| A | $4.00 | $1.20 | 30% |
| B | $5.00 | $3.50 | 70% |
| C | $2.00 | $2.20 | 110% |
One caveat: net income includes one-time accounting items, such as asset write-downs or legal settlements. Some investors compute the ratio with free cash flow instead of earnings to get a cleaner view of whether the dividend is covered by real cash.
Why the dividend payout ratio matters
The ratio matters because it connects three things investors care about: current income, future growth, and safety.
First, income. If you buy a stock for its dividend, the payout ratio hints at how much room the company has to keep paying, and possibly raising, that dividend when profits wobble. A modest ratio leaves a cushion. A stretched ratio leaves none.
Second, growth. Money paid out cannot be reinvested. A young company that pays out most of its earnings has less fuel for expansion. That is why fast-growing businesses often pay little or nothing while mature ones pay steadily.
Third, signaling. Management teams know that dividend cuts scare investors, so boards set payouts they believe they can defend. A rising ratio driven by falling earnings, rather than rising dividends, is one of the most common early warnings that a cut may be coming. Watching the trend over several years tells you more than any single year's figure.
Interpreting high and low dividend payout ratios
Rules of thumb vary, but many investors read the bands roughly like this:

| Payout ratio | Common reading |
|---|---|
| 0% | No dividend; profits fully reinvested |
| 1-35% | Conservative; large cushion, room to grow the dividend |
| 35-60% | Balanced; meaningful income with reinvestment left over |
| 60-80% | Generous; watch earnings stability closely |
| Above 80% | Stretched; little margin if profits fall |
| Above 100% | Paying more than it earns; usually unsustainable |
Context changes everything. A utility with regulated, predictable cash flow can support a high ratio for decades. A cyclical manufacturer with the same ratio could be one downturn away from a cut. Also check the earnings base: in a bad year, a temporarily depressed EPS can push the ratio above 100% even though the long-run picture is fine. That is why analysts often average earnings over several years or use cash flow before judging.
A low ratio has its own story. It can mean management sees strong reinvestment opportunities, or it can mean the board is cautious after past trouble. Pair the number with the company's growth record to tell the difference.
Dividend payout ratio vs dividend yield
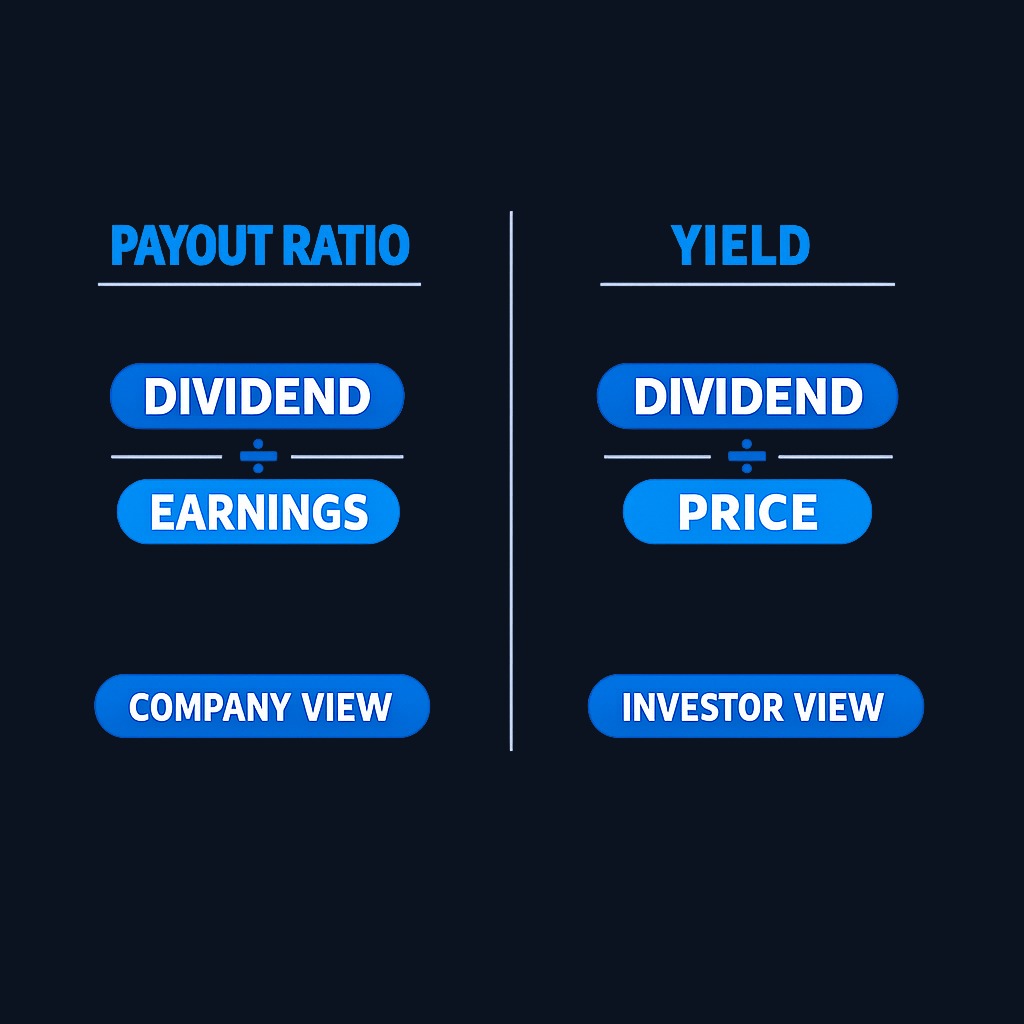
Beginners often mix these up. The payout ratio compares the dividend to the company's earnings. Dividend yield compares the dividend to the stock price. A stock can have a high yield and a low payout ratio, or the reverse, because price and earnings move independently.
Yield tells you what income you get per dollar invested today. The payout ratio tells you how affordable that income is for the company. A sky-high yield with a payout ratio above 100% is a classic value trap setup: the market is pricing in a cut that the ratio says is likely. Reading the two together protects you from chasing income that may not survive. If you want a refresher on the price side of that equation, see this walkthrough on how to calculate dividend yield.
Practice investing with Finelo
Build practical investing skills with guided lessons, simulator practice, and structured challenges.
Comparing payout ratios across industries
Typical ratios cluster by sector because business models differ:
- Utilities and consumer staples generate steady cash and commonly run high ratios.
- Real estate investment trusts (REITs) are structured to distribute most of their taxable income, so their ratios look extreme by design and are better judged against funds from operations.
- Technology and biotech firms often pay little or nothing, keeping profits for research and expansion.
- Banks and industrials usually sit in the middle, adjusting payouts across the economic cycle.
The practical rule: compare a company's payout ratio to its direct peers and to its own history, not to the whole market. A 75% ratio is normal for a utility and alarming for a semiconductor company. Cross-industry comparisons on this metric alone will mislead you.
Common misconceptions about the dividend payout ratio
- "A higher ratio is always better for income investors." Not if it leaves no cushion. Dividend durability usually beats dividend size.
- "A payout above 100% means an immediate cut." Not immediately. Companies can bridge gaps with cash or borrowing, but the longer it lasts, the higher the risk.
- "A low ratio means a stingy company." It may mean profits are being reinvested at high returns, which can grow both the business and future dividends.
- "The ratio alone proves dividend safety." It ignores debt, cash flow quality, and cyclicality. Treat it as one gauge on the dashboard, not the whole dashboard.
- "Negative ratios are meaningless." A company with losses that still pays a dividend technically has a negative ratio. The number itself is not useful, but the situation, paying dividends while losing money, is worth investigating.
What to know before deciding
A payout ratio is a snapshot built from two accounting numbers, so verify what sits behind each one before you act. Confirm whether the earnings figure includes one-time items, whether the dividend shown is the regular payout or includes special dividends, and how the ratio has trended over several years. Also remember taxes shape your real income: the IRS distinguishes between ordinary and qualified dividends, which are taxed at different rates, so the after-tax value of a payout depends on your situation. Finally, weigh the ratio alongside debt levels and cash flow. No single metric should decide an investment on its own.
Decision framework: how to use the payout ratio
Before acting on any payout ratio reading, run through this checklist:
- Compute it two ways. Check both the earnings-based ratio and a cash-flow-based version. Big gaps between them deserve a closer look.
- Look at five years, not one. A stable or gently rising ratio is healthier than a jumpy one.
- Benchmark against peers. Same industry, similar size. Note where your company sits in the range.
- Stress-test the earnings. Ask what happens to the ratio if EPS falls 20-30%. Would the dividend still be covered?
- Check the balance sheet. Heavy debt plus a high payout ratio is a fragile combination when conditions tighten.
- Match it to your goal. Income-focused investors may favor moderate, well-covered ratios; growth-focused investors may prefer low ratios with strong reinvestment records.
This sequence keeps you from anchoring on a single number and helps you form a view about sustainability, which is what the ratio is really for.
Conclusion and next steps
The dividend payout ratio distills a company's profit-sharing policy into one number: dividends divided by earnings. Read it against industry norms, its own history, and cash flow, and it becomes a fast, powerful check on dividend sustainability. Read it in isolation and it can fool you.
Next steps: pick two dividend stocks you follow, compute their payout ratios for each of the last five years, and note the trend. Then compare each against two industry peers. To keep building the surrounding skills, start with the basics of what a dividend is, then read up on qualified vs ordinary dividends and dividend stocks vs growth stocks.
Frequently asked questions
What is a good dividend payout ratio?
Many investors consider roughly 35-60% a balanced range for mature companies, since it funds a meaningful dividend while leaving room for reinvestment. The right level depends on the industry and earnings stability, so compare against direct peers rather than a universal target.
How is the dividend payout ratio calculated?
Divide total dividends paid by net income, or dividends per share by earnings per share, then multiply by 100. For example, a $1.50 dividend against $5.00 of EPS gives a 30% payout ratio. Use the same period for both inputs.
What is the difference between the payout ratio and dividend yield?
The payout ratio measures the dividend against company earnings; yield measures it against the stock price. The ratio speaks to affordability and sustainability, while yield speaks to your income return. Reading them together gives a fuller picture than either alone.
Can the dividend payout ratio be negative?
Yes, when a company pays a dividend despite reporting a net loss. The resulting figure is not meaningful mathematically, but it flags a situation worth researching: the dividend is being funded by something other than current profit, such as reserves or debt.
dividendpayoutratio
Practice investing with Finelo
Build practical investing skills with guided lessons, simulator practice, and structured challenges.
About the author
Finelo Team
The Finelo Team creates practical investing and trading education designed to help beginners learn faster with structured challenges, simulator practice, and bite-sized lessons.
Keep reading — Related articles

Investing
Tax-gain harvesting vs. tax-loss harvesting
Compare realizing investment gains with realizing losses, including holding periods, wash sales, offsets, and portfolio tradeoffs.
Finelo Team

Investing
Stable value fund vs. money market fund
Compare investment structure, contract protections, transfer restrictions, net yields, and access inside a retirement account.
Finelo Team

Investing
Single-life vs. joint-life annuity
Compare income for one lifetime with continued payments to a survivor, using equal premiums and matching guarantee terms.
Finelo Team


