The Treynor ratio measures how much excess return a portfolio earns for each unit of market risk it takes. You calculate it by subtracting the risk-free rate from the portfolio's return, then dividing by the portfolio's beta. A higher Treynor ratio means better reward for the systematic risk carried.
What is the Treynor Ratio and How to Use It for Investment Success

The Treynor ratio measures how much excess return a portfolio earns for each unit of market risk it takes. You calculate it by subtracting the risk-free rate from the portfolio's return, then dividing by the…
6 min read
Practice investing with Finelo
Build practical investing skills with guided lessons, simulator practice, and structured challenges.
Want to learn more?
Build practical investing skills with guided lessons, simulator practice, and structured challenges.
Explore FineloExplore Finelo's 28-day challenges
Turn learning into a daily habit with guided challenge paths.
This page is for investors who already track portfolio performance and want a risk-aware way to compare funds, strategies, or their own results. Read the formula, the worked example, and the comparison with other metrics below, then test the ratio on a fund you own. Everything here is educational, not financial advice.
The formula behind the Treynor ratio
The Treynor ratio, named after economist Jack Treynor, is written as:
Treynor ratio = (portfolio return − risk-free rate) ÷ portfolio beta
Each input plays a distinct role:
- Portfolio return is the total return your investment produced over the period you measure.
- Risk-free rate is the return available with essentially no risk, commonly proxied by short-term government securities.
- Beta measures how strongly the portfolio moves with the overall market. A beta of 1 means it tends to move in line with the market; above 1 means bigger swings.
The numerator is the excess return: what the portfolio earned beyond a riskless alternative. The denominator is systematic risk, the market-wide risk that diversification cannot remove. So the ratio answers one question: how much extra return did each unit of market risk buy?

How to calculate the Treynor ratio step by step
- Pick a period. Use the same window for every number, for example one year.
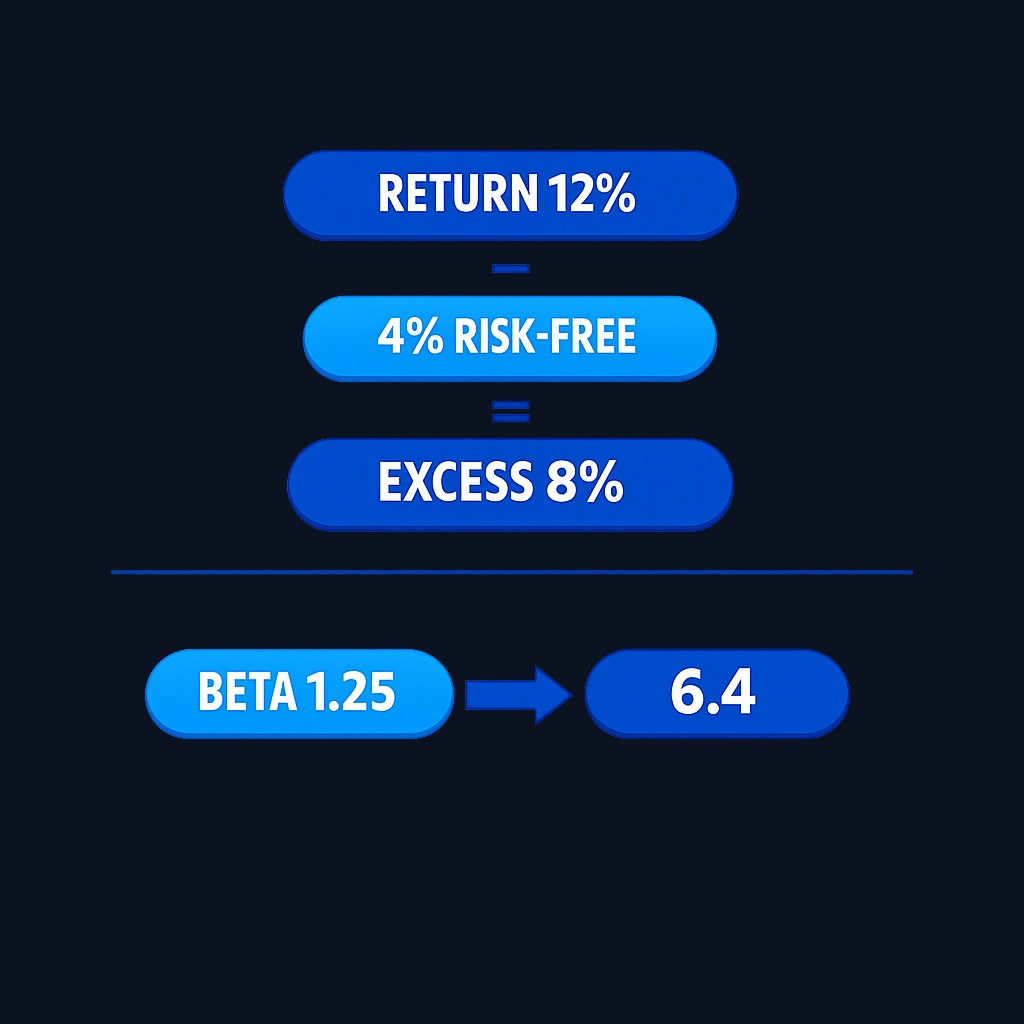
- Find the portfolio return. Suppose your fund returned 12% over the year.
- Find the risk-free rate. Analysts commonly proxy it with short-term U.S. Treasury yields, which the Federal Reserve publishes in its H.15 selected interest rates release. Assume 4% for the same period.
- Find the beta. Fund fact sheets and most research platforms publish it. Say it is 1.25.
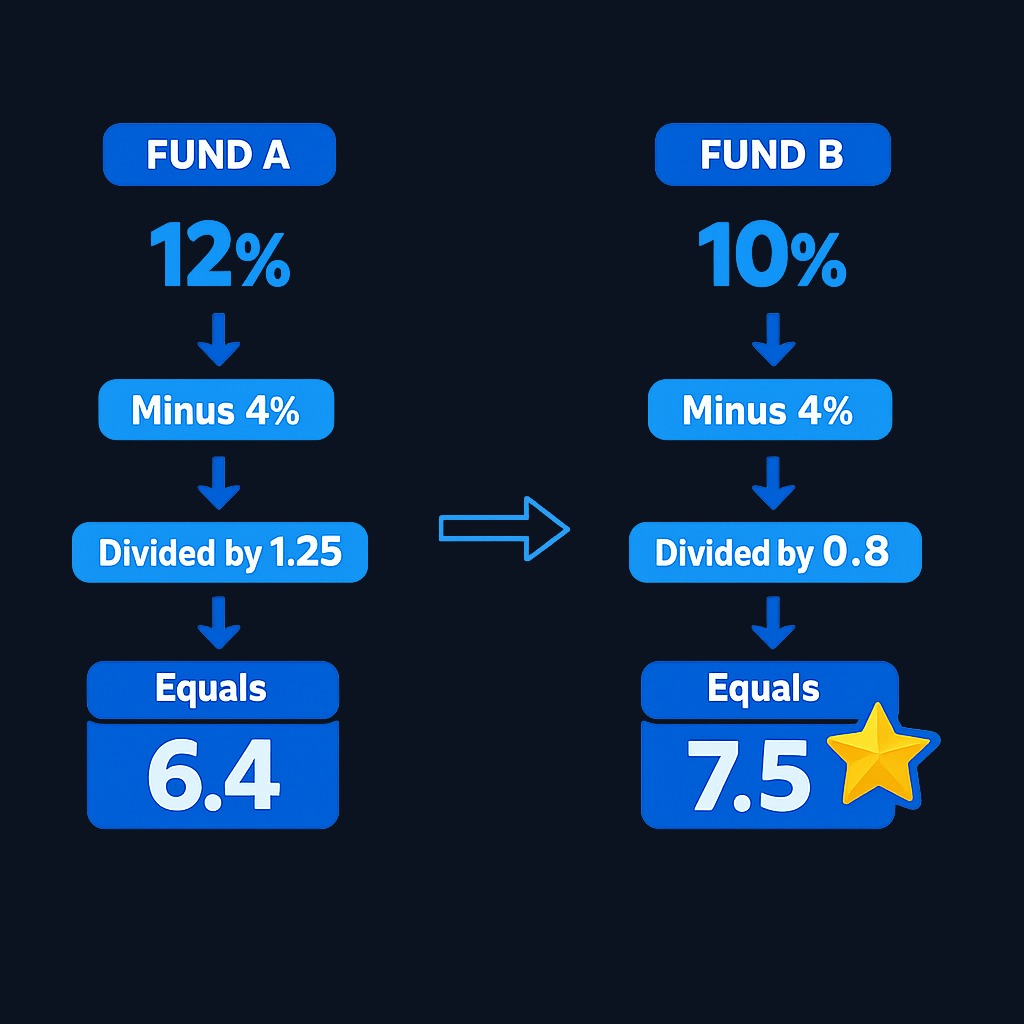
- Apply the formula. (12 − 4) ÷ 1.25 = 6.4.
Now compare that against an alternative. A second fund returns 10% with a beta of 0.8: (10 − 4) ÷ 0.8 = 7.5. The second fund earned less in raw terms but delivered more return per unit of market risk. That is exactly the kind of insight the raw return number hides, and it is why performance measurement uses risk-adjusted tools rather than headline returns alone.
Interpreting the Treynor ratio: what do the results mean?
| Reading | What it suggests |
|---|---|
| Higher than peers | Better compensation for each unit of systematic risk |
| Similar to peers | Performance in line with the risk taken |
| Lower than peers | The portfolio's return does not justify its market risk |
| Negative | Returns fell below the risk-free rate, or beta is negative; interpret with care |
Two cautions make the interpretation honest. First, the Treynor ratio is a relative measure. A value of 6.4 means little on its own; it becomes useful next to another portfolio, a benchmark, or the same portfolio in an earlier period. Second, comparisons only work when the portfolios are measured over the same period against the same market. A good habit is to line up three or four comparable funds and rank them, rather than judging one number in isolation.
Practice investing with Finelo
Build practical investing skills with guided lessons, simulator practice, and structured challenges.
Comparing the Treynor ratio with other performance metrics
| Metric | Risk measure used | Best suited for |
|---|---|---|
| Treynor ratio | Beta (systematic risk) | Diversified portfolios where market risk dominates |
| Sharpe ratio | Standard deviation (total risk) | Portfolios that may carry concentrated, unhedged positions |
| Jensen's alpha | Beta, via expected return | Asking whether a manager beat what the risk model predicted |
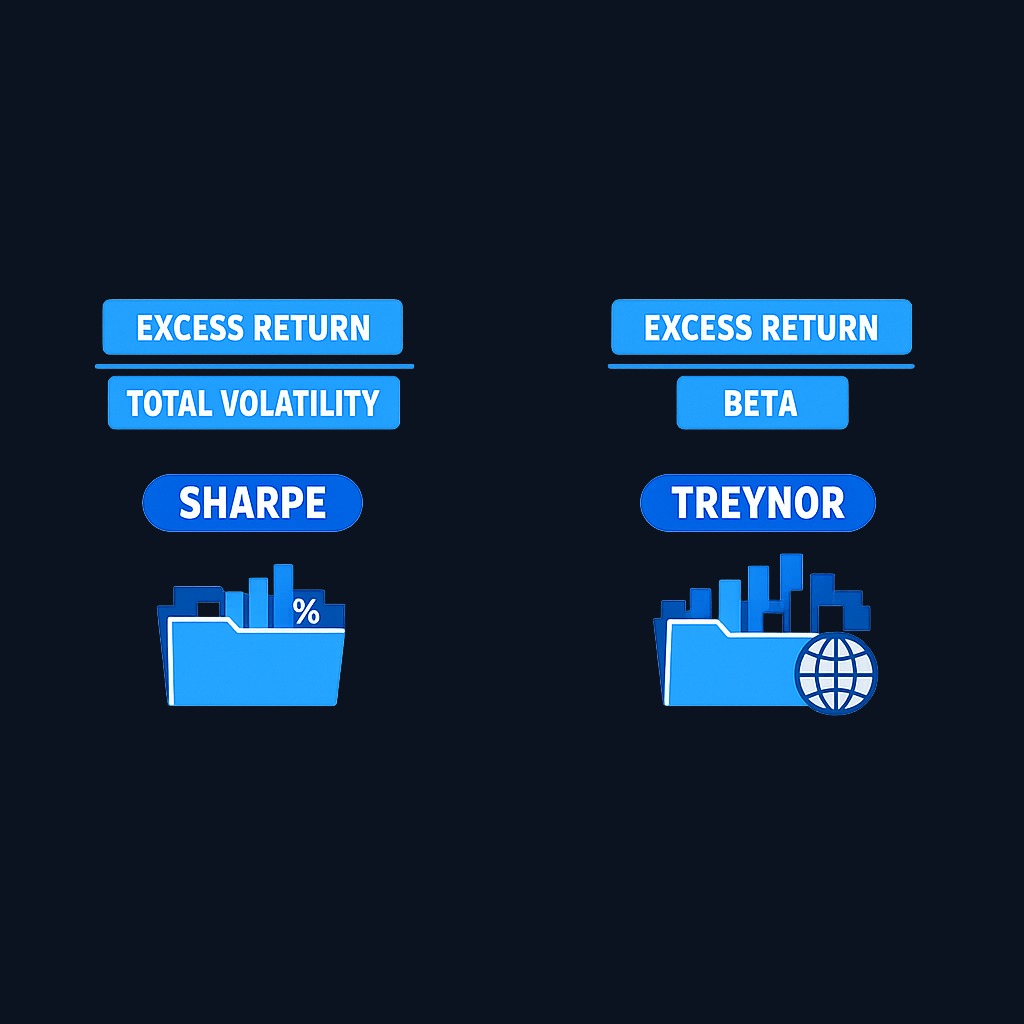
The Sharpe ratio divides excess return by total volatility, so it penalizes every kind of fluctuation. The Treynor ratio divides by beta, so it assumes unsystematic risk has already been diversified away. That assumption is the deciding factor. For a broad, well-diversified portfolio, beta captures most of the risk that matters, and the Treynor ratio is a clean measure. For a concentrated portfolio with a few large positions, standard deviation tells a fuller story, and the Sharpe ratio is usually the better tool. Many investors simply use both: agreement strengthens the conclusion, and disagreement points to hidden concentration.
Common pitfalls when using the Treynor ratio
- Applying it to undiversified portfolios. Beta ignores company-specific risk. If one stock dominates your account, the ratio understates the true risk you carry.
- Trusting a stale or mismatched beta. Beta depends on the benchmark and lookback window used to estimate it. A tech-heavy fund measured against the wrong index produces a misleading ratio.
- Comparing across different markets. Rankings only hold when every portfolio is measured against the same market index and period.
- Ignoring negative values. A negative Treynor ratio can come from weak returns or from a negative beta, and the two cases mean very different things.
- Treating the past as a forecast. The ratio describes historical performance. It says nothing certain about future returns, so use it to frame questions, not to promise outcomes.
Real-world applications of the Treynor ratio
Fund selection is the most common use. When two equity funds post similar returns, ranking them by Treynor ratio shows which one earned its performance with less market exposure. Portfolio reviews are another: recomputing the ratio each year shows whether your strategy's reward-to-risk balance is improving or decaying. Investors also use it to sanity-check a new strategy, comparing the ratio of a proposed allocation against the market itself. Institutional analysts often pair it with the Sharpe ratio and alpha in quarterly manager scorecards, using the trio to separate skill from simple risk-taking. In every use, the goal is the same: measure whether returns actually pay for the systematic risk behind them.
Conclusion and next steps
The Treynor ratio turns raw performance into a risk-aware measure: excess return divided by beta, best read side by side with peers over the same period. It rewards portfolios that earn their returns without leaning on outsized market exposure, and it breaks down when diversification is missing or beta is unreliable.
Next steps: pull the return, beta, and a risk-free proxy for two funds you follow, compute both ratios, and see whether the ranking matches your expectations. Then repeat with the Sharpe ratio and note any disagreement. If you want structured practice reading metrics like this, Finelo teaches investing fundamentals step by step.
Frequently asked questions
What does a higher Treynor ratio mean?
It means the portfolio generated more excess return for each unit of market risk. When comparing funds over the same period and benchmark, the higher ratio delivered better risk-adjusted performance on the systematic-risk dimension.
What is the difference between the Treynor ratio and the Sharpe ratio?
The Treynor ratio divides excess return by beta, which reflects only market-driven movement. The Sharpe ratio divides by standard deviation, which reflects all volatility. Use Treynor for diversified portfolios and Sharpe when concentrated positions add risk that beta misses.
How does the Treynor ratio relate to systematic risk?
Beta, the denominator, is the standard measure of systematic risk: the market-wide movements that diversification cannot eliminate. The ratio expresses performance per unit of that specific risk, ignoring the company-specific kind.
Can I use the Treynor ratio for a single stock?
You can compute it, but the result is fragile. A single stock carries heavy unsystematic risk that beta does not capture, so the ratio will flatter the stock's true risk profile. Total-risk measures suit single positions better.
treynorratioinvestmentsuccess
Practice investing with Finelo
Build practical investing skills with guided lessons, simulator practice, and structured challenges.
About the author
Finelo Team
The Finelo Team creates practical investing and trading education designed to help beginners learn faster with structured challenges, simulator practice, and bite-sized lessons.
Keep reading — Related articles

Investing
Tax-gain harvesting vs. tax-loss harvesting
Compare realizing investment gains with realizing losses, including holding periods, wash sales, offsets, and portfolio tradeoffs.
Finelo Team

Investing
Stable value fund vs. money market fund
Compare investment structure, contract protections, transfer restrictions, net yields, and access inside a retirement account.
Finelo Team

Investing
Single-life vs. joint-life annuity
Compare income for one lifetime with continued payments to a survivor, using equal premiums and matching guarantee terms.
Finelo Team


