The short interest ratio, or days to cover, divides reported short interest by a defined average daily share-volume measure. The result is a theoretical liquidity ratio, not the literal number of days shorts would need to close: covering itself changes volume and price, not all daily volume is available to shorts, and positions need not close together.
What Is the Short Interest Ratio and Why Does It Matter?

The short interest ratio, or days to cover, divides reported short interest by a defined average daily share-volume measure. The result is a theoretical liquidity ratio, not the literal number of days shorts would need…
6 min read
Practice trading with Finelo
Practice in a simulator, learn with bite-sized lessons, and build confidence before risking real money.
Want to learn more?
Practice in a simulator, learn with bite-sized lessons, and build confidence before risking real money.
Explore FineloExplore Finelo's 28-day challenges
Turn learning into a daily habit with guided challenge paths.
How to calculate the short interest ratio
The formula:
Short interest ratio = Shares sold short / Average daily trading volume
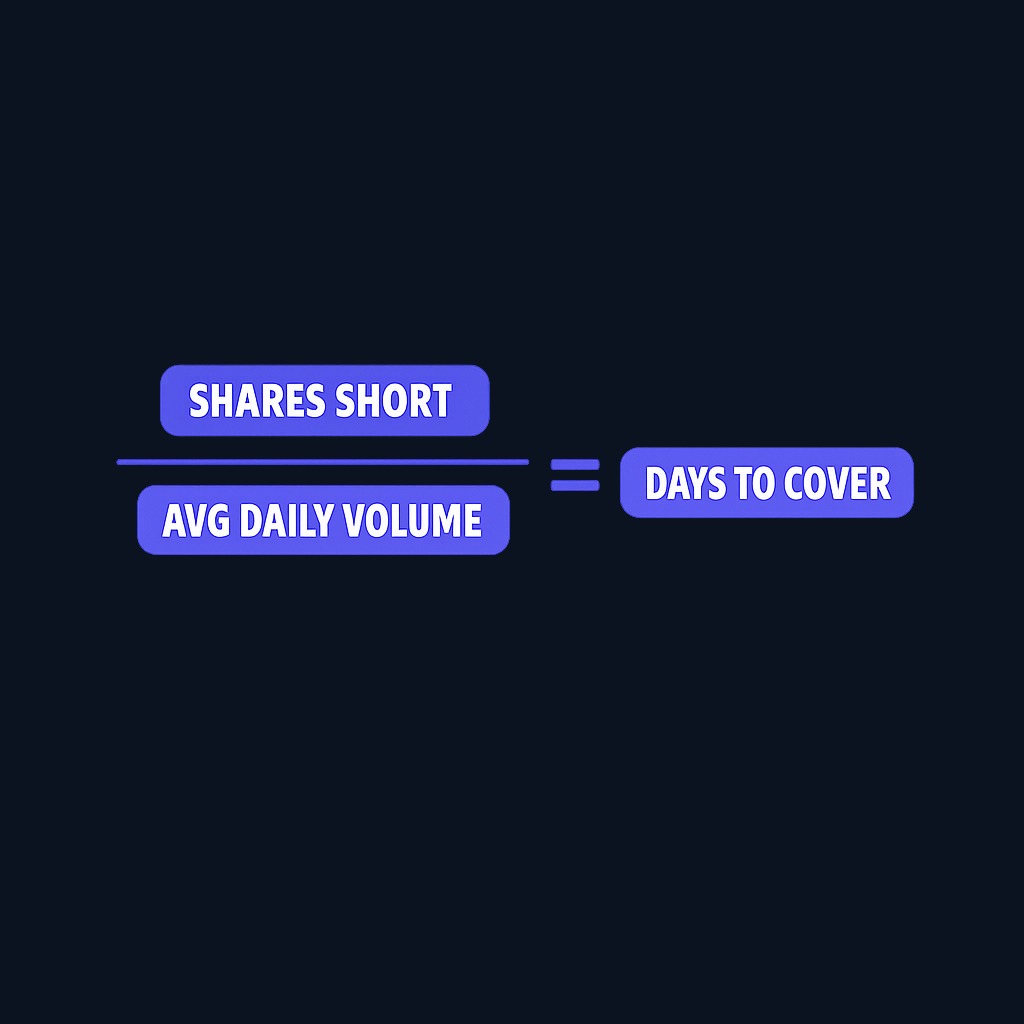
FINRA requires firms to report short-interest positions twice a month. Data vendors may use different volume windows; identify the source and averaging period before comparing ratios. FINRA's short-interest glossary states its own days-to-cover formula and volume convention.
A hypothetical worked example
Say Harbor Grid Corp. has 18 million shares sold short. Its average daily volume over the past 30 sessions is 4.5 million shares:
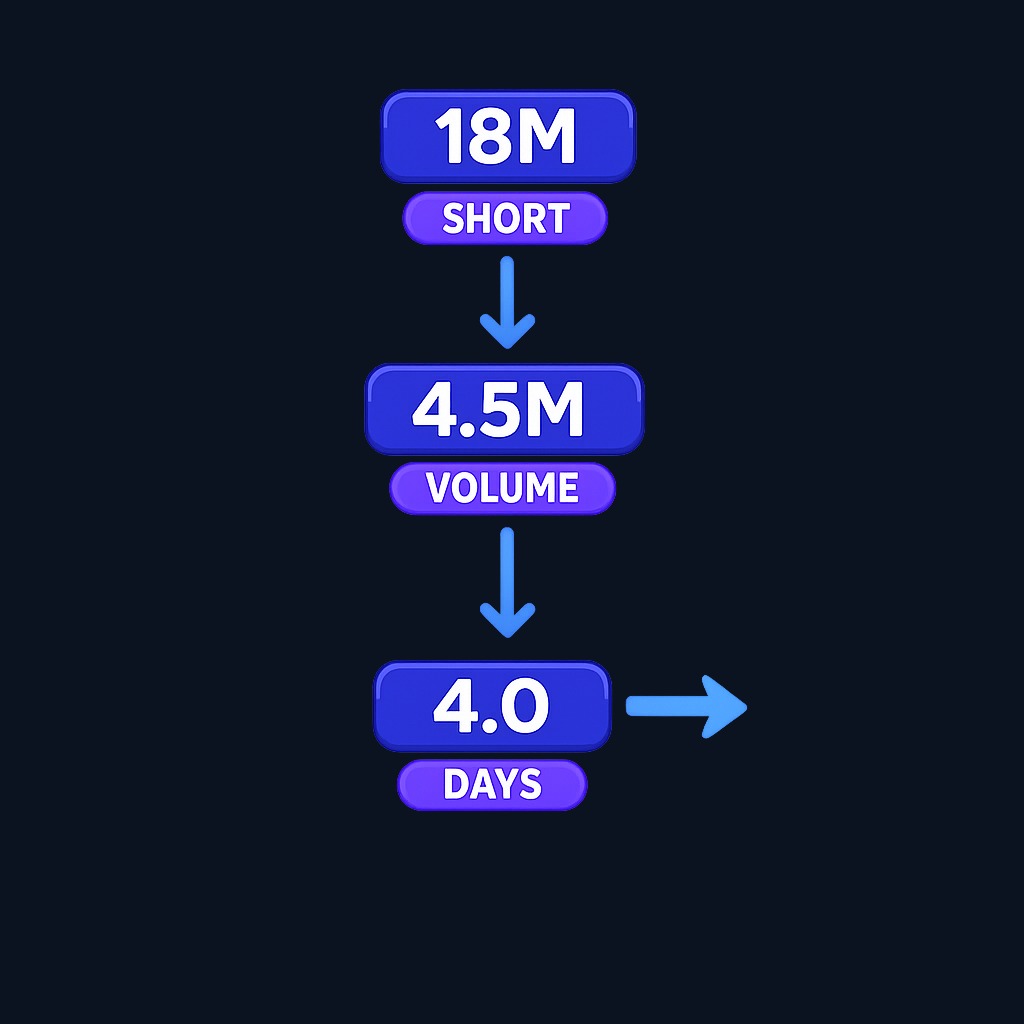
| Input | Value |
|---|---|
| Shares sold short | 18,000,000 |
| Average daily volume | 4,500,000 |
| Short interest ratio | 4.0 days to cover |
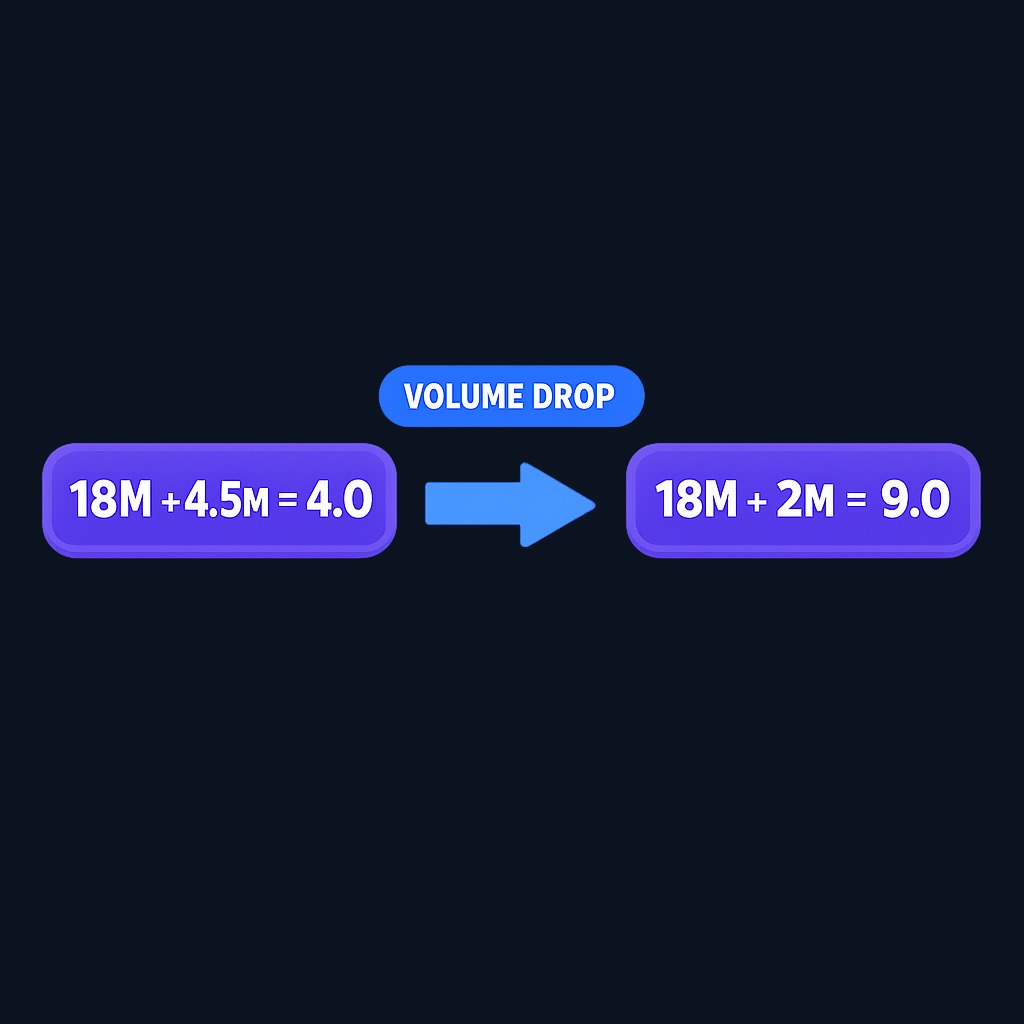
If volume dries up to 2 million shares a day while short interest holds, the ratio jumps to 9.0 without a single new short position. That sensitivity to the denominator is the most misunderstood part of the metric: days to cover can double simply because trading activity cooled.
Short interest ratio vs short percent of float
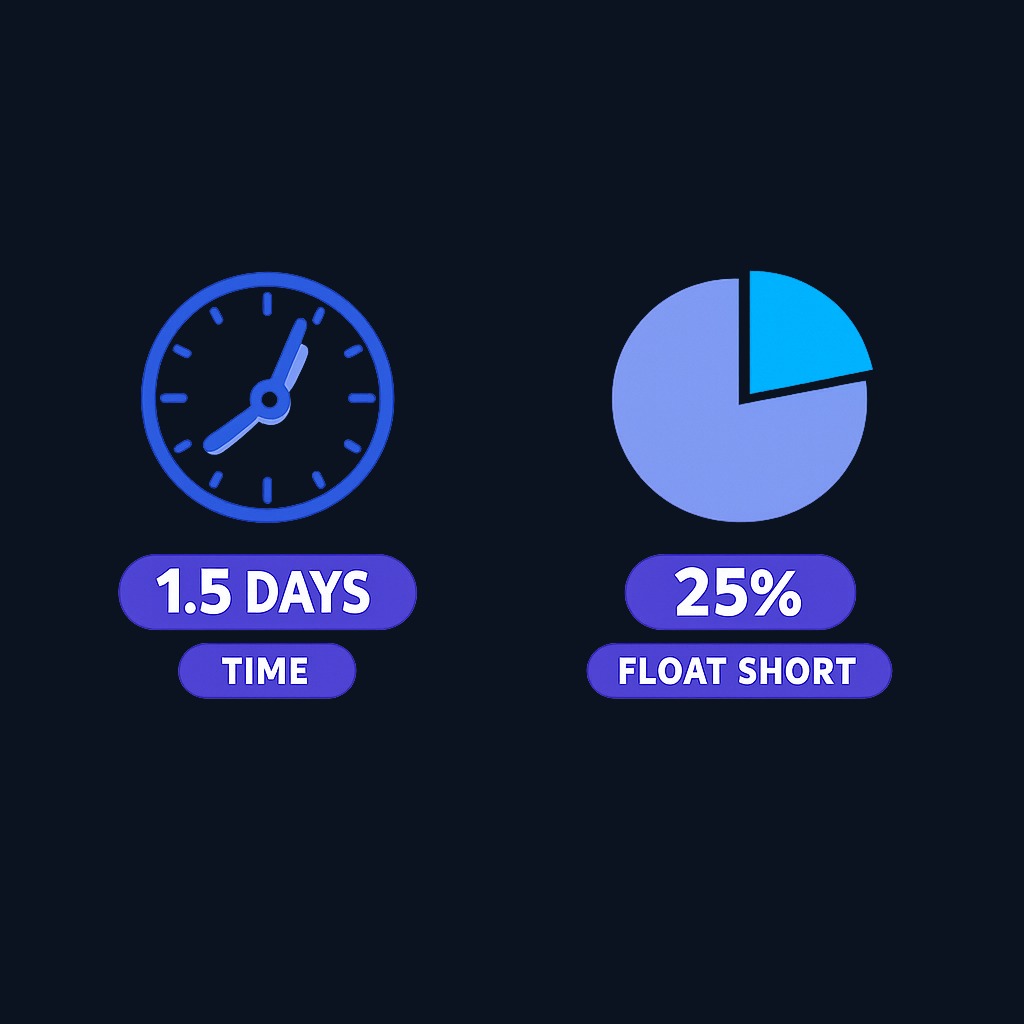
Two related figures often get mixed up. Days to cover measures time; short interest as a percent of float measures how much of the tradable share supply is sold short. A stock can show 25% of float short but only 1.5 days to cover if it trades heavily. Squeeze-watchers track both together, because a high float percentage with thin volume is the more combustible mix.
Why the short interest ratio matters
- Sentiment gauge. A rising ratio shows growing bearish conviction against the company, often tied to stretched valuation, deteriorating fundamentals, or accounting concerns.
- Squeeze mechanics. When a heavily shorted stock rallies, short sellers who buy to cover add fuel to the move. The higher the days-to-cover figure, the longer that forced demand can persist.
- Contrarian signal. Some investors treat extreme pessimism as an opportunity marker: if the bad news is already priced in and positioning is one-sided, positive surprises can move the stock sharply.
- Risk management for shorts. Anyone considering a short position checks the ratio first. Being short a crowded name means competing with every other short for shares when the trade reverses. The SEC's overview of short sale regulations also explains rules, like the locate requirement, that shape how these positions are opened.
How to interpret the numbers
There are no universal 2-, 5-, or 8-day thresholds. Interpret the current ratio against the same security's history and close peers, using the same short-interest date and volume methodology.
Context matters more than the raw cutoff. Compare the ratio against the stock's own history and its sector, and check whether short interest is rising or falling across consecutive reports. A ratio drifting from 9 down to 4 tells a story of shorts quietly exiting; the same 4 reached from 1.5 says pessimism is building.
Practice trading with Finelo
Practice in a simulator, learn with bite-sized lessons, and build confidence before risking real money.
What to know before deciding
The ratio has real limitations:
- Stale data. Short interest is reported on a twice-monthly settlement cycle, so the figure you see can lag the current positioning by up to two weeks. Fast-moving squeezes make the published number obsolete quickly.
- Volume distortions. A news spike that triples volume mechanically crushes days to cover without any change in short positioning.
- No motive attached. Some short positions hedge convertible bonds or merger arbitrage rather than bet on a decline, which inflates the bearish signal.
- Squeezes are rare. Most high-ratio stocks simply drift lower; heavy shorting often reflects genuinely weak businesses. Treating every crowded short as a squeeze candidate is a fast way to collect losses.
- Borrow costs are invisible here. The ratio says nothing about the fee to borrow shares, which is often the sharper real-time gauge of short-side stress.
Decision framework: using the ratio in practice
| Your intent | How to apply the short interest ratio |
|---|---|
| Screening for squeeze setups | Require high days to cover AND high percent of float AND a concrete upcoming catalyst |
| Considering a short position | Evaluate borrow availability and cost, liquidity, catalyst risk, and the ratio relative to its own history |
| Holding a stock that gets heavily shorted | Re-examine the bear case; rising short interest sometimes flags real problems early |
| Trading earnings events | Note elevated ratios as amplifiers of post-report moves in both directions |
FAQ
What is a good short interest ratio?
There is no universally good or high level. Compare the ratio with the same security's history and close peers, and verify that each observation uses the same volume window and reporting date.
How often is short interest data updated?
U.S. short interest is compiled on a twice-monthly settlement schedule and published a few days after each settlement date, so expect the number to lag real-time positioning.
Does a high short interest ratio mean a squeeze is coming?
No. A squeeze needs a trigger - strong earnings, a buyout rumor, unexpected good news - plus constrained share supply. Without a catalyst, heavily shorted stocks frequently keep falling, which is exactly what the shorts expect.
Where can I find a stock's short interest?
FINRA and exchanges publish short-interest data, and many brokers redistribute it. EDGAR filings may help with shares outstanding, but they are not the source of current short-interest positions and accounting float is not always identical to a vendor's tradable-float estimate.
Conclusion and next steps
The short interest ratio combines a dated short-position snapshot with an average-volume measure. It is a theoretical liquidity indicator, not a countdown. Read it alongside the exact volume window, percent of float, borrow conditions, and reporting lag, and never treat it as a squeeze forecast.
TradingMarketsBeginner
Practice trading with Finelo
Practice in a simulator, learn with bite-sized lessons, and build confidence before risking real money.
About the author
Finelo Team
The Finelo Team creates practical investing and trading education designed to help beginners learn faster with structured challenges, simulator practice, and bite-sized lessons.
Keep reading — Related articles

Trading
Understanding Walk Forward Analysis in Trading
Brief educational note: this article is educational — not investment advice — and trading involves the risk of loss.
Finelo Team

Trading
VWAP vs Moving Average: Formulas, Uses, and Limits
VWAP weights price by recorded volume over a defined period, while a moving average summarizes a sequence of prices over a rolling lookback.
Finelo Team

Trading
Volume Profile vs Market Profile: What Each Chart Measures
Volume Profile groups traded volume by price level.
Finelo Team


