Data note: A put/call ratio must identify the product universe (equity, index, ETF, or total), venue coverage, and whether it uses volume or open interest. Puts and calls can be directional trades, hedges, spreads, rolls, or closing transactions, so the ratio is not a clean fear-versus-greed vote. Cboe publishes separate series in its daily market statistics; compare each series only with its own history. A 0.7 “neutral” level is not universal.
Put Call Ratio: What It Is and How Traders Read It
A put/call ratio divides put contracts by call contracts for a defined product universe, venue set, and measure such as volume or open interest. Above 1.0 only means the counted puts exceeded calls; it does not identify…
6 min read
Practice trading with Finelo
Practice in a simulator, learn with bite-sized lessons, and build confidence before risking real money.
Want to learn more?
Practice in a simulator, learn with bite-sized lessons, and build confidence before risking real money.
Explore FineloExplore Finelo's 28-day challenges
Turn learning into a daily habit with guided challenge paths.
A put/call ratio divides put contracts by call contracts for a defined product universe, venue set, and measure such as volume or open interest. Above 1.0 only means the counted puts exceeded calls; it does not identify direction, motive, or whether positions opened or closed. Treat sentiment and contrarian interpretations as hypotheses that require trade-level context and testing.
What the put call ratio measures
Listed options are calls or puts, but either can appear in bullish, bearish, neutral, volatility, income, hedge, spread, roll, exercise, or closing activity. Aggregate contract counts therefore describe activity, not “what the crowd is doing.” Single-stock, index, ETF, and total-market ratios answer different questions and must not be mixed.
How the put call ratio is calculated
Put call ratio = Put volume ÷ Call volume
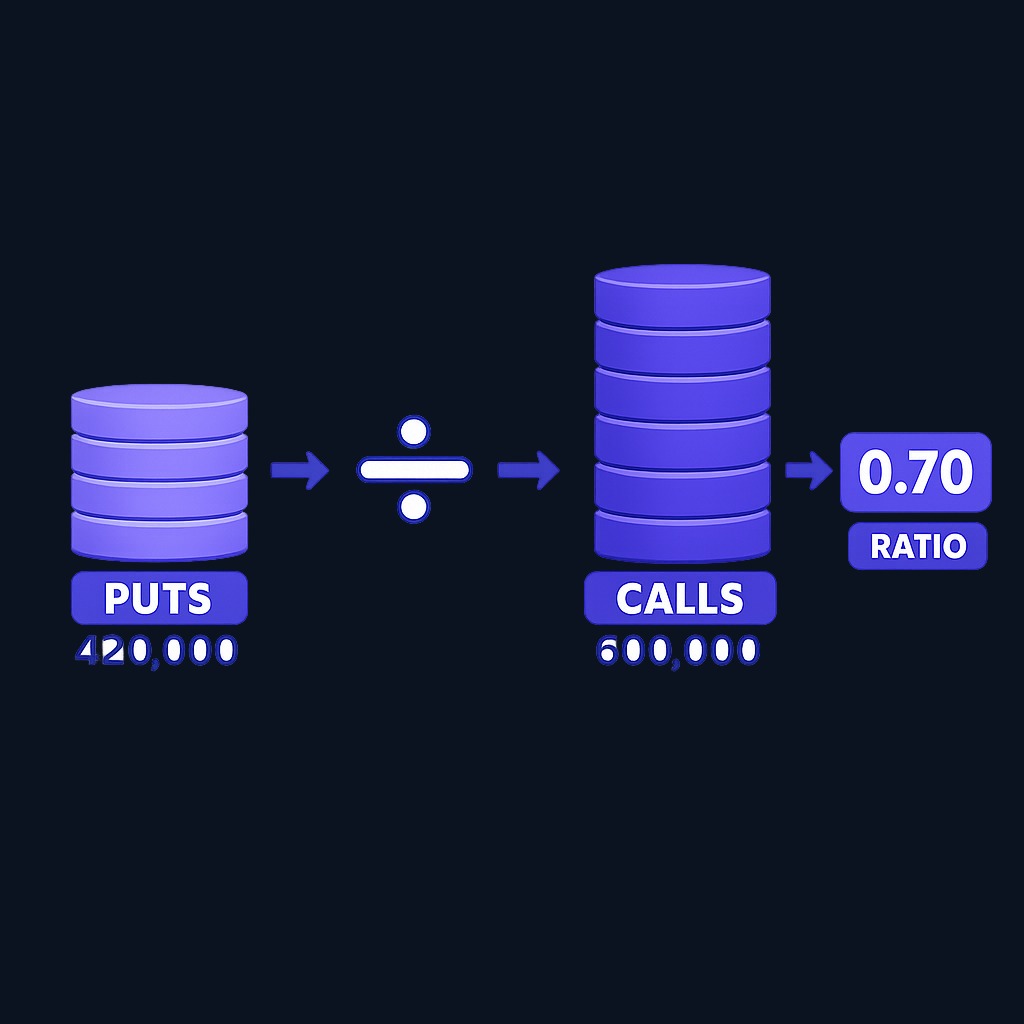
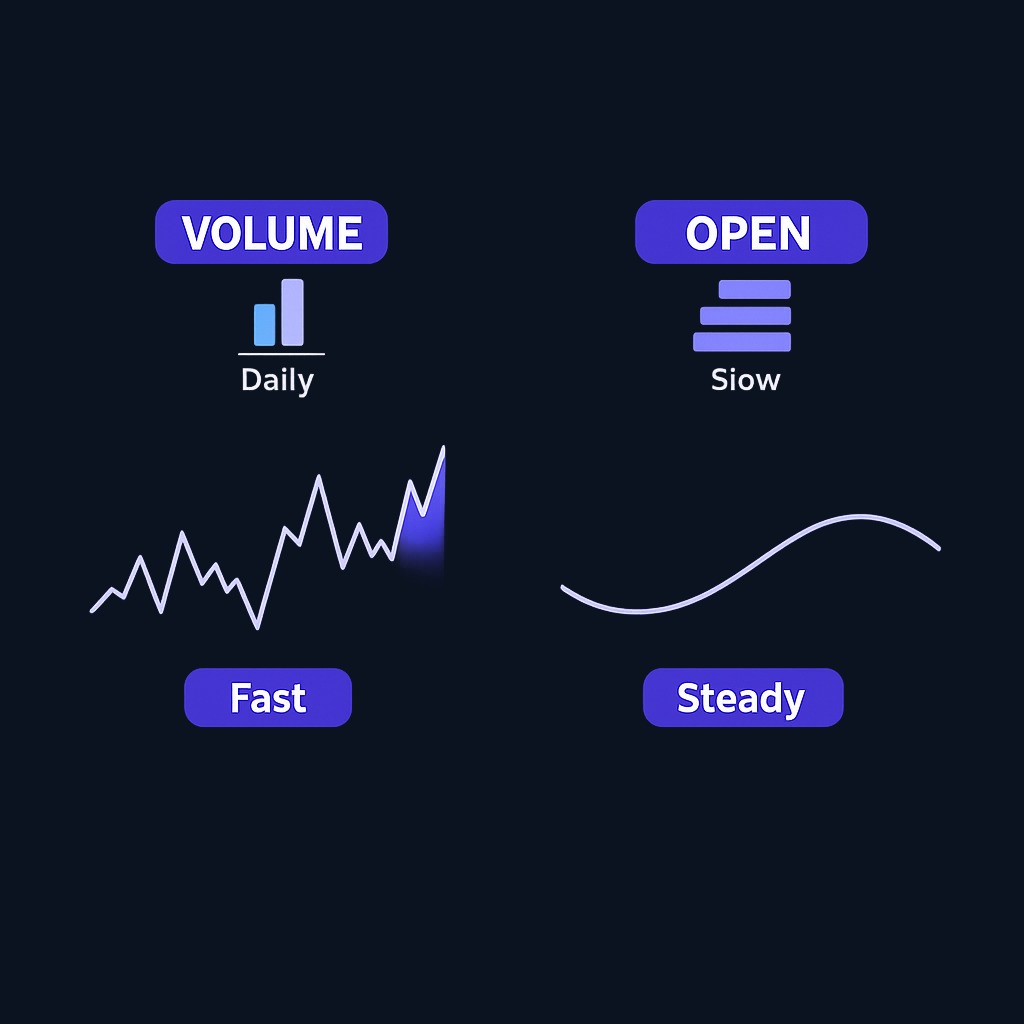
If 420,000 puts and 600,000 calls trade on an index in a session, the ratio is 0.70. There are two common variants. The volume-based ratio uses contracts traded that day and reacts quickly to news. The open-interest ratio divides outstanding put contracts by outstanding call contracts, moving more slowly and describing accumulated positioning rather than today's flow. Equity-only ratios, which exclude index products, are often preferred for reading retail sentiment, because index puts are heavily used by institutions for routine portfolio hedging, a practice that structurally inflates put counts regardless of anyone's market opinion.
Interpreting the put call ratio
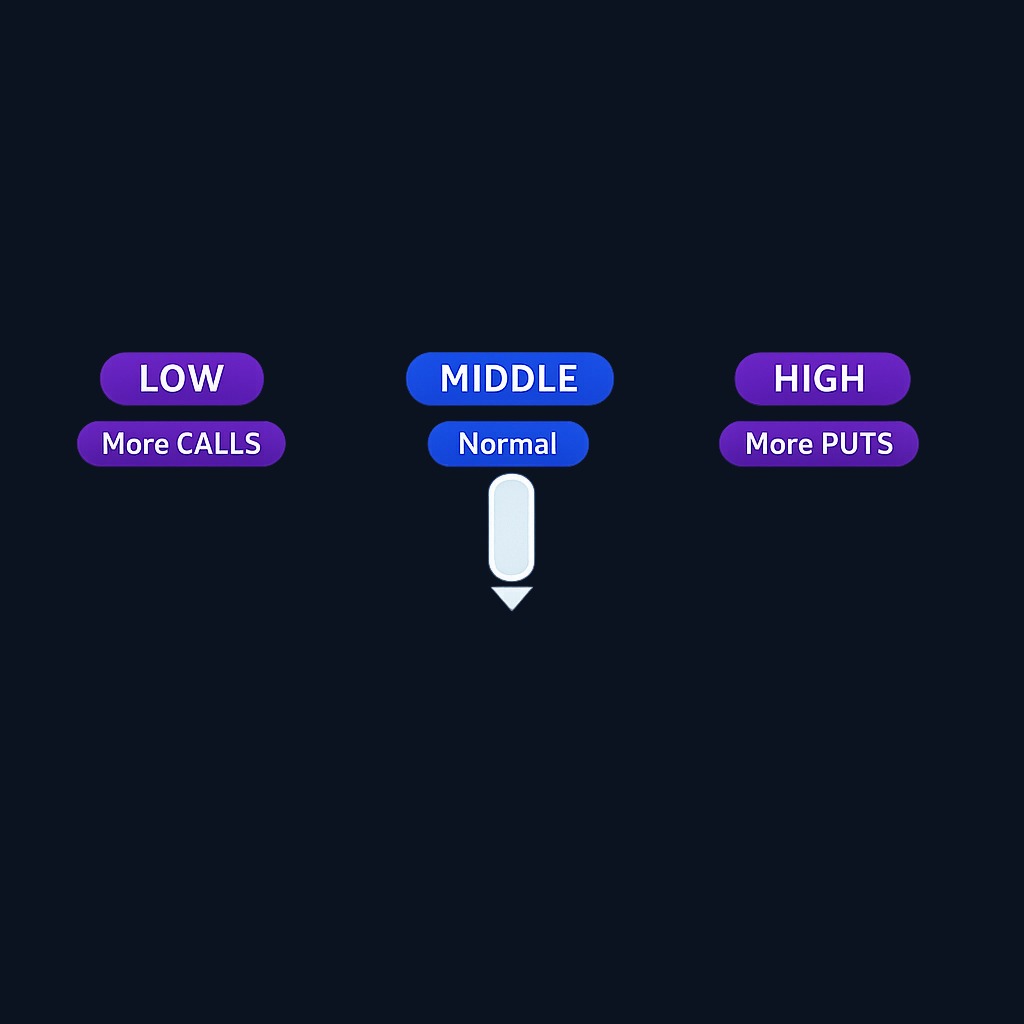
There is no universal neutral value. Read a precisely defined series against its own documented history, and investigate large prints, exercise activity, spreads, and product mix before assigning sentiment:
- Low relative reading. More calls than puts traded in the defined series; motive and opening/closing status remain unknown.
- Middle of the historical range. A common observation, not proof that there is “no signal.”
- High relative reading. More puts traded relative to calls; hedging, exercise, rolls, spreads, and product mix can dominate.
Contrarian interpretation is a hypothesis, not a consequence of the ratio. Test percentile rules on the exact series and include transaction costs, overlapping signals, and large trade-level distortions.
Worked example: reading one week of numbers
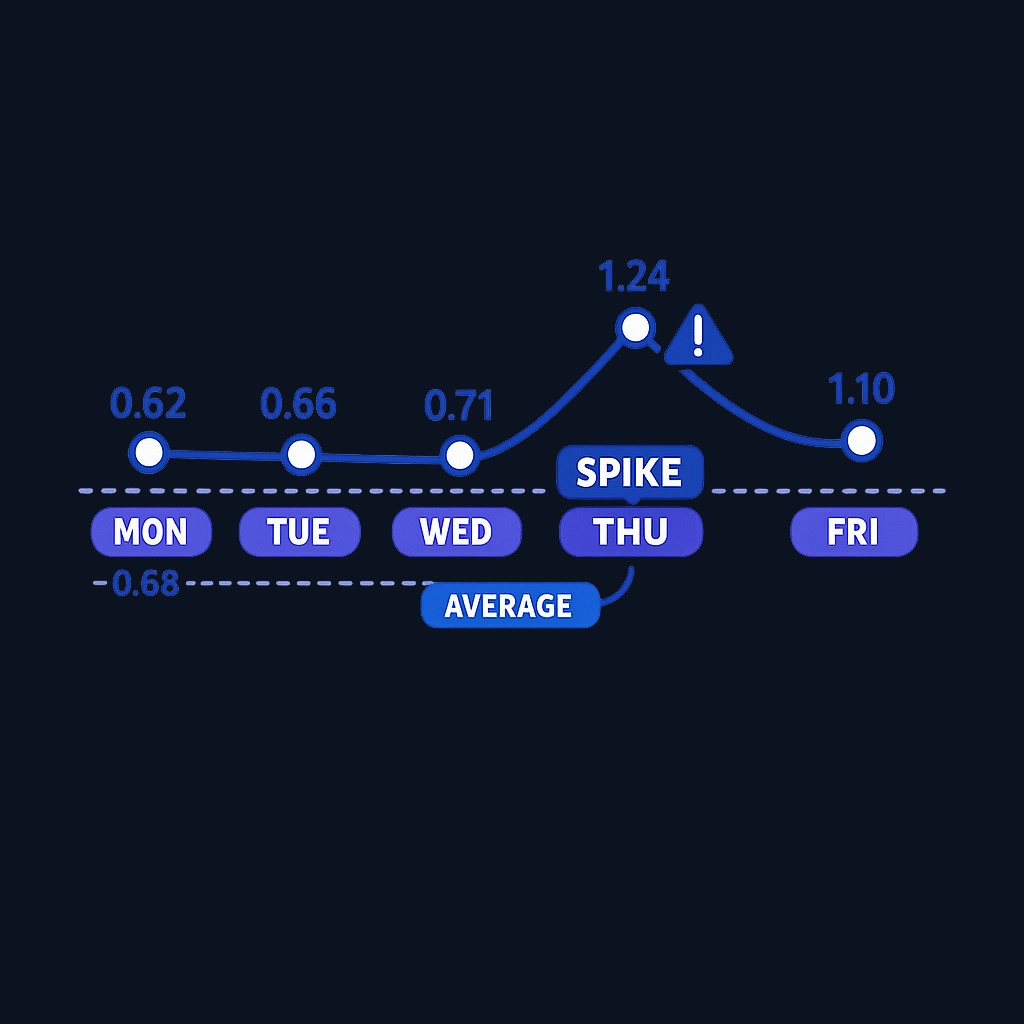
Suppose an equity put call ratio has averaged 0.68 over the past year, mostly ranging between 0.55 and 0.85. Monday prints 0.62, Tuesday 0.66, Wednesday 0.71: routine noise, no action. Thursday the market drops 3% on inflation news and the ratio spikes to 1.24, its highest reading in months. Friday it stays elevated at 1.10 while prices stabilize.
A contrarian reads Thursday's 1.24 as panic hedging: put volume at double its normal share of activity means fear is being paid for at scale. That is not an automatic buy signal; it is a flag to start watching for stabilization, positive divergences, or a reversal pattern before acting. If the following week the ratio drifts back toward 0.70 while prices recover, the fear spike marked the low. If the ratio stays pinned above 1.0 while prices keep sliding, the crowd's fear was justified. The ratio starts the investigation; price action finishes it.
Practice trading with Finelo
Practice in a simulator, learn with bite-sized lessons, and build confidence before risking real money.
What to know before deciding
The put call ratio is context, never a standalone trigger. Its main limitations are worth internalizing.
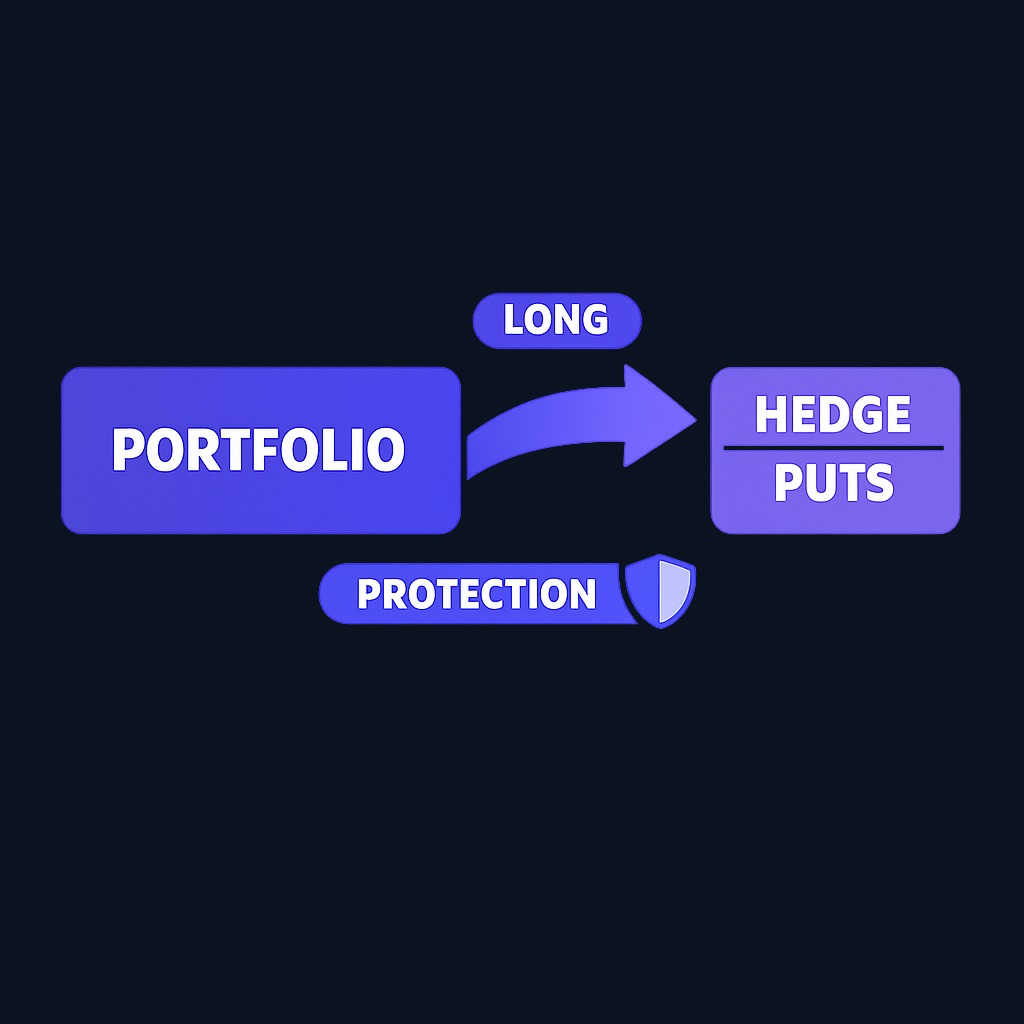
Hedging distorts the signal
A pension fund buying index puts to insure a portfolio is not bearish; it is prudent. Institutional hedging inflates put volume mechanically, which is why equity-only versions and comparisons against an instrument's own history beat fixed thresholds.
No universal levels
A 1.0 reading is dramatic for one index and unremarkable for another. Always benchmark against that instrument's own trailing range, and smooth daily noise with a moving average of the ratio before drawing conclusions.
Extremes can stay extreme
Fear can persist for weeks in real downtrends. Acting on the first spike, without confirmation from price, support and resistance, or breadth, is how contrarian trades become falling-knife catches. Options trading itself carries substantial risk of rapid loss, a point regulators stress in the SEC's day trading guidance, so position sizing matters more than any single indicator.
Decision framework: using the ratio in practice
- Pick your version. Equity-only volume ratio for retail sentiment; open-interest ratio for slower positioning reads.
- Establish the baseline. Chart at least six months of the ratio and mark its typical range and past extremes.
- Wait for a genuine extreme. Only readings near the edges of the historical range carry information.
- Demand confirmation. Pair the extreme with price action, volume, or a reversal signal before trading against the crowd.
- Size small and define exits. Sentiment tools improve odds at the margin; they do not create certainty.
FAQ
What is a good put call ratio?
There is no universally good or neutral number. Identify the exact Cboe or vendor series and judge it against its own history, while remembering that contract counts do not reveal trade motive.
Is a high put call ratio bullish or bearish?
Literally, it shows bearish positioning: more puts than calls traded. Contrarians, however, treat unusually high readings as potentially bullish, reasoning that peak fear often appears near market bottoms. The two readings are reconciled by confirmation from price action.
What is the difference between volume and open interest versions?
The volume ratio uses contracts traded in one session and reacts to daily news. The open-interest ratio uses all outstanding contracts, so it evolves slowly and reflects accumulated positioning rather than the day's flow.
Can I use the put call ratio for individual stocks?
Yes, but single-stock option volume can be thin and dominated by a few large trades, making the ratio noisy. It works best on heavily traded names and is most reliable at the index or market-wide level.
Conclusion and next steps
The put call ratio turns the day's options flow into a one-line sentiment gauge: puts over calls, fear over greed. Read it against its own history, respect the distortion from institutional hedging, and act only on extremes that price action confirms. Used that way, it is a solid early-warning system rather than a trading trigger. Build the habit safely first: track the ratio alongside your watchlist for a month, log your reads, and review which extremes actually marked turns.
TradingMarketsOptionsBeginner
Practice trading with Finelo
Practice in a simulator, learn with bite-sized lessons, and build confidence before risking real money.
About the author
Finelo Team
The Finelo Team creates practical investing and trading education designed to help beginners learn faster with structured challenges, simulator practice, and bite-sized lessons.
Keep reading — Related articles
Trading
Understanding Walk Forward Analysis in Trading
Brief educational note: this article is educational — not investment advice — and trading involves the risk of loss.
Finelo Team
Trading
VWAP vs Moving Average: Formulas, Uses, and Limits
VWAP weights price by recorded volume over a defined period, while a moving average summarizes a sequence of prices over a rolling lookback.
Finelo Team
Trading
Volume Profile vs Market Profile: What Each Chart Measures
Volume Profile groups traded volume by price level.
Finelo Team


