The PEG ratio, short for price/earnings-to-growth ratio, tells you whether a stock's price looks reasonable once you account for how fast the company's earnings are expected to grow. To get it, take the P/E and divide it by the pace at which earnings are expected to expand, expressed as a whole number. A result near 1 suggests price and growth are roughly balanced, while lower readings hint at a potential bargain.
The PEG Ratio: What It Is and How to Use It in Investing
The PEG ratio, short for price/earnings-to-growth ratio, tells you whether a stock's price looks reasonable once you account for how fast the company's earnings are expected to grow. To get it, take the P/E and divide…
8 min read
Practice trading with Finelo
Practice in a simulator, learn with bite-sized lessons, and build confidence before risking real money.
Want to learn more?
Practice in a simulator, learn with bite-sized lessons, and build confidence before risking real money.
Explore FineloExplore Finelo's 28-day challenges
Turn learning into a daily habit with guided challenge paths.
This page is for beginner and intermediate investors who already know what a P/E ratio is and want a sharper valuation tool. Read the calculation steps, the interpretation guide, and the decision framework below, then practice on two or three stocks you already follow. Everything here is educational, not personalized investment advice.
What the PEG ratio measures
The P/E ratio compares a company's stock price to its earnings per share. The problem is that a fast-growing company almost always looks expensive on P/E alone. The PEG ratio fixes part of that blind spot. It asks a better question: how much are you paying for each unit of expected growth?
Because it folds the growth rate into the math, the PEG ratio lets you compare a slow, steady business against a fast-growing one on more even terms. A high P/E stock can still show an attractive PEG if analysts expect earnings to expand quickly. A cheap-looking stock can show an ugly PEG if its earnings are flat. That is why many investors treat the PEG ratio as a first filter when they screen growth stocks.
How to calculate the PEG ratio
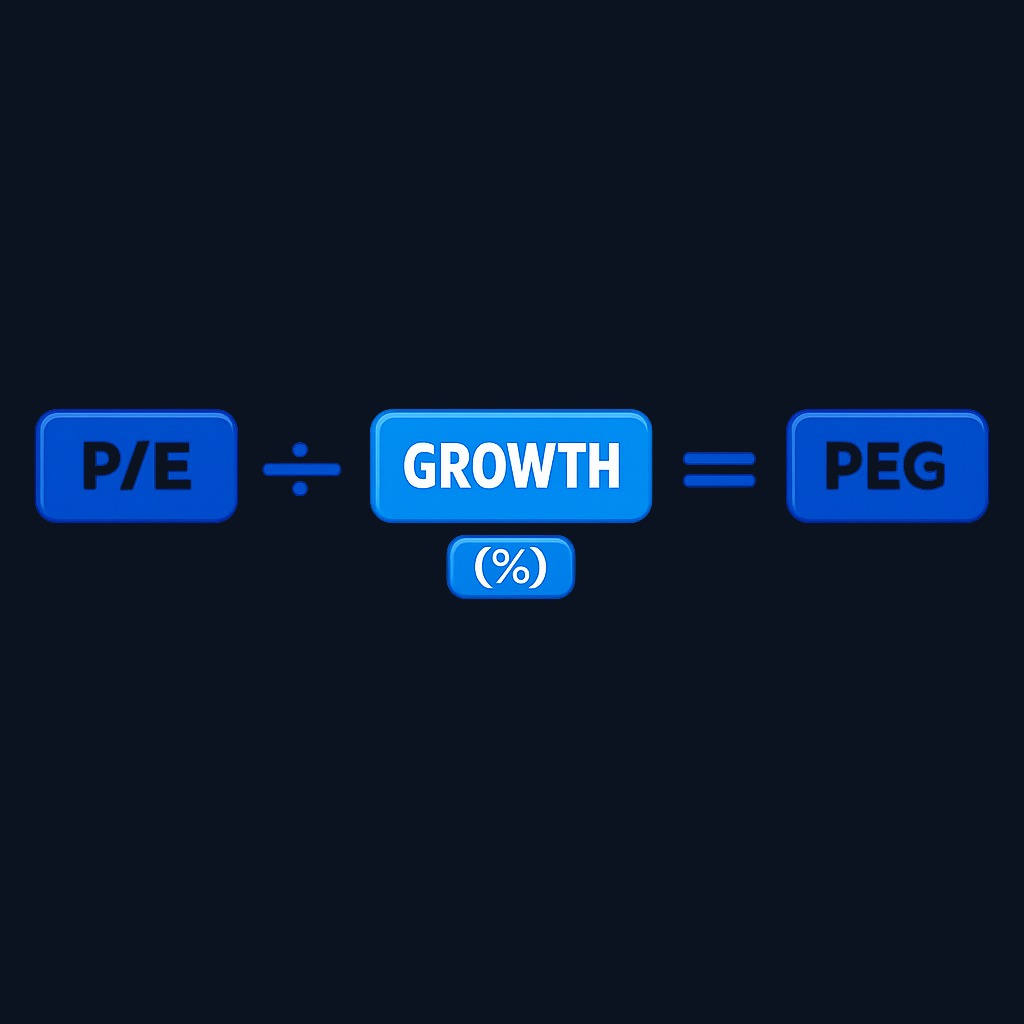
The formula is simple:
PEG ratio = P/E ratio ÷ annual earnings growth rate (as a whole number)
There are two common versions, and they can give different answers for the same company:
- Forward PEG uses a forward P/E and the growth rate analysts expect for future earnings.
- Trailing PEG uses a trailing P/E and the growth rate the company actually delivered over the past 12 months.
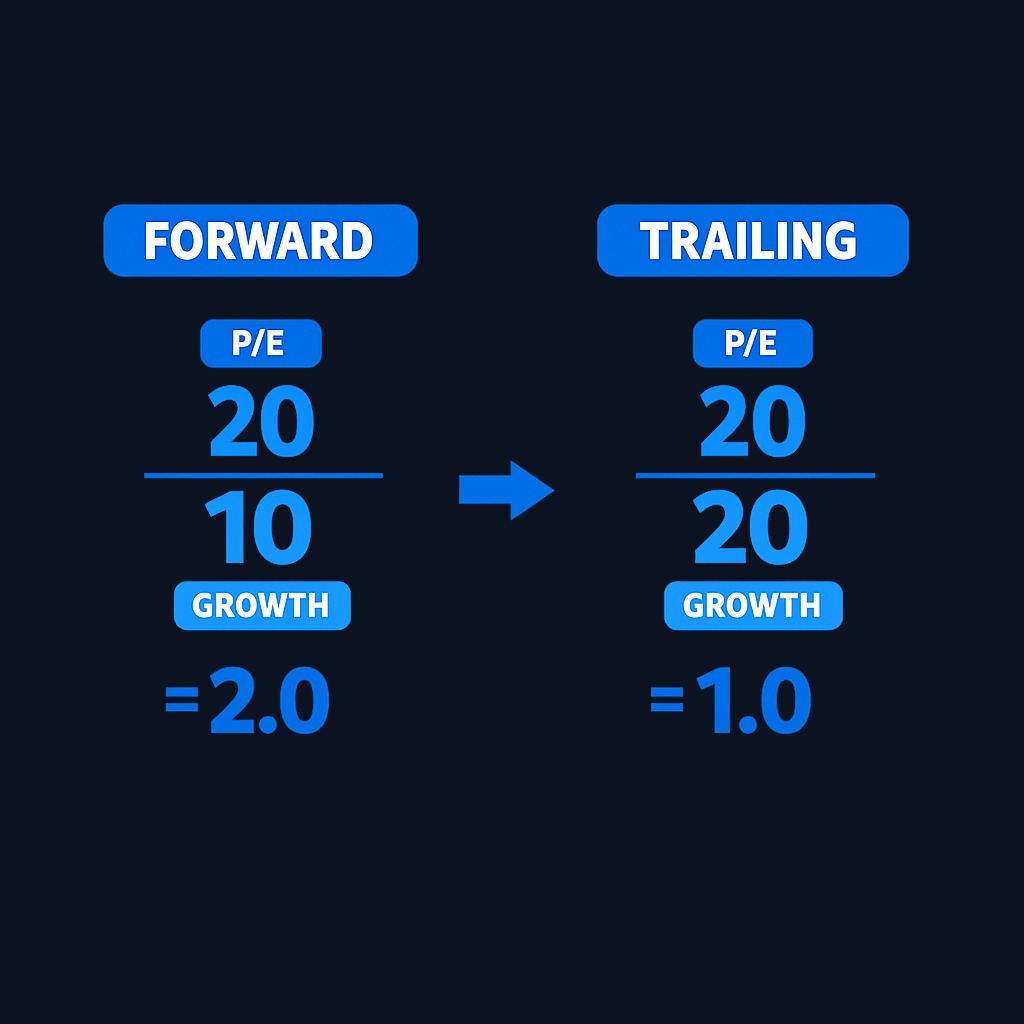
Schwab's guide to the PEG ratio illustrates both: a stock with a forward P/E of 20 and expected earnings growth of 10% has a forward PEG of 2, while a stock with a trailing P/E of 20 and 20% earnings growth over the past year has a trailing PEG of 1.
A worked example
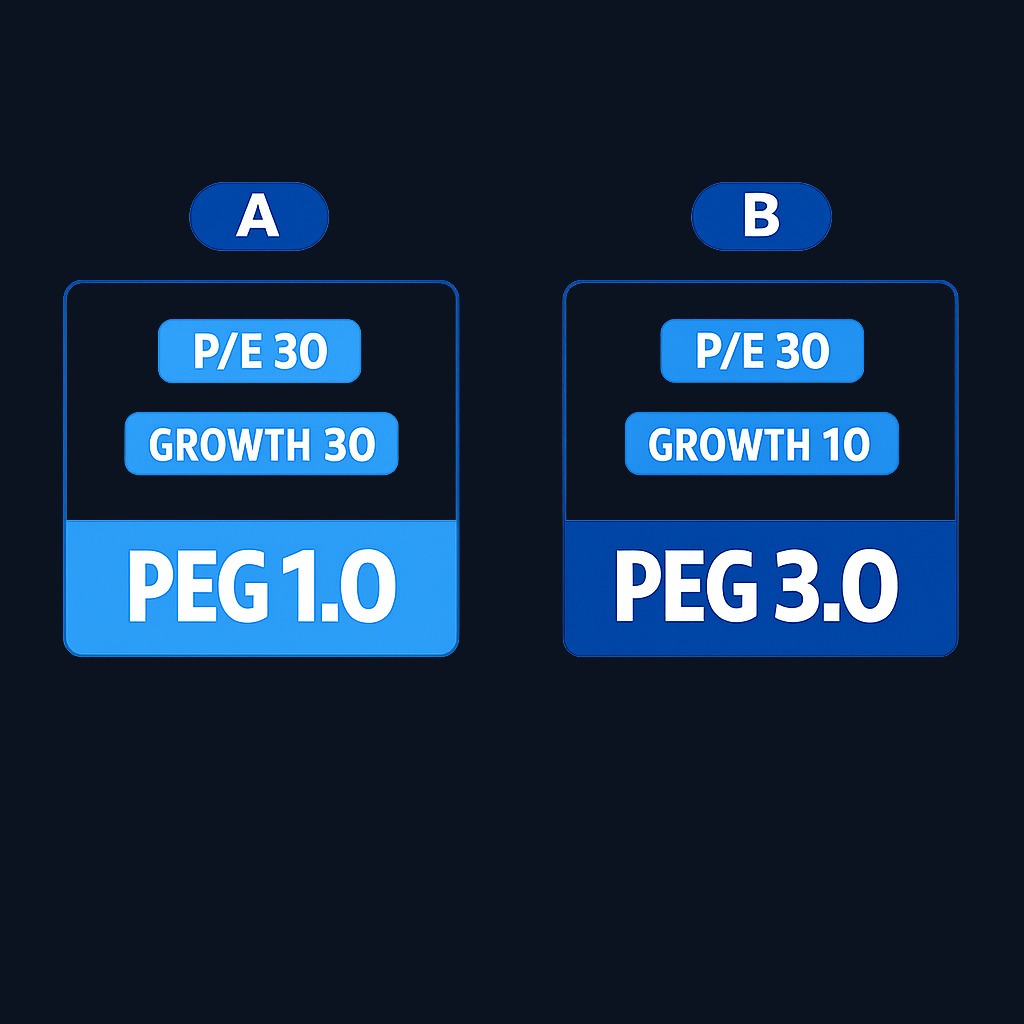
Imagine two companies, each trading at a P/E of 30:
- Company A is expected to grow earnings 30% per year. PEG = 30 ÷ 30 = 1.0.
- Company B is expected to grow earnings 10% per year. PEG = 30 ÷ 10 = 3.0.
On P/E alone, the two look identical. The PEG ratio shows that Company A's price is backed by growth expectations, while Company B's investors are paying three times as much for each point of expected growth. Always note which growth estimate you use and where it came from, since the estimate drives the whole result.
Interpreting the PEG ratio
There is no magic threshold, but a common reading looks like this:
| PEG value | Common interpretation |
|---|---|
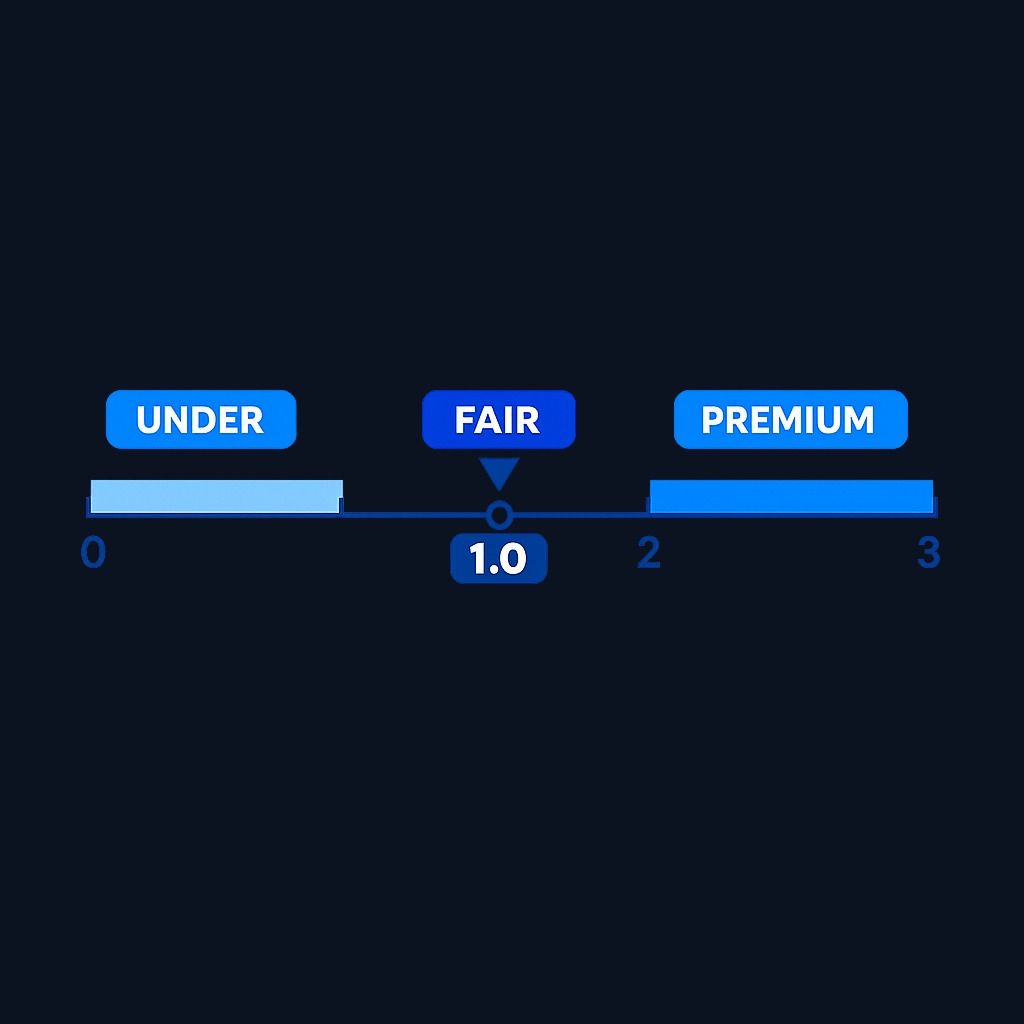
| Below 1 | Price may be low relative to expected growth |
| Around 1 | Price and expected growth roughly balanced |
| Above 1 | Investors are paying a premium for growth |
| Negative | Earnings or growth are negative; the ratio is not meaningful |
Lower PEG ratios are generally considered better, and a high PEG can signal that investors are paying a premium price for growth, a point Schwab's PEG FAQ makes as well. Treat these bands as a starting point rather than a verdict. A PEG of 1.5 for a company with durable, predictable earnings might be a fair price. The same 1.5 for a cyclical business at the top of its cycle could be expensive. The number tells you what the market expects; you still have to judge whether the expectation is realistic.
PEG ratio vs P/E ratio
The two metrics answer different questions, and each has moments where it is the better tool.
| Question | Better metric |
|---|---|
| How much am I paying for current earnings? | P/E ratio |
| How much am I paying for expected growth? | PEG ratio |
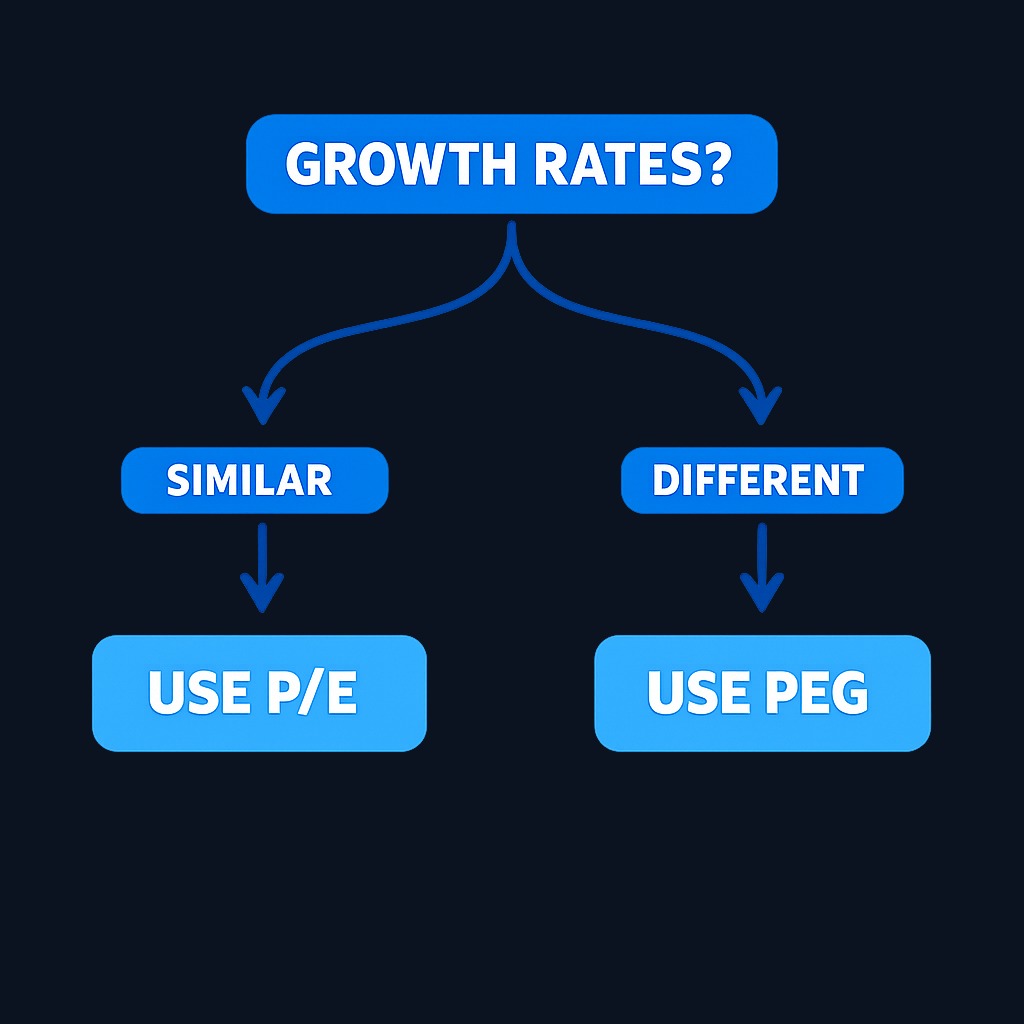
| Comparing mature firms with similar growth | P/E ratio |
| Comparing companies with different growth rates | PEG ratio |
Use the P/E ratio when you compare stable companies in the same industry, where growth rates cluster together. Use the PEG ratio when growth rates differ a lot, such as comparing a young software company to an established industrial firm. In practice, many investors read them together: the P/E shows the raw price tag, and the PEG shows whether growth expectations justify it.
Practice trading with Finelo
Practice in a simulator, learn with bite-sized lessons, and build confidence before risking real money.
Industry variations in PEG ratios
Typical PEG levels differ across sectors. Technology companies often carry higher P/E ratios and higher expected growth, so their PEG values may still land near 1. Utilities and consumer staples grow slowly, so even modest P/E ratios can produce PEG values well above 1. That does not automatically make a utility a bad investment; investors there are usually paying for stability and dividends rather than expansion.
The practical rule: compare PEG ratios within the same industry, not across unrelated ones. A biotech firm and a regional bank face different growth ceilings, accounting habits, and risk profiles. Ranking companies against their direct peers keeps the comparison honest, and pairing the PEG with sector context protects you from false bargains.
Limitations of the PEG ratio
The PEG ratio inherits every weakness of its inputs, so know where it breaks down:
- Growth estimates are guesses. Forward PEG depends on analyst forecasts, and estimates can miss badly. A small change in the assumed growth rate swings the ratio a lot.
- Negative or tiny earnings break the math. Companies with losses, or growth near zero, produce meaningless or distorted PEG values.
- It ignores debt, cash flow, and quality. Two firms with the same PEG can carry very different balance sheets and risks.
- Time horizons vary. One source may use one-year expected growth, another a five-year estimate, so PEG values from different sites are not always comparable.
- Cyclical earnings mislead. At the peak of a cycle, earnings growth looks strong and the PEG looks cheap, right before the cycle turns.
Because of these gaps, treat the PEG ratio as one input in a broader checklist, not a standalone buy signal.
What to know before deciding
Before you act on any PEG reading, check the inputs behind it. Confirm which P/E version the source used, which growth estimate feeds the denominator, and how old the numbers are. Then look at the business itself: revenue trend, debt load, competitive position, and whether the growth story actually makes sense. A stock is never a buy just because a single ratio crossed a threshold, and securities regulators consistently urge investors to research a company well beyond one number before putting money at risk. Make that a habit: read the latest earnings report and check the assumptions behind any forecast you rely on.
Decision framework: when to rely on the PEG ratio
Use this quick framework to decide how much weight the PEG deserves:
- Is the company profitable with positive expected growth? If not, skip the PEG entirely and use revenue-based or asset-based metrics.
- Are growth estimates credible? Check whether the forecast comes from a broad analyst consensus or a single optimistic projection.
- Are you comparing within one industry? If yes, the PEG ranking is meaningful. If not, use it only as loose context.
- Does the PEG agree with other checks? Pair it with the P/E ratio, cash flow, and debt levels. Agreement across metrics builds a case; disagreement means dig deeper.
- Is the market stressed or euphoric? In volatile markets, estimates lag reality, so lean on trailing figures and wider margins of safety.
A common mistake is screening for PEG below 1 and buying everything that qualifies. The screen finds candidates. The research that follows finds investments.
Conclusion and next steps
The PEG ratio turns the familiar P/E into a growth-aware valuation check: divide the P/E by expected earnings growth, anchor around 1, and always question the growth estimate feeding the math. It shines when comparing growth stocks within one industry and misleads when earnings are negative, cyclical, or hyped.
Next steps: pick three companies you follow, compute both trailing and forward PEG for each, and note how the two versions differ. Then compare each figure against direct competitors.
Frequently asked questions
What is a good PEG ratio for growth stocks?
Many investors use 1 as a rough anchor: below 1 may signal an undervalued stock relative to expected growth, above 1 suggests a premium. Context matters, so compare a stock's PEG to its industry peers and its own history rather than a universal cutoff.
How do I calculate the PEG ratio for a specific stock?
Find the stock's P/E ratio, find an earnings growth estimate, and divide the first by the second expressed as a whole number. For example, a P/E of 24 with 12% expected growth gives a PEG of 2. Use the same time basis for both inputs.
What does a PEG ratio of 1.5 mean for my investment?
It means you are paying 1.5 times the stock's expected growth rate for its earnings. That is a premium, though not automatically a bad deal for a high-quality, predictable business. Check what growth assumption produced it and whether peers trade cheaper.
How often should I check the PEG ratio of my investments?
Quarterly is a practical rhythm, since earnings reports and updated forecasts change both inputs. Re-check after big price moves or guidance revisions too. Day-to-day fluctuations rarely change the investment case behind the number.
pegratioinvesting
Practice trading with Finelo
Practice in a simulator, learn with bite-sized lessons, and build confidence before risking real money.
About the author
Finelo Team
The Finelo Team creates practical investing and trading education designed to help beginners learn faster with structured challenges, simulator practice, and bite-sized lessons.
Keep reading — Related articles

Trading
Understanding Walk Forward Analysis in Trading
Brief educational note: this article is educational — not investment advice — and trading involves the risk of loss.
Finelo Team
Trading
VWAP vs Moving Average: Formulas, Uses, and Limits
VWAP weights price by recorded volume over a defined period, while a moving average summarizes a sequence of prices over a rolling lookback.
Finelo Team

Trading
Volume Profile vs Market Profile: What Each Chart Measures
Volume Profile groups traded volume by price level.
Finelo Team


