The quick ratio measures whether a company can pay its short-term bills using only its most liquid assets. You calculate it by adding cash, cash equivalents, marketable securities, and accounts receivable, then dividing by current liabilities. A result of 1 or more means the company could cover every near-term obligation without selling inventory.
The Quick Ratio: A Key Indicator of Financial Health

The quick ratio measures whether a company can pay its short-term bills using only its most liquid assets. You calculate it by adding cash, cash equivalents, marketable securities, and accounts receivable, then…
7 min read
Practice trading with Finelo
Practice in a simulator, learn with bite-sized lessons, and build confidence before risking real money.
Want to learn more?
Practice in a simulator, learn with bite-sized lessons, and build confidence before risking real money.
Explore FineloExplore Finelo's 28-day challenges
Turn learning into a daily habit with guided challenge paths.
This page is for beginners learning to read a balance sheet and judge a company's financial health before investing. You will learn the formula, each component, how the quick ratio differs from the current ratio, what counts as a healthy number by industry, and the traps to avoid. Everything here is educational, not financial advice.
What is the quick ratio?
The quick ratio, also called the acid-test ratio, is a liquidity metric. Liquidity is a company's ability to meet obligations due within the next year without raising new money. The "quick" part refers to quick assets: resources that are cash already or can convert to cash fast, typically within about 90 days, without losing much value.
The formula:
Quick ratio = (cash + cash equivalents + marketable securities + accounts receivable) ÷ current liabilities
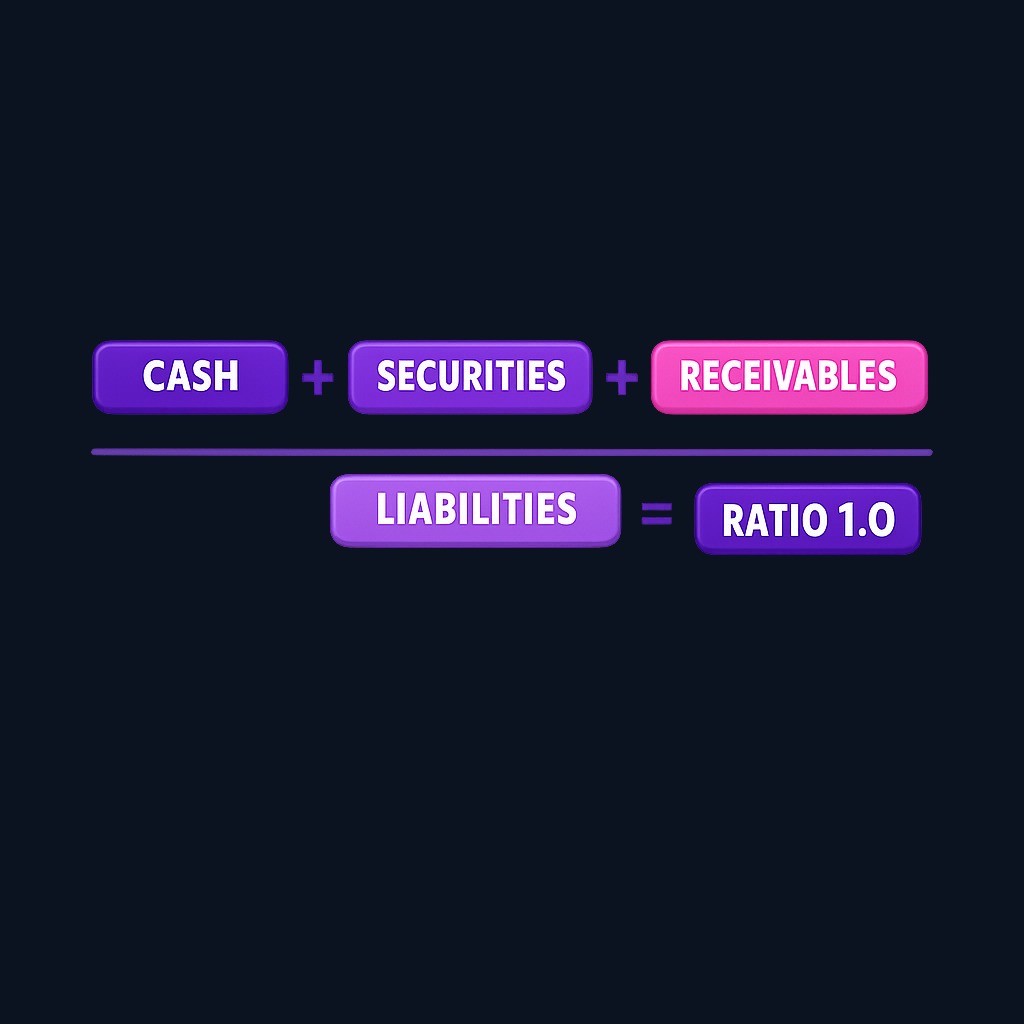
An equivalent shortcut starts from current assets and strips out the slow-moving pieces:
Quick ratio = (current assets − inventory − prepaid expenses) ÷ current liabilities
Both versions answer the same question: if the bills due soon all arrived today, how much of them could the company cover with assets that are effectively cash?
Why the quick ratio matters
Profit and liquidity are different things, and companies rarely fail because of a single bad quarter of earnings. They fail when cash runs out. A business can report strong profits while its cash is trapped in unsold inventory or unpaid invoices, leaving it unable to pay suppliers, payroll, or short-term debt on time.
The quick ratio is a stress test for exactly that situation:
- For investors, it signals whether a company can survive a rough patch without emergency borrowing or dilutive fundraising.
- For lenders and suppliers, it indicates whether new credit is likely to be repaid on schedule.
- For managers, it flags when working capital is drifting toward risk before the problem becomes urgent.
Because it excludes inventory, the quick ratio is deliberately conservative. It assumes the hardest-to-sell current asset contributes nothing, which makes a passing grade more meaningful.
How to calculate the quick ratio
Every input comes from the balance sheet in a company's financial statements. The logic mirrors personal finance: just as regulators encourage households to keep a liquid emergency fund for surprise bills, a company needs quick assets standing ready for obligations that come due soon. Walk through a simple example:
| Balance sheet item | Amount |
|---|---|
| Cash and equivalents | $80,000 |
| Marketable securities | $40,000 |
| Accounts receivable | $120,000 |
| Inventory | $200,000 |
| Current liabilities | $220,000 |
Quick assets = 80,000 + 40,000 + 120,000 = $240,000. Divide by current liabilities of $220,000 and the quick ratio is roughly 1.09. This company could pay all near-term obligations from liquid assets with a small cushion left over, even if the entire inventory pile sold slowly.

Now remove the marketable securities and the numerator falls to $200,000, dropping the ratio to about 0.91. Small balance-sheet shifts move the result, which is why one quarter's number matters less than the trend across several quarters.
Components of the quick ratio
Each piece of the formula behaves differently, and knowing them helps you spot distortions:
- Cash and cash equivalents. The strongest component: bank balances and instruments like treasury bills that are cash within days.
- Marketable securities. Investments that trade on liquid markets and can be sold quickly. Their value can swing with the market.
- Accounts receivable. Money customers owe. It counts as a quick asset, but only if customers actually pay on time; aging or doubtful receivables weaken the ratio's honesty.
- Current liabilities. The denominator: accounts payable, wages, taxes, short-term loans, and the portion of long-term debt due within a year.
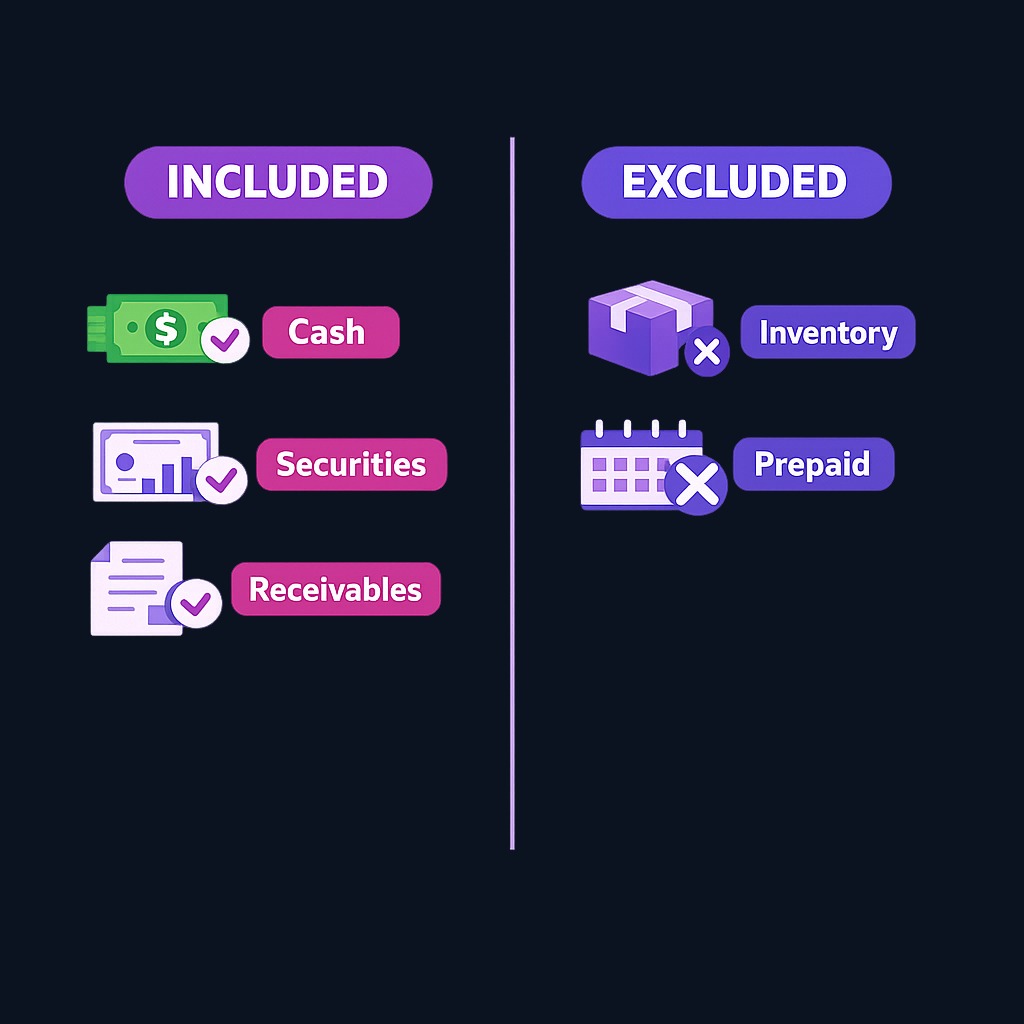
Inventory and prepaid expenses are excluded on purpose. Inventory may take months to sell, and its liquidation value under pressure is uncertain. Prepaid expenses can never turn back into cash at all.
Practice trading with Finelo
Practice in a simulator, learn with bite-sized lessons, and build confidence before risking real money.
Quick ratio vs current ratio
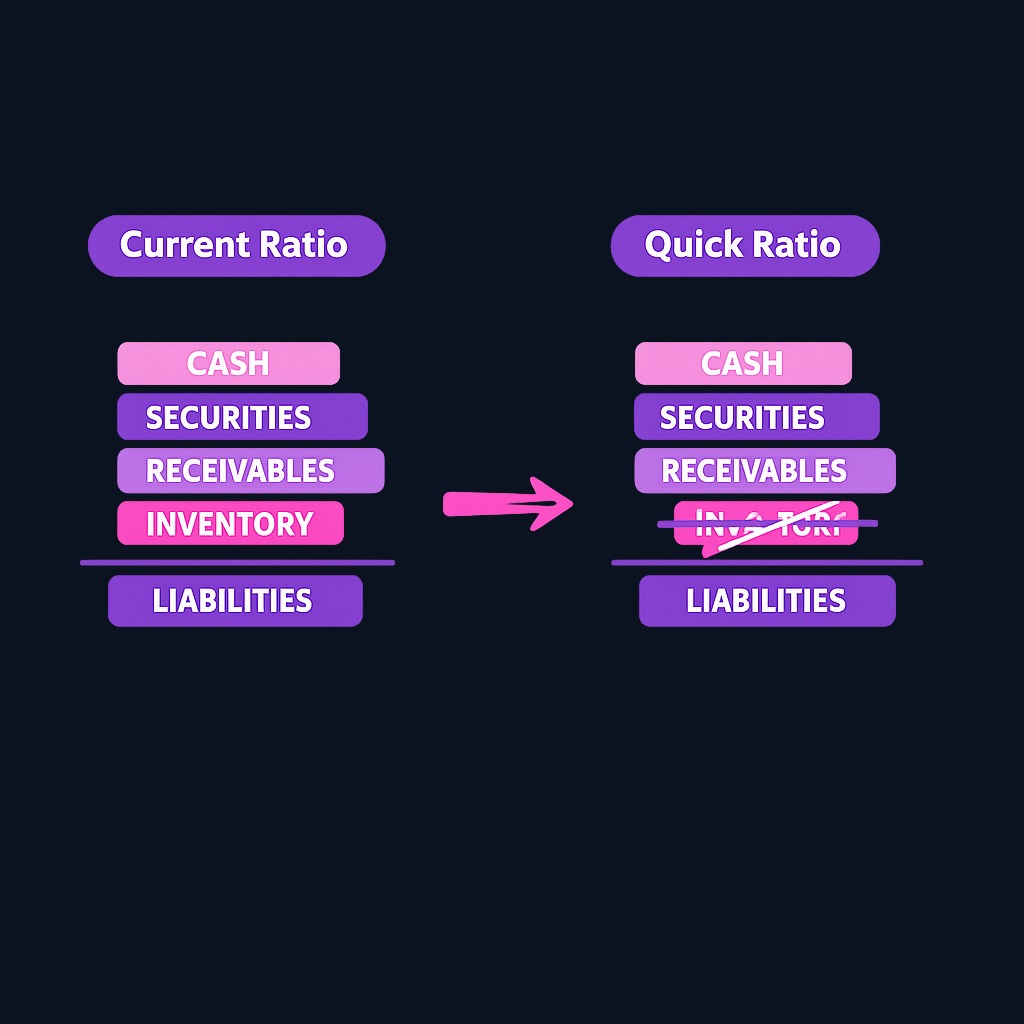
The current ratio is the quick ratio's more lenient sibling: current assets divided by current liabilities, inventory included.
| Feature | Quick ratio | Current ratio |
|---|---|---|
| Includes inventory | No | Yes |
| Includes prepaid expenses | No | Yes |
| Strictness | Conservative | Lenient |
| Best for | Testing immediate liquidity | Broad working-capital view |
Read them together. When the current ratio looks comfortable but the quick ratio sits far below 1, the gap is inventory, and the company's safety depends on selling goods at a healthy pace. When both ratios are close, inventory is small and the liquidity picture is simpler. Analysts often start with the current ratio for context, then use the quick ratio as the tougher test of financial health.
Industry benchmarks for quick ratios
There is no single healthy number, because business models differ:
- Software and services companies often run high quick ratios, since they carry little or no inventory and bill customers directly.
- Retailers and manufacturers naturally run lower quick ratios, because inventory is the core of their business and a large slice of current assets.
- Utilities and subscription businesses can operate safely with modest ratios thanks to predictable, recurring cash inflows.
A rough reading guide: below about 0.5 suggests real short-term risk in most industries, around 1 signals solid coverage, and far above 2 may mean cash is idling instead of funding growth. Compare a company against its own industry peers and its own history, not against an all-market average. A supermarket chain at 0.4 might be routine; a software company at 0.4 deserves questions.
Common misconceptions about the quick ratio
- "Higher is always better." Not necessarily. A very high ratio can mean management is hoarding cash or collecting receivables too aggressively rather than investing in the business.
- "A ratio below 1 means trouble." Sometimes, but businesses with fast, dependable cash inflows routinely operate below 1 without strain.
- "Receivables are as good as cash." Only when customers pay promptly. A company whose receivables are growing older is quietly overstating its liquidity.
- "One number tells the story." The quick ratio is a snapshot at one balance-sheet date. Seasonal businesses can look strong or weak depending on the quarter measured.
- "The same threshold fits every company." Industry structure, payment cycles, and access to credit lines all shift what a safe level looks like.
The fix for every misconception is the same: check the trend, the industry norm, and the quality of each component before judging.
Decision framework: how investors use the quick ratio
A practical workflow looks like this:
- Screen. When comparing companies, flag any with a quick ratio far below industry peers for a closer look.
- Verify the components. Open the balance sheet and check whether receivables are growing faster than sales, which can inflate the ratio while cash collection worsens.
- Track the trend. Pull the ratio for the last several quarters. Gradual decline matters more than any single reading.
- Cross-check. Pair it with the current ratio, operating cash flow, and debt maturities for a fuller liquidity picture.
- Contextualize. Ask whether the company has other liquidity backstops, such as committed credit lines, that the ratio cannot see.
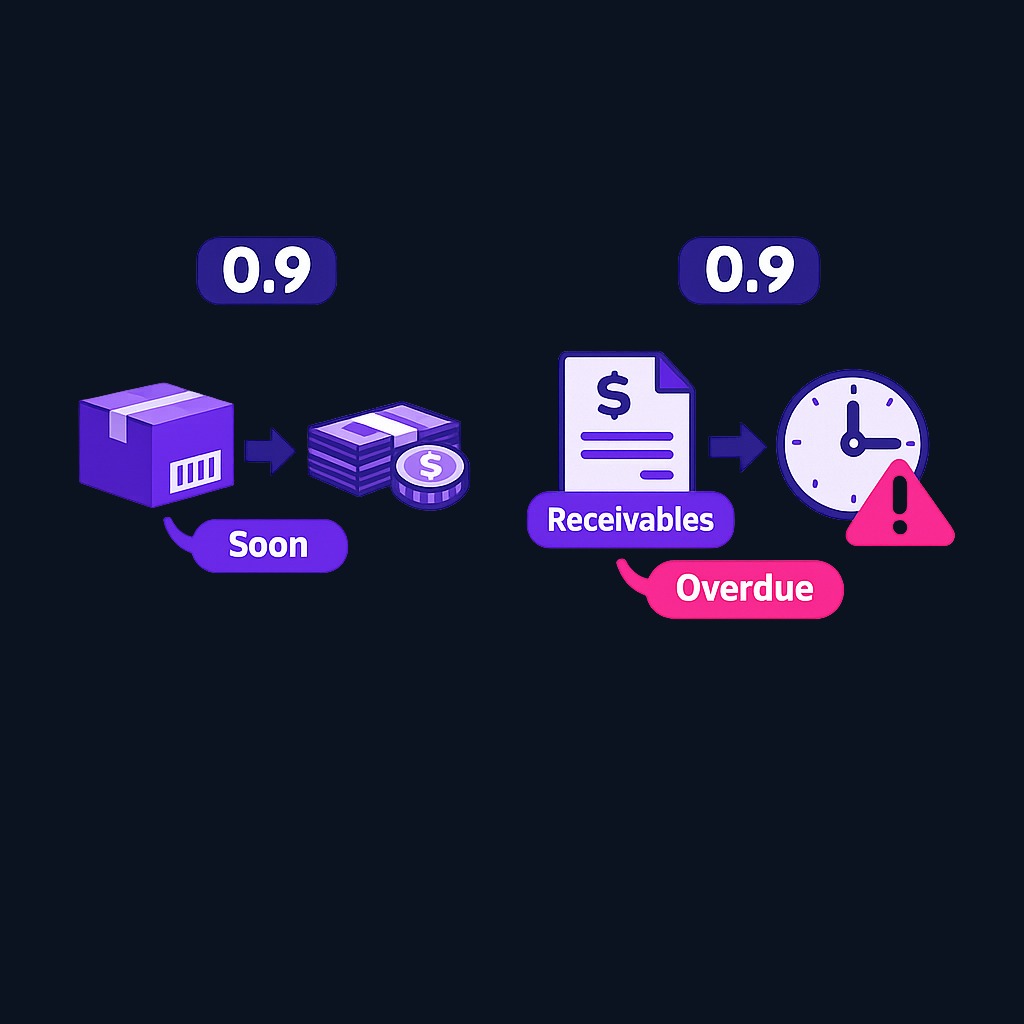
Suppose two companies both show a quick ratio of 0.9. One is a retailer entering the holiday season with inventory about to convert to cash; the other is a consulting firm whose biggest account is 120 days overdue. Same number, very different financial health. The ratio starts the conversation; the accounts behind it finish the conversation.
Conclusion and next steps
The quick ratio distills a balance sheet into one question: can this company pay what it owes soon, using what is liquid now? Calculate it from cash, securities, and receivables against current liabilities, read it beside the current ratio, and judge it against industry norms and the multi-quarter trend rather than a single threshold.
Next steps: pick two companies in the same industry, compute their quick ratios from the latest financial statements, and explain any gap using the components above. If you want guided practice reading balance sheets and liquidity metrics, Finelo offers structured investing education built for beginners.
Frequently asked questions
What is a good quick ratio?
Around 1 or higher is the common rule of thumb, meaning liquid assets fully cover current liabilities. The right level varies by industry: inventory-heavy businesses run lower, service businesses higher. Compare against direct peers and the company's own recent history rather than a universal cutoff.
Why is inventory excluded from the quick ratio?
Because inventory is the slowest current asset to become cash and its value under forced-sale conditions is unpredictable. Excluding it makes the quick ratio a stricter test of whether a company can pay near-term obligations without depending on future sales.
Can the quick ratio be too high?
Yes. A ratio far above peers can signal idle cash earning little return, under-investment in growth, or overly tight credit terms that frustrate customers. Efficient companies keep enough liquidity for safety while putting surplus capital to productive use.
Is the quick ratio the same as the acid-test ratio?
Yes, the two names describe the same calculation: liquid assets divided by current liabilities. "Acid test" comes from the old practice of testing gold with acid, a metaphor for a strict, decisive check of quality.
quickratioindicatorfinancialhealth
Practice trading with Finelo
Practice in a simulator, learn with bite-sized lessons, and build confidence before risking real money.
About the author
Finelo Team
The Finelo Team creates practical investing and trading education designed to help beginners learn faster with structured challenges, simulator practice, and bite-sized lessons.
Keep reading — Related articles

Trading
Understanding Walk Forward Analysis in Trading
Brief educational note: this article is educational — not investment advice — and trading involves the risk of loss.
Finelo Team

Trading
VWAP vs Moving Average: Formulas, Uses, and Limits
VWAP weights price by recorded volume over a defined period, while a moving average summarizes a sequence of prices over a rolling lookback.
Finelo Team

Trading
Volume Profile vs Market Profile: What Each Chart Measures
Volume Profile groups traded volume by price level.
Finelo Team


