A stock screener is a tool that filters thousands of listed companies down to a short list that matches criteria you choose, such as market cap, price, valuation ratios, dividend yield, or sector. Instead of researching the whole market one company at a time, you set the filters and the screener returns every stock that qualifies in seconds.
Understanding Stock Screeners: A Comprehensive Guide
A stock screener is a tool that filters thousands of listed companies down to a short list that matches criteria you choose, such as market cap, price, valuation ratios, dividend yield, or sector. Instead of…
9 min read
Practice trading with Finelo
Practice in a simulator, learn with bite-sized lessons, and build confidence before risking real money.
Want to learn more?
Practice in a simulator, learn with bite-sized lessons, and build confidence before risking real money.
Explore FineloExplore Finelo's 28-day challenges
Turn learning into a daily habit with guided challenge paths.
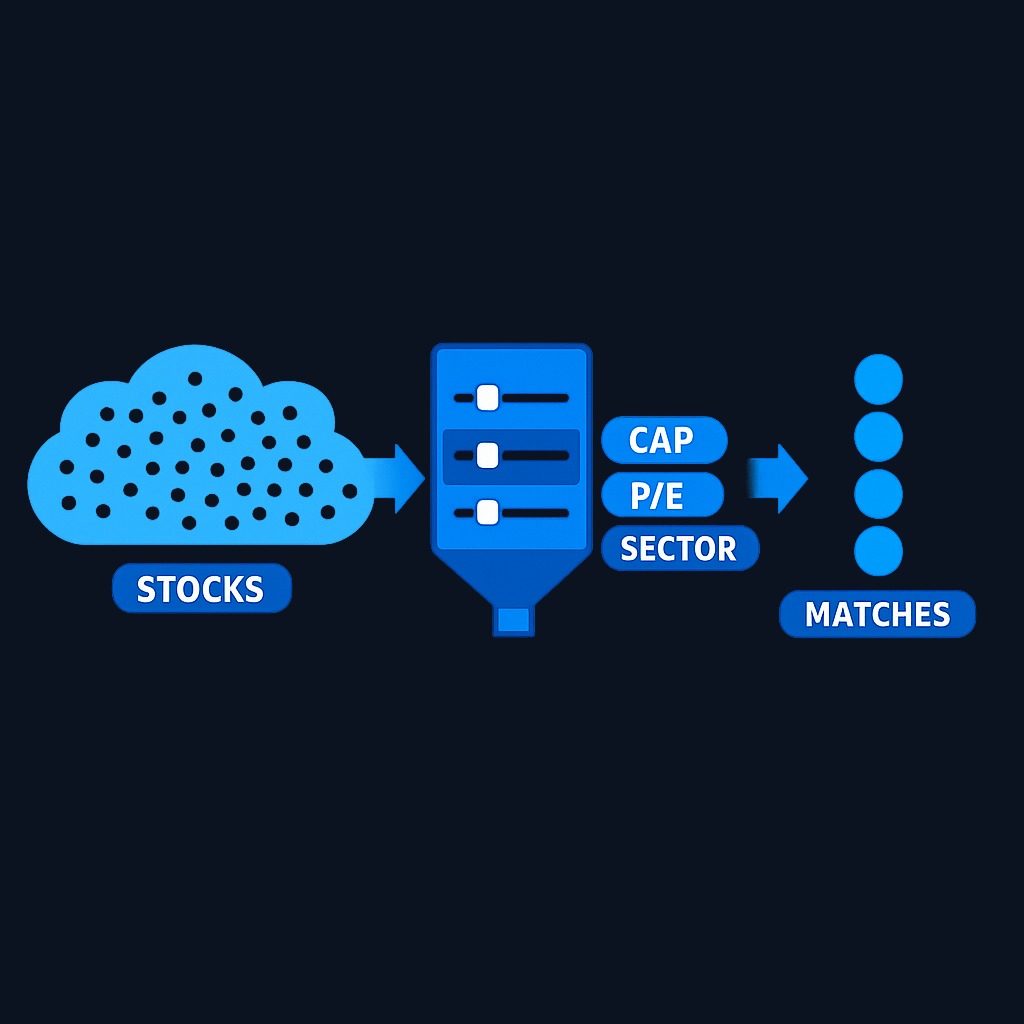
This page is for beginners who want a faster, more systematic way to find investment candidates. Below you will learn how a stock screener works, the main types, which features matter, how to compare popular options, and the mistakes that quietly ruin screens. Everything here is educational, not financial advice.
How stock screeners work
A screener sits on top of a large database of market and financial data. Each company in the database carries hundreds of attributes: share price, market capitalization, industry, price-to-earnings ratio, revenue growth, debt levels, dividend history, trading volume, and more. When you set a filter, the screener simply keeps the companies that pass and hides the rest.
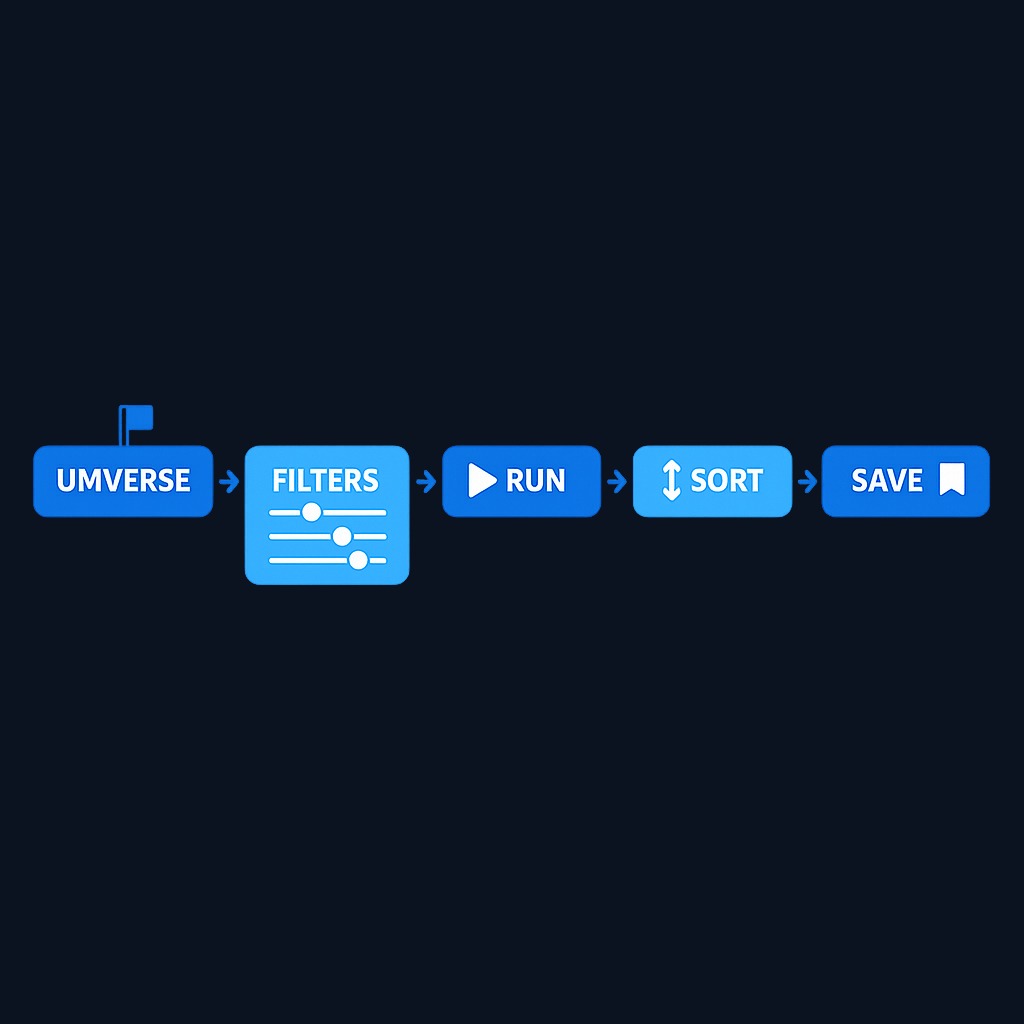
The process usually looks like this:
- Choose a universe. Decide which market you want to screen, such as US-listed stocks, a specific exchange, or a region.
- Set filters. Add conditions one at a time, for example market cap above a threshold, positive earnings, or a dividend yield within a range.
- Run the screen. The tool returns a table of every company that matches all conditions at once.
- Sort and inspect. Rank the results by the metric you care about, then open each company's profile to check the details.
- Save the screen. Most tools let you save filter sets and re-run them as market data updates.
The quality of the output depends entirely on the quality of the inputs. Screeners rely on reported financial data, which updates on different schedules: prices update through the trading day, while fundamentals refresh after each earnings report. A screen is a snapshot, not a verdict.
Benefits of using a stock screener. The most obvious benefit is time. Screening the market by hand is impossible at any serious scale; a screener does the first pass instantly. That speed unlocks several practical advantages:
- Discipline. Filters force you to define what you are actually looking for, such as profitability, growth, or income, before you fall in love with a story.
- Breadth. The screen surfaces companies you would never have found by browsing headlines, including smaller firms outside the news cycle.
- Consistency. A saved screen applies the same standard every time, which makes it easier to compare this month's candidates to last month's.
- Idea generation. Even a rough screen turns a vague goal like "find undervalued dividend payers" into a concrete working list.
A screener does not tell you what to buy or trade. It narrows the field so your deeper research time goes to companies that at least clear your minimum bar. Long-term investors use it to shortlist businesses to buy and hold; active traders use it to find liquid names worth watching today.
Types of stock screeners
Most tools fall into a few broad categories, and many products blend them:
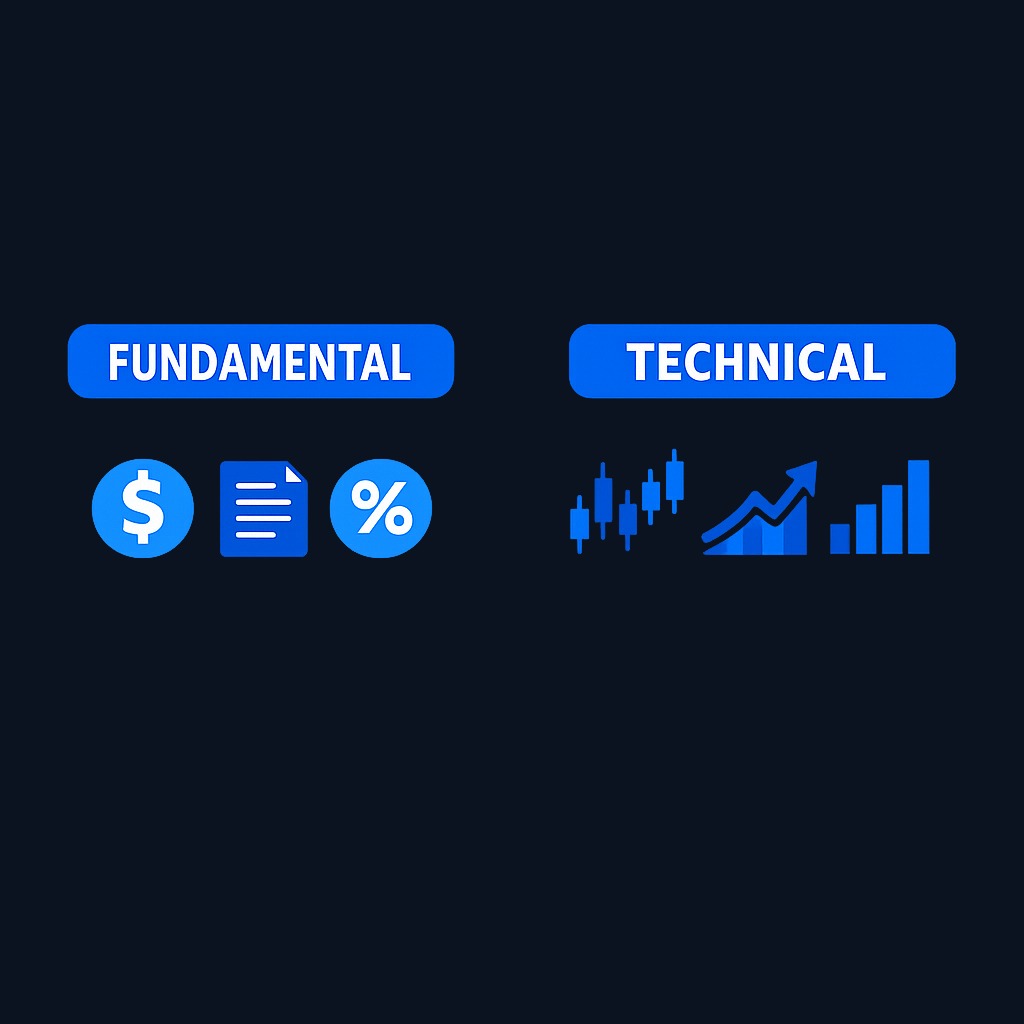
- Fundamental screeners filter on financial-statement data: valuation ratios, margins, debt, growth rates, and dividends. These suit longer-term investors comparing business quality and price.
- Technical screeners filter on price action and indicators: moving averages, relative strength, volume spikes, breakouts, and chart patterns. These suit shorter-term traders looking for setups.
- Broker-integrated screeners come bundled inside a brokerage account and link results directly to trading and watchlist features.
- Standalone web and app screeners run independently of any broker. Free tiers typically cover basic filters, while paid tiers add more metrics, real-time data, backtesting, or export options.
- Specialized screeners focus on one niche, such as ETFs, mutual funds, dividend stocks, or a single industry like technology, energy, or financial services.
Sector and industry filters deserve a special mention. Screening within one industry, for example comparing technology companies only against other technology companies, keeps ratios comparable, since a normal margin for a software service business would look extreme for a retailer. Many investors also run a separate screen for new listings, small cap names, or funds to keep those ideas from getting buried in the main results.
Beginners usually start with a free fundamental screener, then add technical criteria or premium data later if their strategy needs it.
Key features to look for
Not every screener fits every investor. Judge any tool against this checklist:
- Data coverage. Does it include the markets, exchanges, and company sizes you care about, from large cap to small cap?
- Filter depth. Are the metrics you actually use available, and can you combine many conditions in one screen?
- Data freshness. How often do prices and fundamentals update, and is any of it delayed?
- Custom formulas. Advanced tools let you build your own ratios instead of relying on preset fields.
- Saved screens and alerts. Can you save a strategy, re-run it, and get notified when a new company starts passing?
- Usability. A clean results table, clear column definitions, and easy sorting matter more than a long feature list.
- Cost. Compare what the free tier includes against the paid tier, and verify current plan details on the tool's official site before paying, since features and limits change.
If you plan to grow into a strategy, weigh the upgrade path too. Moving your saved screens between services later is rarely convenient.
Also look at the surrounding workflow. Many platforms pair the screener with portfolio tracking, market news, charting, and alerts in one app, on both desktop and mobile. Active traders may want real-time quotes, options data, backtesting, or paper trading to test ideas without risk. Global investors should check for international stocks, since many free tools cover only US markets. None of these extras matter if the core data is weak, but they decide how smoothly the tool fits your routine.
Practice trading with Finelo
Practice in a simulator, learn with bite-sized lessons, and build confidence before risking real money.
Comparing popular stock screeners
Well-known services in this space include Finviz, TradingView, Zacks, Morningstar, Stock Rover, and the built-in screeners at major brokerages like Fidelity and Schwab. Feature sets and plans change often, so verify details on each official site. Rather than picking by brand name alone, compare candidates across the dimensions that change your results. The table below shows a practical way to structure the comparison for any three tools you shortlist:
| Criterion | What to check | Why it matters |
|---|---|---|
| Universe | Markets and exchanges covered | A missing market silently excludes candidates |
| Metrics | Fundamental and technical fields offered | Your strategy may need fields the tool lacks |
| Updates | Price and fundamentals refresh schedule | Stale data produces stale screens |
| Workflow | Saved screens, alerts, watchlists, export | Determines whether you re-run screens consistently |
| Price | Free-tier limits vs paid features | Costs recur; verify current pricing on the official site |
Run the same simple screen, for example profitable large cap technology companies above a set market cap, across each service you are testing. Differences in result counts usually reveal differences in data coverage or definitions, such as how each service calculates a ratio. That single test tells you more than any marketing page.
Example screens you can copy
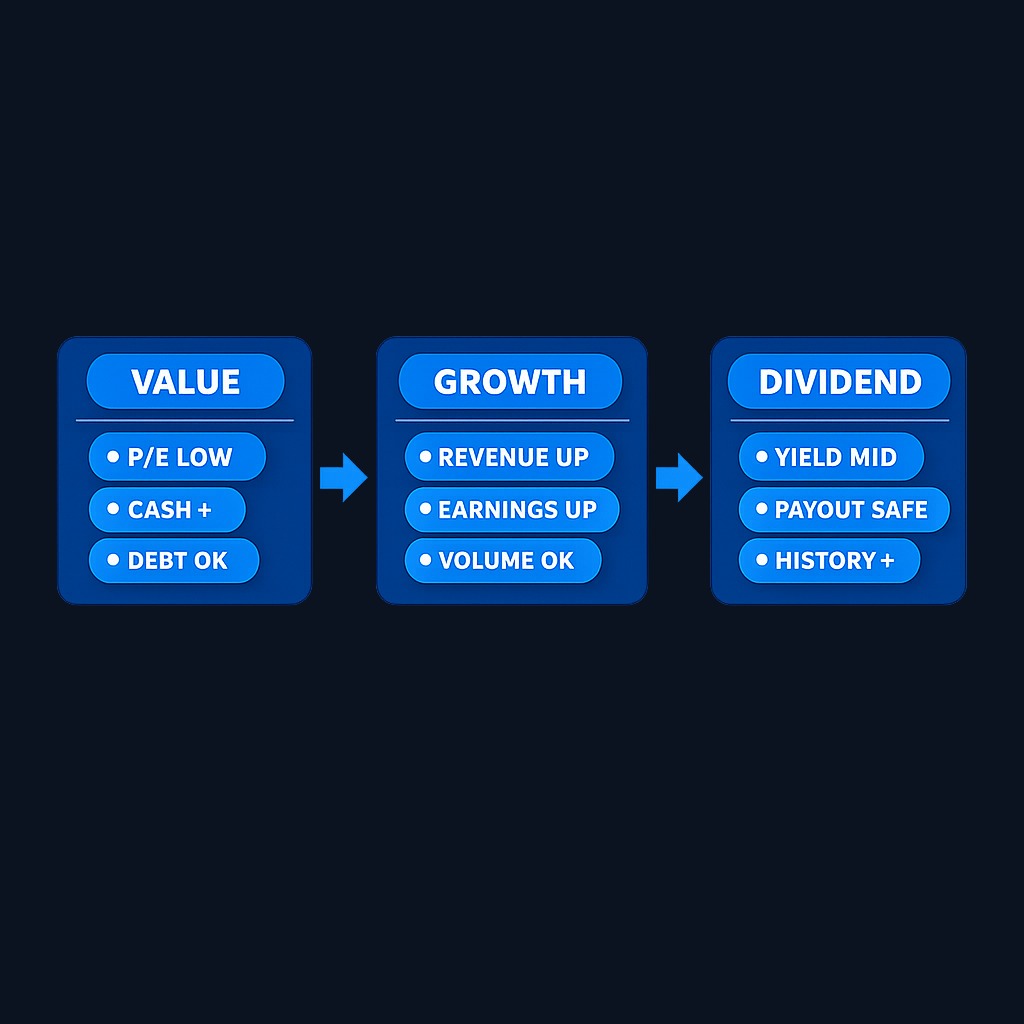
Concrete starting points help more than theory. Here are three classic screens investors adapt, each expressed in plain criteria:
- Value screen. Companies on the NYSE or NASDAQ with a price-to-earnings ratio below their industry median, positive free cash flow, and manageable debt. This hunts for shares the market may be underpricing.
- Growth screen. Companies with revenue and earnings growth above a chosen rate for several years running, trading above a minimum daily volume so the shares stay liquid.
- Dividend income screen. Companies with a moderate dividend yield, a payout ratio below a safe ceiling, and a multi-year history of maintaining or raising the dividend.
Momentum-oriented traders add technical criteria instead, such as price above a rising moving average or a new 52-week high, and send the results straight to a watchlist with charts. Some platforms also layer in analyst ratings or earnings estimates as optional criteria. Be cautious with screens that surface very cheap penny stocks: low prices, thin volume, and sparse data make results unreliable. Whatever template you start from, adjust the criteria to your own goals and risk tolerance rather than copying someone else's screen blindly.
Common mistakes when using stock screeners
The tool is simple; the errors come from how people use it:
- Over-filtering. Stacking ten strict conditions returns three stocks and hides good candidates that barely missed one cutoff. Start loose, then tighten.
- Chasing one metric. A screen sorted only by the lowest P/E or highest yield attracts value traps and companies in distress. Pair valuation filters with quality filters.
- Ignoring definitions. Two screeners can define the same ratio differently, using trailing versus forward earnings, for example. Read the field definitions before trusting the output.
- Treating results as recommendations. Passing a screen means a company matched filters on a given day, nothing more. The research starts after the screen.
- Never re-running the screen. Data changes every quarter. A list from six months ago no longer reflects the market or the companies on it.
- Ignoring survivorship in backtests. If a tool offers backtesting, check whether it accounts for companies that were delisted, or historical results will look better than reality.
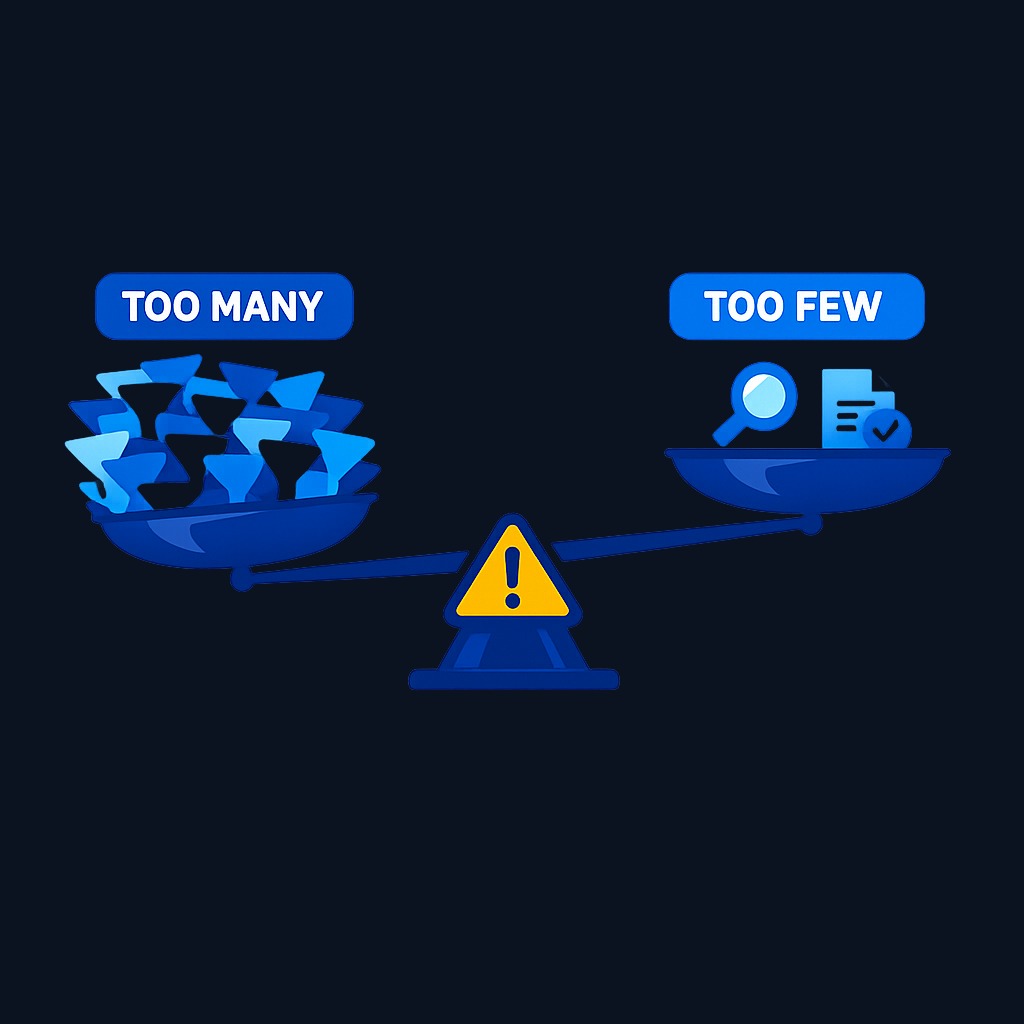
A good habit: write down why each filter exists in one sentence. If you cannot explain a filter, remove it.
Conclusion and next steps
A stock screener turns an unmanageable market into a short, criteria-based list of companies worth your research time. Understand how the filters work, match the tool type to your strategy, verify the definitions behind each metric, and avoid the over-filtering traps above. Then re-run your screen on a schedule so your watchlist stays current.
Next steps: define one goal in a sentence, whether that is finding dividend payers to buy, growth companies to research, or liquid stocks to trade, then translate it into three to five filters, run it on a free screener, and research the top five results properly before any trade. If you want to build the underlying skills first, Finelo offers structured, beginner-friendly investing education that covers the metrics screeners are built on.
Frequently asked questions
What is the best stock screener for beginners?
The best starting point is a free screener with solid fundamental filters and a clean results table, ideally one connected to research pages so you can inspect each company quickly. Test two or three free options with the same screen and keep the one whose workflow you understand fastest.
Are free stock screeners good enough?
For most beginners, yes. Free tiers typically handle core filters like market cap, valuation, dividends, and sector well. Paid tiers earn their cost only when you need deeper data, custom formulas, real-time updates, or backtesting, so upgrade when a specific limitation blocks you, not before.
Can a stock screener predict which stocks will go up?
No. A screener filters historical and current data; it does not forecast returns, and passing a screen never guarantees performance. Use it to organize research, then evaluate each company's business, risks, and price on your own before making any decision.
How many filters should a screen use?
Three to six well-chosen filters usually balance focus and breadth. Fewer than three returns an unmanageable list; many more than six tends to over-fit. Add one filter at a time and watch how the result count changes so you understand what each condition removes.
stockscreenerscomprehensive
Practice trading with Finelo
Practice in a simulator, learn with bite-sized lessons, and build confidence before risking real money.
About the author
Finelo Team
The Finelo Team creates practical investing and trading education designed to help beginners learn faster with structured challenges, simulator practice, and bite-sized lessons.
Keep reading — Related articles
Trading
Understanding Walk Forward Analysis in Trading
Brief educational note: this article is educational — not investment advice — and trading involves the risk of loss.
Finelo Team
Trading
VWAP vs Moving Average: Formulas, Uses, and Limits
VWAP weights price by recorded volume over a defined period, while a moving average summarizes a sequence of prices over a rolling lookback.
Finelo Team
Trading
Volume Profile vs Market Profile: What Each Chart Measures
Volume Profile groups traded volume by price level.
Finelo Team


