Earnings yield tells you how much a company earns per year for every dollar you pay for its stock, expressed as a percentage. You calculate it by dividing earnings per share by the share price. A stock earning $5 per share and trading at $100 has an earnings yield of 5%.
What is Earnings Yield and How Can It Impact Your Investments?

Earnings yield tells you how much a company earns per year for every dollar you pay for its stock, expressed as a percentage. You calculate it by dividing earnings per share by the share price. A stock earning $5 per…
5 min read
Practice trading with Finelo
Practice in a simulator, learn with bite-sized lessons, and build confidence before risking real money.
Want to learn more?
Practice in a simulator, learn with bite-sized lessons, and build confidence before risking real money.
Explore FineloExplore Finelo's 28-day challenges
Turn learning into a daily habit with guided challenge paths.
If you have ever wondered whether a stock's price is high or low relative to the profit behind it, earnings yield is one of the fastest checks available. This page is for beginner and intermediate investors who want a practical way to compare stocks against each other and against alternatives like bonds. Everything here is educational, not financial advice.
How to calculate earnings yield
The formula is the inverse of the familiar P/E ratio:
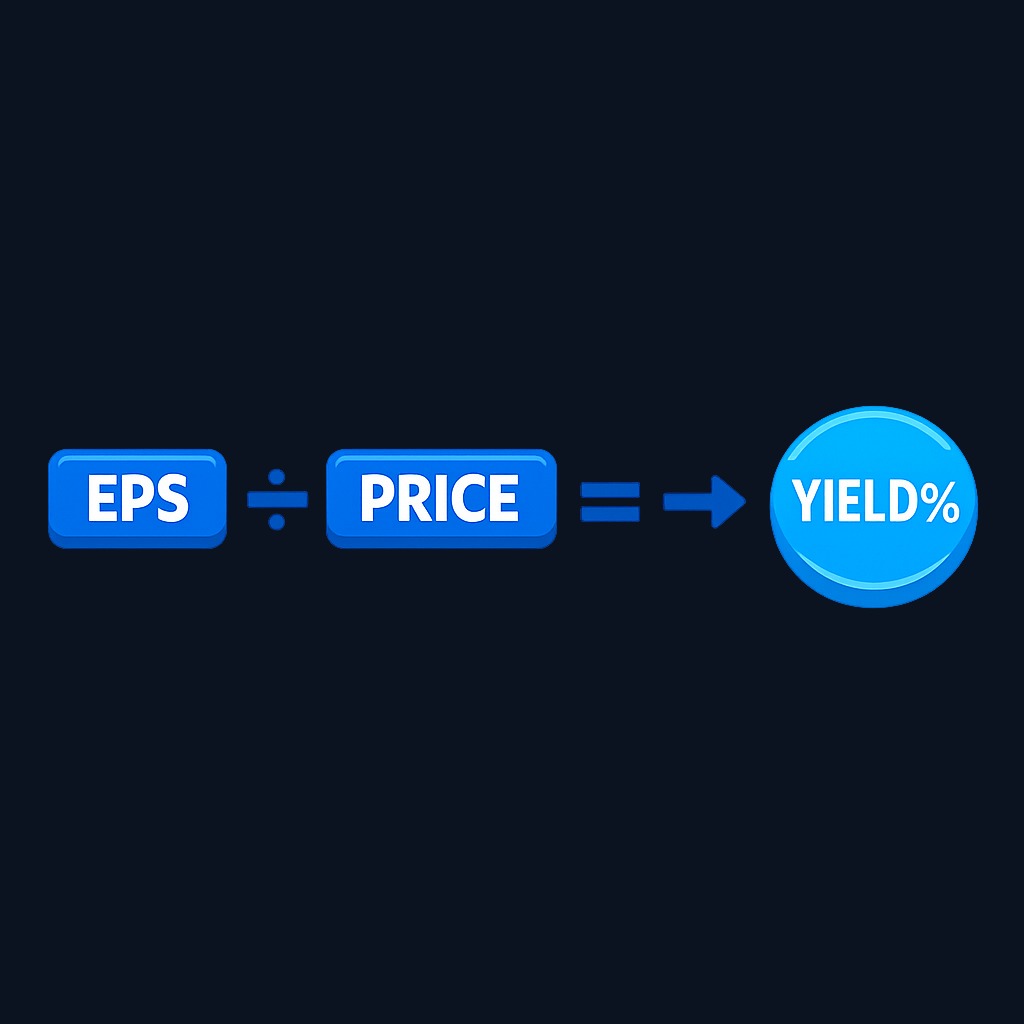
Earnings yield = earnings per share (EPS) ÷ price per share × 100%
You can also compute it for a whole market index by dividing total index earnings by the index level. The inputs matter as much as the math:
- Trailing earnings yield uses EPS from the last 12 months of reported results.
- Forward earnings yield uses analysts' estimates of the next 12 months of earnings.
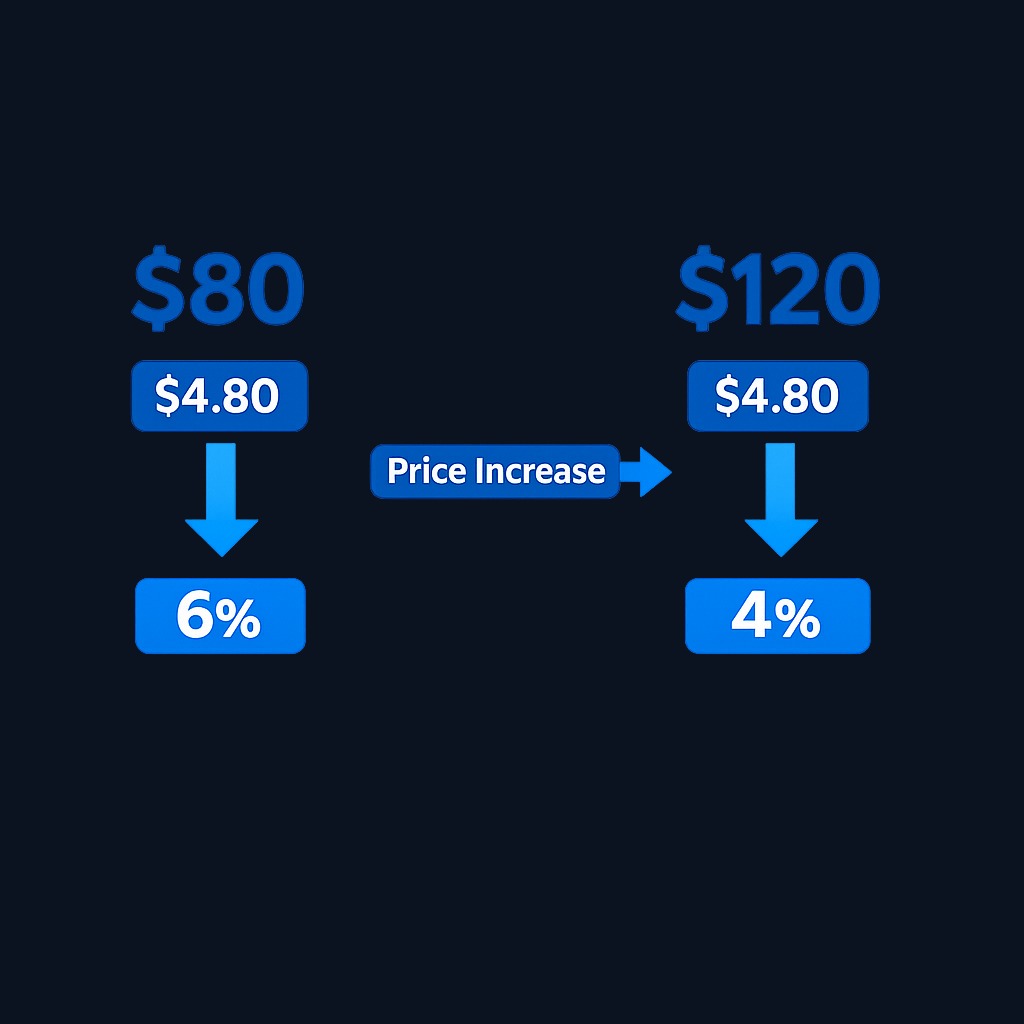
A quick worked example: a company reports $4.80 in earnings per share over the past year, and the stock trades at $80. Divide 4.80 by 80 and you get 0.06, or a 6% earnings yield. If the price climbs to $120 while earnings stay flat, the yield falls to 4%. Same company, same profits, but each dollar you invest now buys less earning power. Public companies report EPS in their quarterly and annual filings, which you can read for free in the SEC's EDGAR database, so the raw numbers are always a few clicks away.
Earnings yield vs. P/E ratio: key differences
Earnings yield and the P/E ratio contain the same information flipped upside down, but each presentation is useful for a different job.
| Question | Earnings yield | P/E ratio |
|---|---|---|
| Format | Percentage return per dollar invested | Price paid per dollar of earnings |
| Best for | Comparing stocks to bonds and cash yields | Comparing valuation between similar stocks |
| Reading | Higher may suggest a cheaper price | Lower may suggest a cheaper price |
| Weakness | Meaningless with negative earnings | Meaningless with negative earnings |
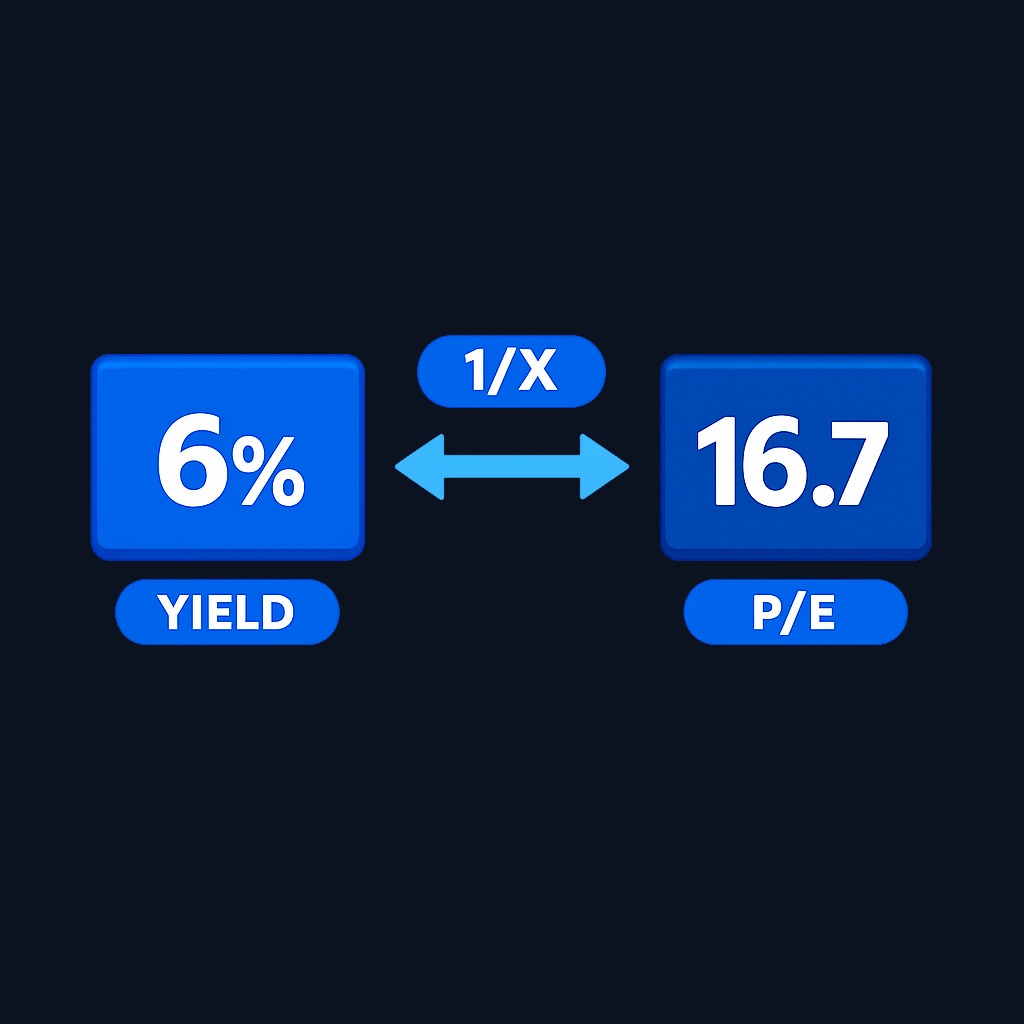
The percentage format is the real advantage. A 6% earnings yield can be lined up directly against a bond yield or a savings rate, which makes cross-asset comparison intuitive. A P/E of 16.7 carries the same fact but hides the comparison. Many financial writers use the two interchangeably; pick whichever framing helps your decision, and remember that dividend yield is a different metric entirely, since it measures only the cash actually paid out to shareholders.
Practical applications of earnings yield
Investors put earnings yield to work in three common ways. First, cross-asset comparison: when the earnings yield of a stock or index sits far above prevailing bond yields, some investors read stocks as relatively attractive, and vice versa. This comparison is sometimes called an earnings-yield spread. Second, screening: ranking a peer group of companies by earnings yield quickly surfaces the ones priced lowest relative to current profits. Value-oriented approaches, including some well-known quantitative screens, lean heavily on this ranking. Third, sanity-checking a hot stock: computing the earnings yield of a high-flying name shows exactly how little current profit each invested dollar buys, which reframes the growth assumptions baked into the price.
None of these uses makes the metric a verdict. A high earnings yield can mean a bargain, or it can mean the market expects earnings to fall. That distinction always requires reading the business, not just the ratio.
Practice trading with Finelo
Practice in a simulator, learn with bite-sized lessons, and build confidence before risking real money.
Limitations of earnings yield
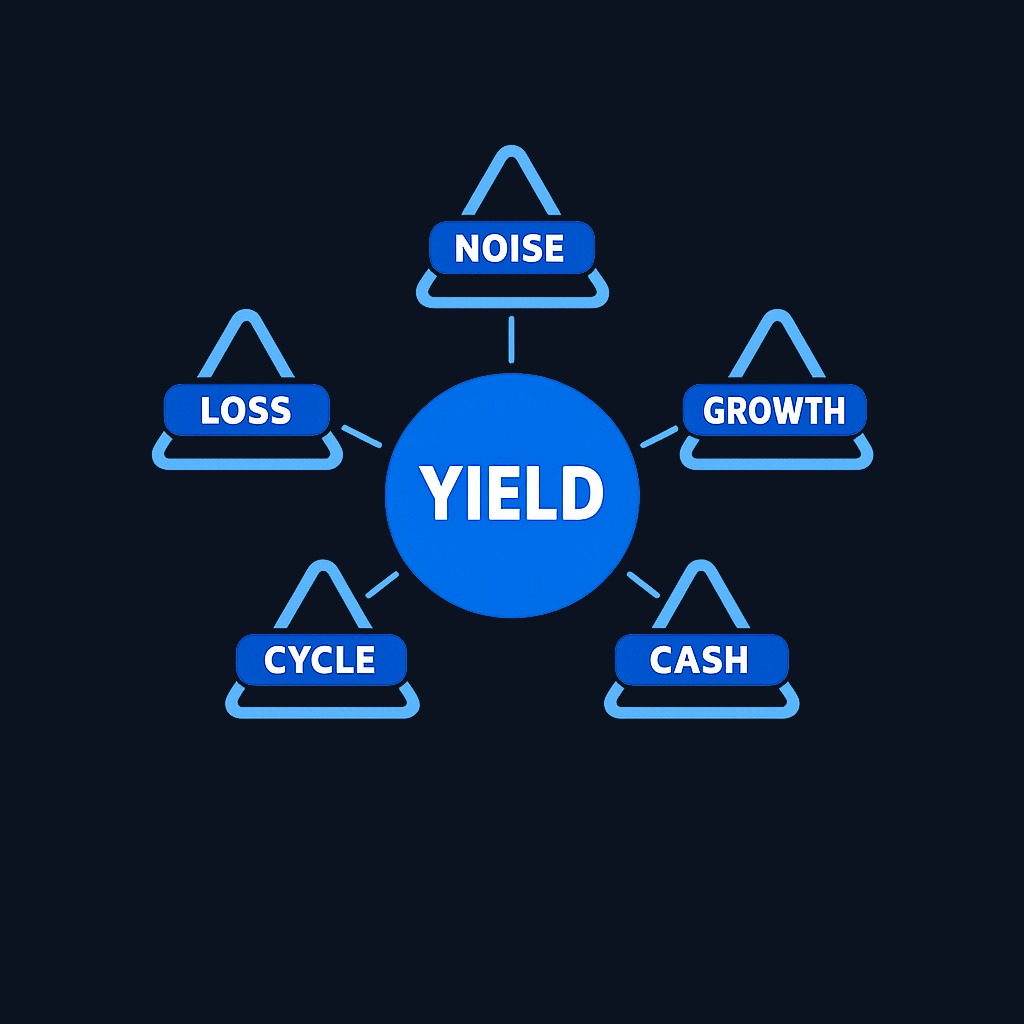
Earnings yield inherits every flaw of reported earnings, so treat it carefully:
- Negative earnings break it. A loss-making company has a negative earnings yield, which tells you little.
- Earnings are lumpy. One-time charges, asset sales, and accounting choices distort a single year's EPS.
- It ignores growth. A slow-decline business and a fast-growing one can show the same yield today while heading in opposite directions.
- Cyclical peaks mislead. At the top of an earnings cycle the yield looks fat right before profits shrink.
- It is not cash in hand. Unlike a bond coupon, an earnings yield is not paid to you; the company keeps and reinvests most of it.
Decision framework: when earnings yield should influence a decision
Use this order of operations before acting on the number. First, confirm earnings are positive and reasonably clean; strip out obvious one-time items. Second, compare within a peer group, since typical yields differ across industries. Third, compare against alternatives such as bond yields to judge whether the potential reward covers stock risk. Fourth, ask why the yield is high or low: check the revenue trend, debt, and competitive position for an explanation. Fifth, confirm with a second metric, such as free cash flow or growth expectations, before treating the stock as cheap or expensive. If the yield looks attractive and survives all five checks, it has earned a place in your research shortlist, not an automatic buy.
Conclusion and next steps
Earnings yield flips the P/E ratio into a percentage, letting you compare the profit behind a stock price against other stocks, bonds, and cash. It shines as a screening and comparison tool, and it misleads when earnings are negative, inflated, or about to turn. Next step: compute trailing and forward earnings yield for two stocks you follow, compare them with a current bond yield, and write down what would need to be true for the cheaper-looking stock to actually be the better deal.
Frequently asked questions
What is a good earnings yield?
There is no universal threshold. Many investors compare a stock's earnings yield to bond yields and to industry peers rather than a fixed number. A yield well above both may signal value or hidden risk, so investigate the reason before assuming a bargain.
Is earnings yield the same as dividend yield?
No. Earnings yield measures all profits per dollar of share price, whether the company keeps or distributes them. Dividend yield measures only the cash dividends paid to shareholders. A company can have a strong earnings yield and pay no dividend at all.
How does earnings yield relate to the P/E ratio?
They are reciprocals. Divide 1 by the P/E ratio and you get the earnings yield, and vice versa. A P/E of 20 equals a 5% earnings yield. Both compare price to earnings; the yield format simply makes cross-asset comparisons easier.
Should I use trailing or forward earnings yield?
Trailing yield uses real reported earnings and is factual but backward-looking. Forward yield reflects expectations but depends on estimates that can miss. Many investors check both: a large gap between them signals that big earnings changes are expected.
earningsyieldimpactinvestments
Practice trading with Finelo
Practice in a simulator, learn with bite-sized lessons, and build confidence before risking real money.
About the author
Finelo Team
The Finelo Team creates practical investing and trading education designed to help beginners learn faster with structured challenges, simulator practice, and bite-sized lessons.
Keep reading — Related articles

Trading
Understanding Walk Forward Analysis in Trading
Brief educational note: this article is educational — not investment advice — and trading involves the risk of loss.
Finelo Team
Trading
VWAP vs Moving Average: Formulas, Uses, and Limits
VWAP weights price by recorded volume over a defined period, while a moving average summarizes a sequence of prices over a rolling lookback.
Finelo Team

Trading
Volume Profile vs Market Profile: What Each Chart Measures
Volume Profile groups traded volume by price level.
Finelo Team


