Finelo Blog
Learn investing and trading, one article at a time. Practical guides, beginner-friendly explainers, and learning tips from the Finelo team.

Understanding OTM: Out of the Money Explained
OTM means “out of the money.” In options trading, an OTM option is a call or put option with zero intrinsic value; any price it still has comes from time value and other external factors, often called extrinsic value out...

The Morning Star Pattern: A Key Indicator in Candlestick Trading
The morning star pattern is a three-candle candlestick formation that traders use as a potential sign of a bullish reversal after a price decline Navia’s formation overview.

The Inverse Head and Shoulders Stock Pattern Explained
The inverse head and shoulders stock pattern is a chart formation traders use as a potential bullish reversal signal.

How to Read Candlesticks: A Complete Guide for Traders
To read candlesticks, start with one candle at a time: identify the open, close, high, and low, then compare the candle’s body and wicks to the candles around it.

How Many Trading Days Are There in a Year?
There are usually about 252 trading days in a year for U.S. stock markets. The exact number changes because markets close on weekends, exchange holidays, and occasional special closures; some years may have around 250, 2...

The Descending Triangle Pattern: Key Insights for Traders
A descending triangle pattern is a technical analysis formation marked by a flat support line and a downward-sloping resistance line.

Day Trading for Beginners: Strategies, Risks, and Tips
Day trading for beginners means learning how to buy and sell securities within the same trading day, usually aiming to profit from short-term price moves rather than long-term ownership.

Candlestick Reversal Patterns in Forex Trading
Candlestick reversal patterns in forex are price-action signals that suggest a current move may be losing strength and a new direction could develop.

Bullish and Bearish Trading Patterns Explained
Bullish and bearish trading patterns are chart formations traders use to judge whether price may continue or reverse direction.
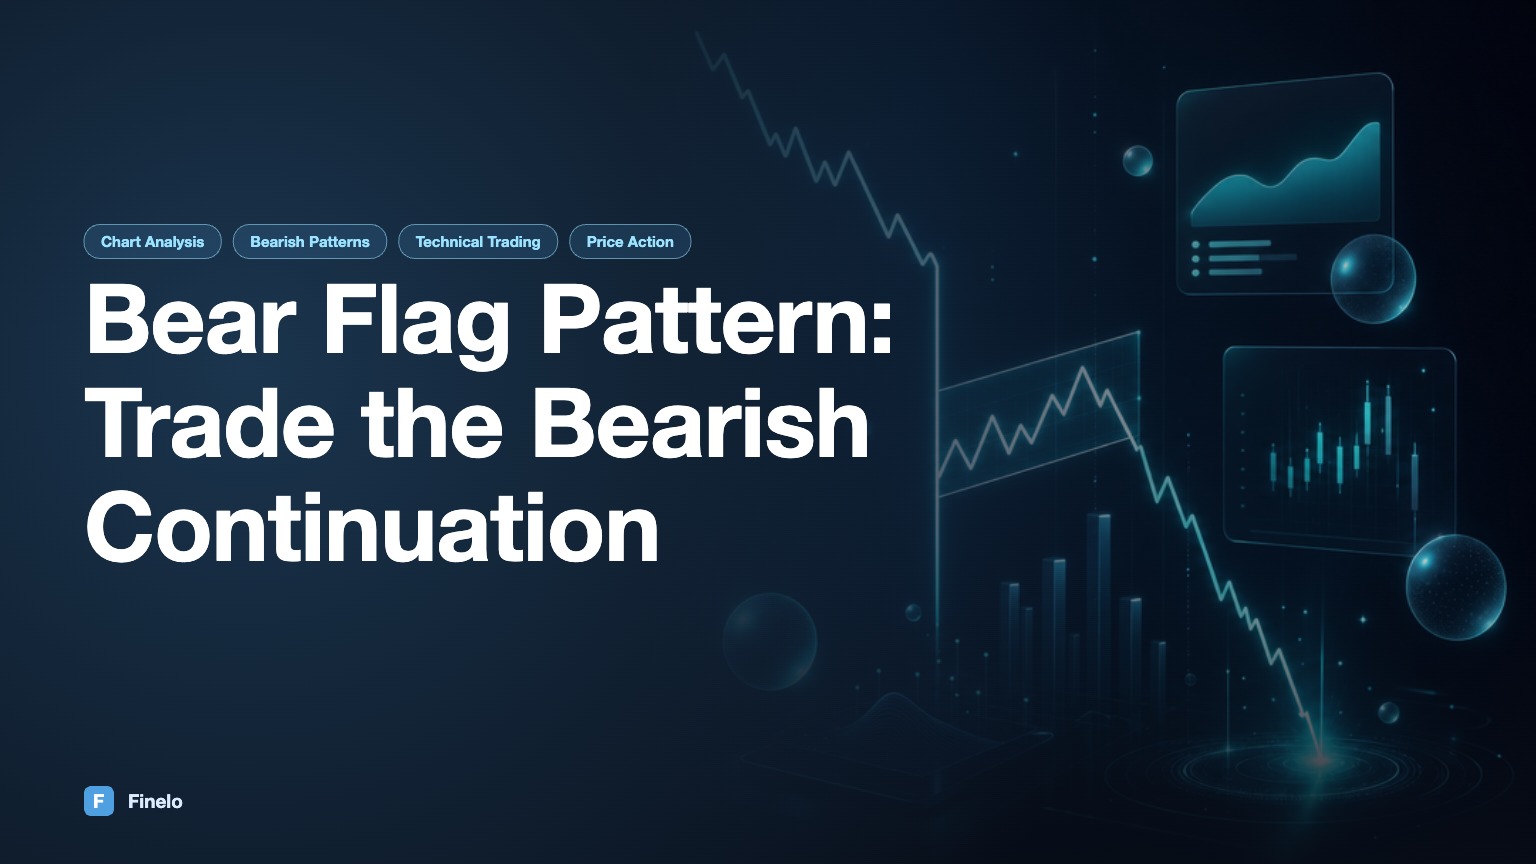
The Bear Flag Pattern: Definition, Analysis, and Trading Strategies: Use Cases, Benefits, and Next Steps
A bear flag pattern is a bearish continuation chart pattern: price falls sharply to form the “flagpole,” then pauses in a smaller consolidation that often slopes upward before sellers regain control and price breaks lowe...

New in Finelo: AI Trading Bots That Find Setups for You
Finelo's newest feature — AI bots that scan real market data around the clock, explain every setup in plain language, and wait for your approval. Here's what's new and how to try it.

Cup and Handle Pattern: A Beginner's Guide to Reading It
The cup and handle is a bullish chart pattern with a rounded base and a smaller pullback near resistance. Learn how to spot it, plan an entry, target, and stop, and recognize when it fails.
Browse by category
AI Trading
Articles, guides, and explainers about ai trading.
34 articlesChart Analysis
Articles, guides, and explainers about chart analysis.
51 articlesFinancial Literacy
Core money concepts explained simply for everyday financial confidence.
178 articlesInvesting
Long-term investing guides, portfolio basics, and wealth-building fundamentals.
29 articlesNews
Market news explainers that turn current events into lasting financial literacy.
63 articlesTrading
Active trading concepts, market mechanics, and disciplined practice strategies.